
How to Monitor HAProxy with the ELK Stack

HAProxy is TCP/HTTP reverse proxy load-balancing software that is available as open source software for both community and enterprise users. HAProxy has become the standard in the load balancing and high-availability management industry because it is available in most Linux distributions and is also the reference load-balancer for cloud orchestrator projects such as OpenStack and CloudStack as well as container orchestrators such as Kubernetes.
Why Use HAProxy?
From a very high-level point of view, HAProxy is a reverse-proxy that stands between clients and servers. As such, it is a very powerful scheduler for processing and manipulating buffers of data between clients and servers during either client-to-server or server-to-client data flows.
HAProxy is organized in front ends and back ends that are respectively the client- and server-side proxies where we configure where and how HAProxy should accept inbound traffic and where and how it is supposed to forward the traffic.
Because of HAProxy’s strategic position and its way of working, it is able to report a lot of very useful information:
- The path followed by a request through HAProxy: frontend, backend, or server
- Some of the event duration:
- How long did the client take to send the full HTTP request?
- How long was the request queued (if it was queued at all)?
- How long did the TCP connection’s establishment on the server side last (as far as the return of the SYNACK packet)
- How long did the server take to process the response (when the HTTP headers were sent to HAProxy)
- The time between the beginning and the end of the session (when the whole data was pushed to the client)
- HTTP-related information:
- HTTP query (method, URL, and HTTP version protocol)
- HTTP status code of the response
- Response size (including headers)
- A cookie exchanged between a client and a server
- HTTP request or response headers as defined by the configuration
- Cookie-based information:
- Did the client provide a valid cookie?
- Did HAProxy have to set up a new cookie?
- The termination status of the session:
- How has the session been terminated (properly, with a client-side error, with a server-side error, with a HAProxy termination, or today)
- Why has the session had been terminated (properly, with a timeout, with a connection close, or with a HAProxy rule such as “deny” “redirect,” or something else)
HAProxy is also very famous for its flexibility. It is possible to define your own log format string with the “log format” directive so that it will contain the specific information that you need.
There are a few other methods to teach HAProxy what to log:
- “option dontlognull” and “option http-ignore-probes” to avoid logging empty connections
- “option dontlog-normal” to log only errors
- “http-request set-log-level <severity> <condition>”: to change the <severity> of the logline matching the <condition>
Thanks to HAProxy logs, it is very easy to spot issues on a network or in an application because we can easily know:
- The exact cause of a session error
- The timeout on the client or server-side
- The connection that was closed in the middle of the stream by either the client or server
- The sort URLs or servers by:
- The number of requests, valid requests, and errors
- The application response time
- The TCP connection time
About the ELK Stack
The ELK Stack is the most common log analytics solution with hundreds of thousands of users including Netflix, GitHub, LinkedIn, Facebook, Microsoft, and Cisco.
The stack consists of three different open source components: Elasticsearch, Logstash and Kibana. As we noted earlier, Elasticsearch is a NoSQL database that is based on the Lucene search engine. Logstash is a log pipeline tool that accepts inputs from various sources, executes different transformations, and exports the data to various targets. Kibana is a visualization layer that works on top of Elasticsearch.
Extracting Information from HAProxy to the ELK Stack
HAProxy is a high-performance component, so you can extract information with syslog. (Logstash can accept syslog messages, and we will show that specific configuration later on.)
More on the subject:
The log format of HAProxy is robust and can include a variety of fields. You can instruct HAProxy to write on every closed connection, connections that were ended, or connections that were added in error. We chose to only information only on connections that end in errors because of that amount of data provided enough information and did not overload the ELK Stack.
Check out the following in order to get more information regarding HAProxy logging.
The Technical Guide to HAProxy and the ELK Stack
Step 1: Download and Set Up the ELK Stack
We at Logz.io have published the following guides on installing the ELK Stack:
In the rest of this guide, we will use the Logz.io enterprise-grade ELK as a service for the sake of clarity, but this overall process can be implemented on any ELK Stack installation.
Step 2: Configure HAProxy to Ship Logs via Syslog
HAProxy is a network device, so it can only transmit log information via the syslog protocol. To configure HAProxy to ship logs to an ELK stack, you need to follow two steps.
First, configure HAProxy’s logging capabilities so that it can transmit the logs to a local rsyslog server. Then, you need to ship the logs from rsyslog to your ELK stack. In the following configuration, we will show how to ship the HAProxy data to the Logz.io enterprise-grade ELK as a service — but this configuration would work with any ELK installation.
The HAProxy configuration:
global
   # wiil send it to the localhost on port 11514 over UDP, we set the facility to ‘local1’
   log 127.0.0.1:514 len 4096 local1

# HTTP Defaults
defaults HTTP
   # refer to the global log definition
   log global
   # disable logging of normal, successful connections
   option dontlog-normal
   mode http
   # Enable logging of HTTP request, session state and timers
   option httplog

listen INPUT_NAME_HTTP
   bind :PORT

   server SERVER_NAME SERVER_ADDRESS:PORT

# TCP Defaults
defaults TCP
   # refer to the global log definition
   log global
   # disable logging of normal, successful connections
   option dontlog-normal
   mode tcp
   # Enable advanced logging of TCP connections with session state and timers
   option tcplog

listen INPUT_NAME_TCP
   bind :PORT

   server SERVER_NAME SERVER_ADDRESS:PORT
The Rsyslog configuration:
We will configure rsyslog to accept the HAProxy log information and ship it to Logz.io. To make this work, you will need to open a free account and have your token handy to replace in the relevant location.
To configure your local rsyslog, run:
vi /etc/rsyslog.conf
Add the following content (it might be different based on your specific context). Make sure to replace LOGZIO_TOKEN with the token that you can find on the Settings page:
$ModLoad imuxsock # provides support for local system logging
$ModLoad imklog # provides kernel logging support
$ModLoad imudp
$UDPServerAddress 0.0.0.0 # listen on the localhost , protocol UDP
$UDPServerRun 514 # listen on port 514, protocol UDP
$KLogPermitNonKernelFacility on
$ActionFileDefaultTemplate RSYSLOG_TraditionalFileFormat
$RepeatedMsgReduction on
$FileOwner syslog
$FileGroup adm
$FileCreateMode 0640
$DirCreateMode 0755
$Umask 0022
$PrivDropToUser syslog
$PrivDropToGroup syslog
$WorkDirectory /var/spool/rsyslog

# the logz.io syslog template,
$template HAProxyLogzioFormat,"[LOGZIO_TOKEN] <%pri%>%protocol-version% %timestamp:::date-rfc3339% %HOSTNAME% %app-name% %procid% %msgid% [type=haproxy] %msg%\n"

# Send messages to Logz over TCP using the template.
*.* @@listener.logz.io:5000;HAProxyLogzioFormat
Step 3: Parse the Data
Logstash uses a combination of regular expression contracts called groks and also has the ability to enrich data.
This is an example of a HAProxy message:
54.243.31.203:27656 [01/Feb/2016:12:52:37.178] SYSLOG_TCP_5000 SYSLOG_TCP_5000/PROD-listener-green-1-i-32c6cb81 1/-1/0 0 CC 594/99/99/33/0 0/0
This is the recommended Logstash configuration to use when parsing HAProxy syslog messages:
grok {
match => [
"message", "%{IP:client_ip}:%{NUMBER:client_port:int} \[%{NOTSPACE:haproxy_timestamp}] %{NOTSPACE:frontend_name} %{NOTSPACE:backend_name}/%{NOTSPACE:server_name} %{NUMBER:time_queue:int}/%{NUMBER:time_backend_connect:int}/%{NUMBER:time_duration:int} %{NUMBER:bytes_read:int} %{NOTSPACE:termination_state} %{NUMBER:actconn:int}/%{NUMBER:feconn:int}/%{NUMBER:beconn:int}/%{NUMBER:srvconn:int}/%{NUMBER:retries:int} %{NUMBER:srv_queue:int}/%{NUMBER:backend_queue:int}" ,
"message" , "%{IP:client_ip}:%{NUMBER:client_port:int} \[%{NOTSPACE:haproxy_timestamp}\] %{NOTSPACE:frontend_name} %{NOTSPACE:backend_name}/%{NOTSPACE:server_name} %{NUMBER:time_client_req:int}/%{NUMBER:time_queue:int}/%{NUMBER:time_backend_connect:int}/%{NUMBER:time_server_response:int}/%{NUMBER:time_duration:int} %{NUMBER:status_code:int} %{NUMBER:bytes_read:int} %{NOTSPACE:captured_request_cookie} %{NOTSPACE:captured_response_cookie} %{NOTSPACE:termination_state_with_cookie_status} %{NUMBER:actconn:int}/%{NUMBER:feconn:int}/%{NUMBER:beconn:int}/%{NUMBER:srvconn:int}/%{NUMBER:retries:int} %{NUMBER:srv_queue:int}/%{NUMBER:backend_queue:int}?( \"%{GREEDYDATA:full_http_request}\")?( %{NOTSPACE:captured_response_headers})?"
]
}
date {
match => [ "haproxy_timestamp", "dd/MMM/yyyy:HH:mm:ss.SSS" ]
}
grok {
match => [
"full_http_request", "%{WORD:http_verb} %{URIPATHPARAM:http_request}?( HTTP/%{NUMBER:http_version})" ,
"full_http_request", "<%{WORD:http_request}>"
]
remove_field => [ "full_http_request" ]
}
So, You Managed to Get HAProxy Logs Into ELK. Now What?
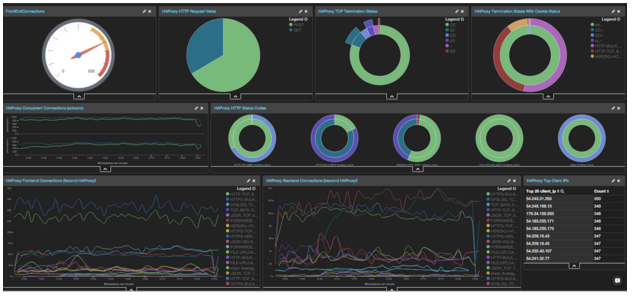
Logz.io is using HAProxy and have created a few visualization and dashboards to monitor it. To get ELK apps for HAProxy, you can go here. Here are a couple of examples of dashboard visualizations and dashboard that people frequently use.
Health
Troubleshooting
As we saw in the introduction, HAProxy can report information including:
- The termination status of an HTTP session (an individual request and the corresponding response)
- Whose server was chosen to process the request
- Which URL the request was targeting
Out of all the termination statuses that HAProxy may produce, the one that is relevant in this context is “sH.” the ‘s’ means that a timeout was triggered on the server side, and the H means that the server was in the HTTP Header phase (actually, it did not send a full response header). When you have such “sH” termination status, HAProxy mandatorily generates a 504.
Now, thanks to the information provided by HAProxy in the logs, we can use the ELK Stack to create some graphs or charts to visualize the following information (which will be very important when troubleshooting the app):
- When does the “sH” occur? (at any time, during peak periods, during maintenance)
- Where does the sH occur? (on a single server at all URLs, on all the servers at all URLs, on a single server at a single URL, on all the servers at a single URL)
- When the 504 occurs on a server, how many sessions is this server processing in parallel? (this is also provided in the log data)
Thanks to all these metrics, we will be able to reduce the scope of the investigation to either:
- An isolated problem on a server
- An isolated problem in the application
- An application-scalability issue
- An issue in a component behind the application
- A limited server capacity
Based on the diagnostic findings, different actions could be taken to ensure that this type of error will not occur anymore. At the HAProxy layer, for example, we may increase the “timeout server” value or enable a queueing mechanism to protect weak applications or URLs from killing the application or database.
Audit
HAProxy log lines can be customized to log any data that HAProxy may fetch from the streams and buffers it handles. One piece of interesting data that we usually collect is the TLS SNI sent by a client. This information is mandatory when we want to host multiple TLS certificates over a single IP. (The purpose is to save IPv4 addresses.)
You have to switch to the log-format directive and collect somewhere in your logline the output of the following fetch: ssl_fc_sni. It is usually required to combine this with the User-Agent string. To ensure compatibility, HAProxy’s documentation has instructions on how to emulate the line generated by the “option httplog” format.
Your configuration may contain the following directive, in either a frontend or default section:
capture request header Host len 32
capture request header User-Agent len 64
log-format %ci:%cp\ [%t]\ %ft\ %b/%s\ %Tq/%Tw/%Tc/%Tr/%Tt\ %ST\ %B\ %CC\ %CS\ %tsc\ %ac/%fc/%bc/%sc/%rc\ %sq/%bq\ %hr\ %hs\ {%[ssl_fc_sni]}\ %"%[capture.req.method]\ %[capture.req.hdr(0)]%[capture.req.uri]\ %[capture.req.ver]"
Now, thanks to HAProxy, we can know exactly:
- What percentage of clients supports TLS SNI
- What percentage of traffic is compatible with TLS SNI
- Which type of clients do not support it, if any
- Whether it is safe to mutualize one public IP address to host many TLS certificates

You Might Also Like

Introducing Warm Tier: Cost-Efficient Log Storage to Simplify Observability

Perfect Your Cloud’s Deployment with Logz.io & AWS CloudFormation Public Registry
Get started for free
Completely free for 14 days, no strings attached.
