
Introducing Pre-Installed Logz.io Metrics Dashboard Bundles
September 27, 2021

We are proud to announce the launch of direct dashboard uploads with Logz.io. These new metrics dashboard templates are available for 25 different tools and more to come. Each of these templates is now available to Logz.io customers and covers the gamut of popular monitoring tools used by DevOps teams. Some of these tools also include multiple options.
The process is simple. Head into the Logz.io app and head to your metrics account. Click Send Your Data and find Pre-Build Dashboards on the left side menu. You’ll see all the available packages, which will expand over time. Here is the initial list of pre-made metrics dashboards:
- Amazon MQ
- Amazon S3
- Amazon EC2
- Amazon API Gateway
- Amazon App ELB
- Amazon Classic ELB
- Amazon DynamoDB
- Amazon EBS
- Amazon EC2 Auto Scaling
- Amazon Kinesis
- Amazon Kinesis Data Firehose
- Amazon Lambda
- Amazon Network ELB
- Amazon RDS
- Amazon Route 53
- Amazon SNS
- Amazon SQS
- Telegraf for Prometheus metrics
- MongoDB metrics
- MySQL metrics
- PostgreSQL metrics
- Redis metrics
- System metrics
- Vmware Vsphere metrics
- Kubernetes over Helm with OpenTelemetry
Installing Metrics Dashboard Bundles via the Logz.io App
Any service with a prefab dash option will be listed under Metrics → Send Your Data. Head over to the Pre-built dashboards option on the white left-side menu. As of this post, again, there are 25 tool options. Select the one you want.
Follow the shipping instructions for a given tool and hit the yellow button labeled Install dashboard bundle. Then, hit the View in Metrics button that appears in place of the yellow button (or that pops up to the right side of the screen).

You’ll be whisked away to your prefabricated dash. The following are examples from the list above.
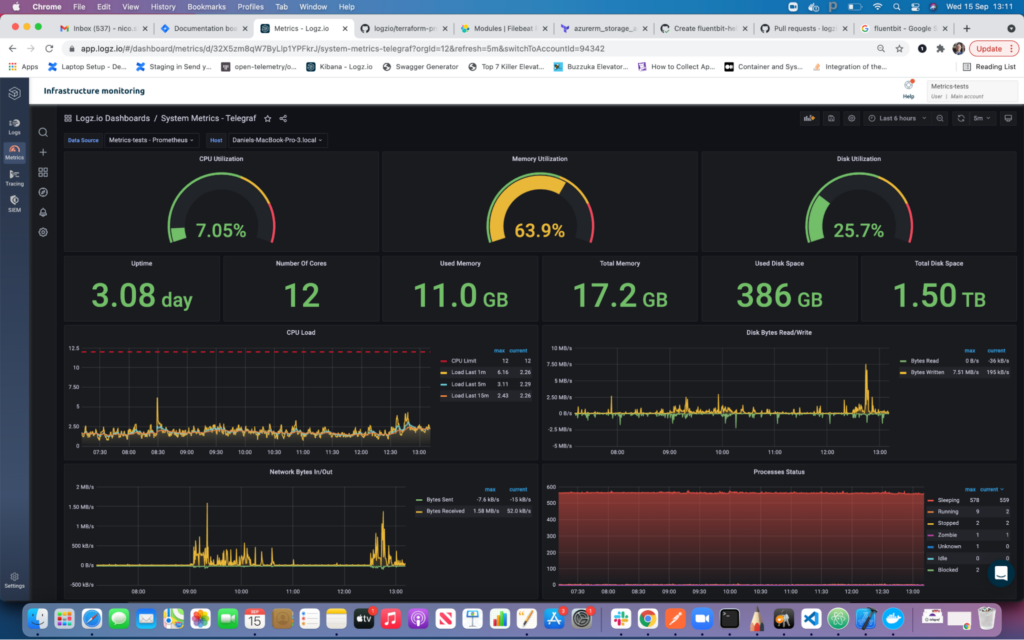
The first shows a system metrics dashboard for Telegraf. CPU, memory, and disk utilization feature prominently in gauges at the top. Immediately below those sit several counters that dive deeper into that data/ Below that, there are graphs tracking CPU load, network bytes, and more.
The next example uses demo data to populate our Cloudwatch/EC2 dashboard. It covers the number of running instances, credit usage, and network packets. Other preinstalled dashboards cover critical stats for AWS tools like Kinesis, the Elastic Load Balancer (classic and network), Lambda functions, S3, and more.

Subscribe to the blog for more updates on Logz.io Infrastructure Monitoring, including more preinstalled dashboard bundles.

You Might Also Like

Introducing enhancements to the Logz.io Security Analytics App – RSA 2019

