
Linux System Auditing with Auditbeat and the ELK Stack

Monitoring what’s going on inside a system is key to protecting it. A number of tools or daemons, such as systemd, icrond and auditd, were built to help Linux users keep track of changed files, as well as monitor and access the processes being run in the system.
Since auditd executes the auditing on the kernel level and below userspace, you can hook into any system operation you want to, making system penetration much harder. So for security use cases, and due to its ease of use and comprehensiveness, this tool has gained popularity.
For ELK users, an auditd module was added to Metricbeat as an alternative to using the distro-supplied auditd, but this solution was somewhat limited. In ELK Stack 6.0 (beta), a new auditd-based log shipper called Auditbeat is now available for ELK users.
The combination of kernel-level auditing together with the power of Kibana and Elasticsearch has huge promise, so let’s take a closer look, shall we?
Setting Up Elasticsearch and Kibana 6.0 (Beta)
If you’ve already got Elasticsearch and Kibana 6 set up, skip to the next section. Just in case you haven’t, the following instructions will take you through the process of installing and configuring these components of the ELK Stack on Ubuntu 16.04.
Note, you will need Java 8 installed to complete these steps.
Installing and Configuring Elasticsearch
First, download and install the Elasticsearch signing key:
wget -qO - https://artifacts.elastic.co/GPG-KEY-elasticsearch |
sudo apt-key add -
On Debian, it’s recommended you also install the apt-transport-https package:
sudo apt-get install apt-transport-https
Then, save the repository definition:
echo "deb
https://artifacts.elastic.co/packages/6.x-prerelease/apt stable
main" | sudo tee -a /etc/apt/sources.list.d/elastic-6.x.list
To install Elasticsearch, enter:
sudo apt-get update && sudo apt-get install elasticsearch
A few changes to the Elasticsearch configuration file for the purpose of this tutorial (not recommended for any other purpose other than dev):
sudo vim /etc/elasticsearch/elasticsearch.yml
network.host: “0.0.0.0”
http.port: 9200
Start Elasticsearch with:
sudo service elasticsearch start
To make sure all is running as expected, enter:
sudo curl http://localhost:9200
 {
 "name" : "pVQKLZb",
 "cluster_name" : "elasticsearch",
 "cluster_uuid" : "1ceEI_r9TtOVG1C_3WdLkQ",
 "version" : {
 "number" : "6.0.0-beta1",
 "build_hash" : "896afa4",
 "build_date" : "2017-08-03T23:14:26.258Z",
 "build_snapshot" : false,
 "lucene_version" : "7.0.0",
 "minimum_wire_compatibility_version" : "5.6.0",
 "minimum_index_compatibility_version" : "5.0.0"
 },
 "tagline" : "You Know, for Search"
 }
Installing and Configuring Kibana
To install Kibana, enter the following command:
sudo apt install kibana
Again, some configuration changes to the Kibana config file:
sudo vim /etc/kibana/kibana.yml

server.port: 5601
elasticsearch.url: "http://localhost:9200"
server.host: "0.0.0.0"
To start Kibana, use:
sudo service kibana start
Opening our browser at http:{serverIP}:5601, we will see Kibana displayed.

Kibana is telling us we need to define an index pattern. To do this, we will install Auditbeat and index some data.
Installing and Configuring Auditbeat
To install Auditbeat, use this command:
sudo apt install auditbeat
Auditbeat is configured in the ‘/etc/auditbeat/auditbeat.yml’ file:
sudo vim /etc/auditbeat/auditbeat.yml
First, in the Modules configurations section, you need to define which Auditbeat module and metricsets to use to collect the audit information. For now, Auditbeat supports the Audit module with the File and Kernel metricsets, and these are enabled by default.
Two example kernel rules are commented out, so either uncomment them or define your own audit rules. If you want to audit additional file paths, add them under ‘file.paths’.
Second, you need to decide where to output the data to. The default configuration ships the data to a local Elasticsearch, which will do me just fine for now, but you can also send the data to a Logstash instance if you like.
Once done, start Auditbeat:
sudo service auditbeat start
Querying Elasticsearch, you should see a new Auditbeat index created:
curl -XGET 'localhost:9200/_cat/indices?v&pretty'

health status index                            uuid                     pri rep docs.count docs.deleted store.size pri.store.size
yellow open   .kibana                          oHl7-pscRyKbFCdcx3obFw   1 1              1            0      3.6kb          3.6kb
yellow open   auditbeat-6.0.0-beta1-2017.08.28 AcaKWjnFToiCf__3NsYwWw   5 1              8            0      92.7kb         92.7kb
In Kibana, we can now enter ‘auditbeat-*’ as the index pattern and open the discover tab to start analyzing the audit data.

Shipping to Logz.io
With a few tweaks to the configuration file, you can easily configure Auditbeat to ship data to Logz.io.
First, download an SSL certificate required for shipping to Logz.io, and move it to the correct directory:
wget https://raw.githubusercontent.com/logzio/public-certificates/master/COMODORSADomainValidationSecureServerCA.crt

sudo mkdir -p /etc/pki/tls/certs
sudo cp COMODORSADomainValidationSecureServerCA.crt
/etc/pki/tls/certs/
Then, open the Auditbeat configuration file and apply the following changes.
In the General section, add the Logz.io token (which can be found in the Settings page) and the following required fields:
fields:
  logzio_codec: json
   token: tWMKrePSAcfaBSTPKLZeEXGCeiVMpuHb
fields_under_root: true
ignore_older: 3h
document_type: audit
In the Outputs section, comment out the default Elasticsearch output and define the Logz.io listener and SSL certificate location:
output.logstash:
  hosts: ["listener.logz.io:5015"]
  ssl.certificate_authorities:
["/etc/pki/tls/certs/COMODORSADomainValidationSecureServerCA.crt"]
In the Outputs section, comment out the default Elasticsearch output and define the Logz.io listener and SSL certificate location:
output.logstash:
     hosts: ["listener.logz.io:5015"]
     ssl.certificate_authorities:
["/etc/pki/tls/certs/COMODORSADomainValidationSecureServerCA.crt"]
After restarting Auditbeat, you should see data in Logz.io
Analyzing the Audit Data
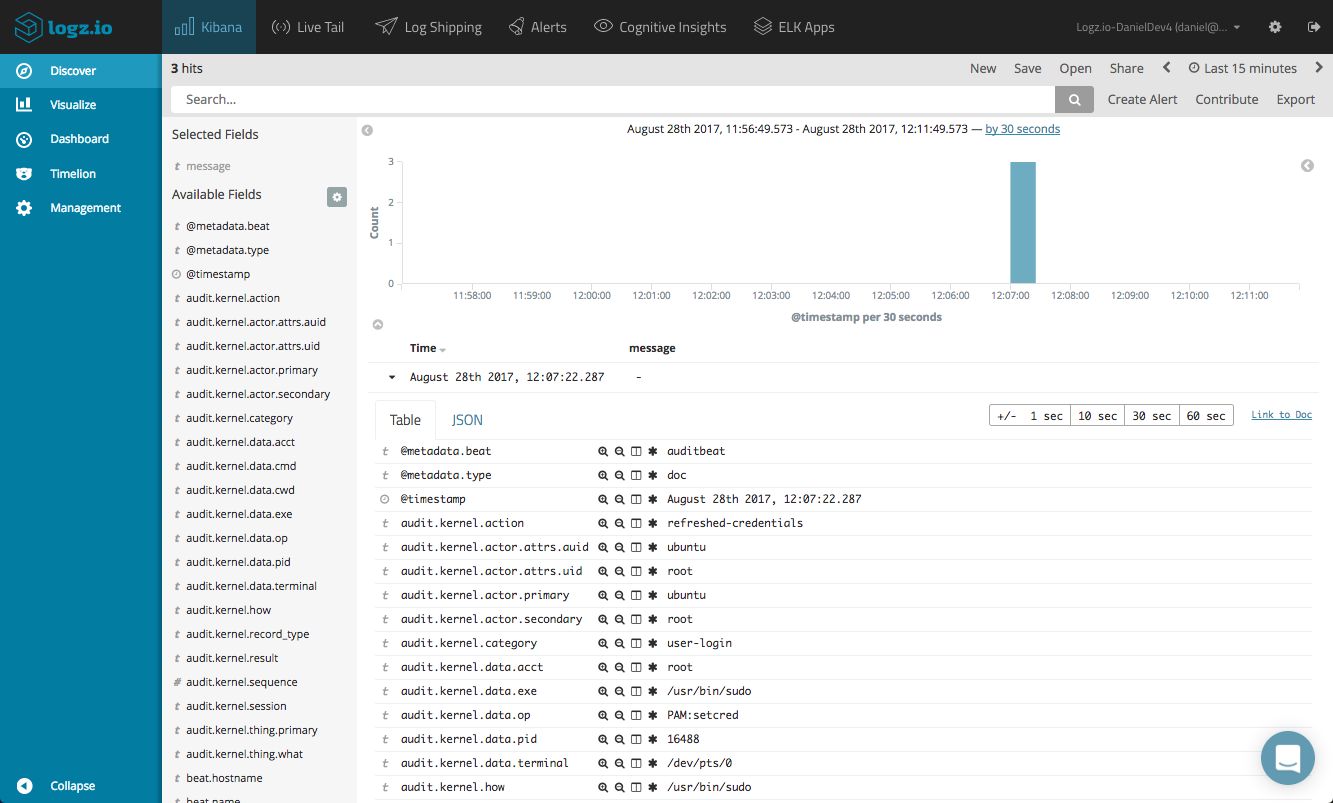
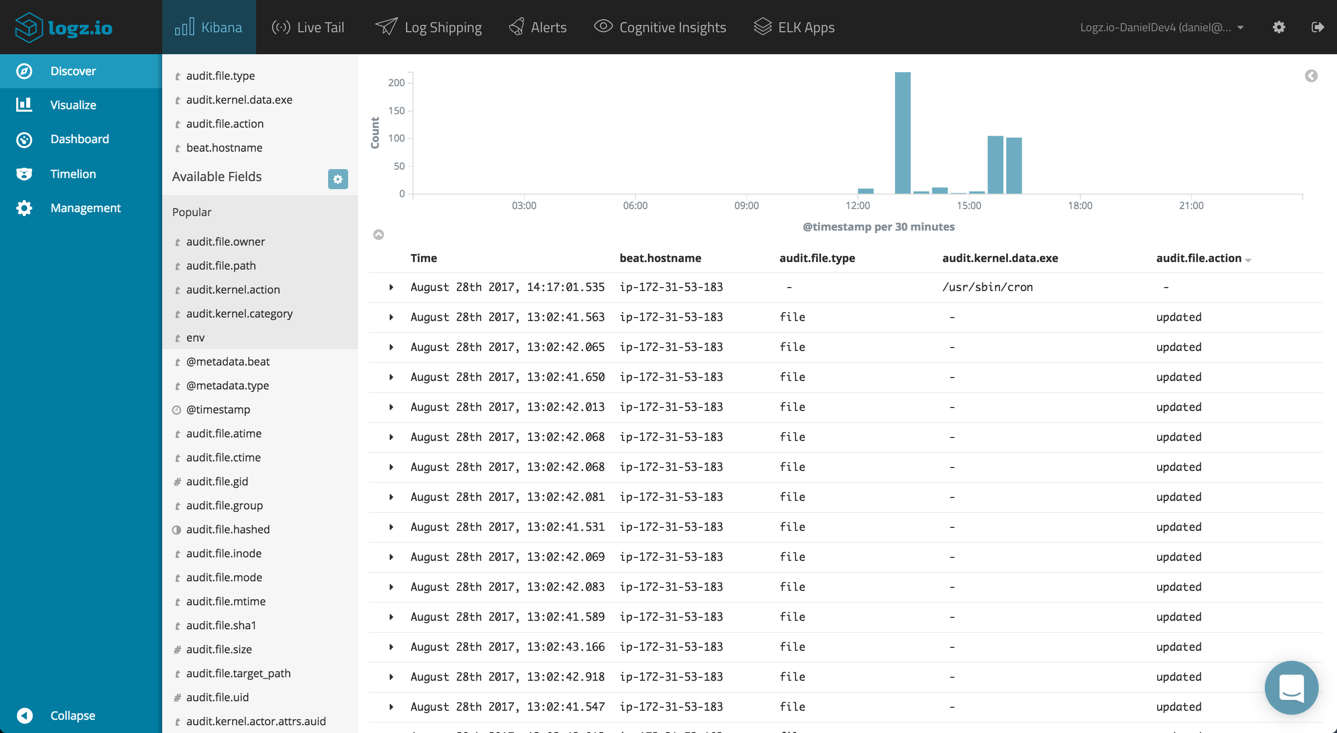
Once the audit data is displayed in Kibana, you can start analyzing and monitoring the data. Start by getting more visibility by adding some fields to the main display area.
A useful field to add when you have multiple Auditbeat agents on different machines sending data is the beat.hostname field. This is a beat-generic field that will display the IP of the host sending the data.
For analyzing the kernel metricset, you can add the audit.kernel.action field for seeing the action taken by the user. When auditing changes to files using the file metricset, you can add the audit.file.action to see the actual change to the file (e.g. created, deleted, etc.). A full list of the available fields is available here.
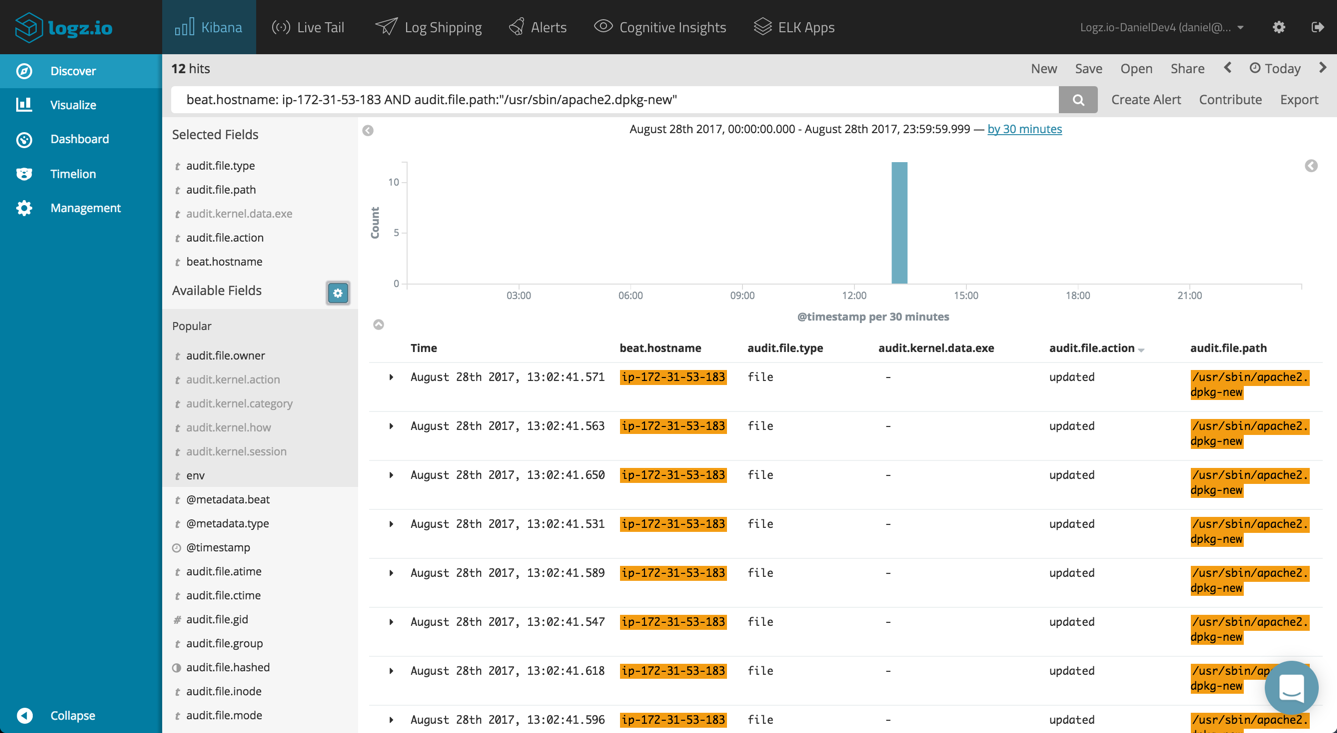
Using Kibana queries, you can look for specific audit data. For example, if you’re looking for changes made to a specific file on one of the servers:
beat.hostname: ip-172-31-53-183 AND
audit.file.path:"/usr/sbin/apache2.dpkg-new"
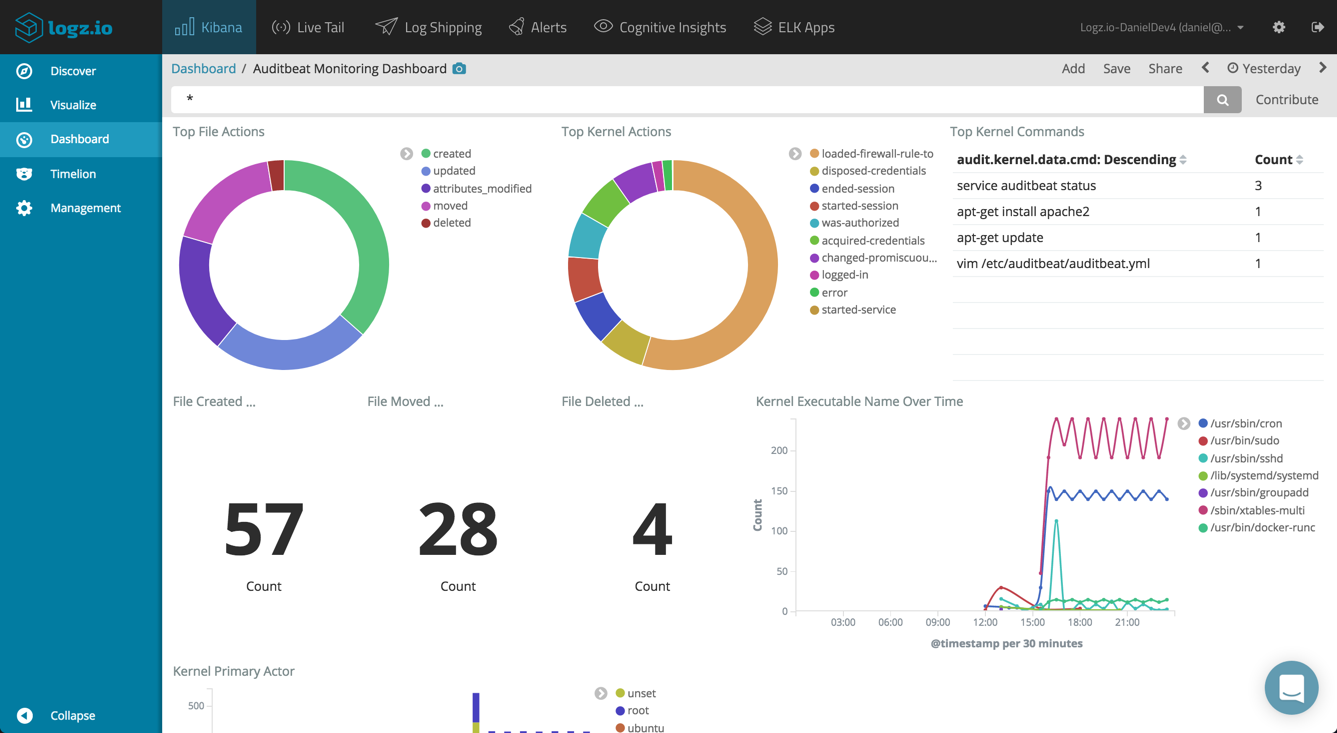
Building an Auditing Dashboard
Visualizing and dashboarding the collected file and kernel data in Kibana is the next step towards monitoring your system. Kibana is renowned for its visualization features, and these are being enhanced from version to version. Using Auditbeat, you will have scores of fields that can be utilized for constructing visualizations and eventually, a comprehensive dashboard. Below are just a few examples, but of course, you can slice and dice the data as you see fit.
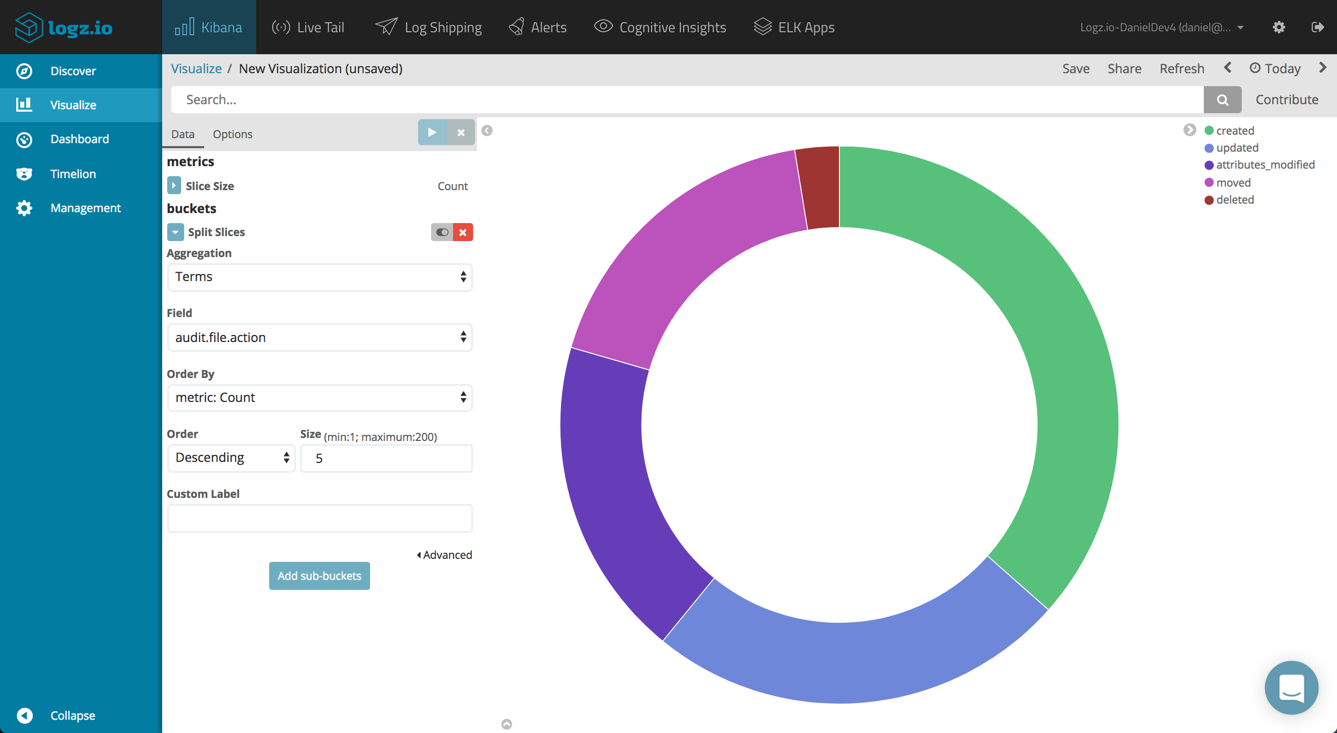
Top File Actions
You can start by building a pie chart visualization, giving you a breakdown of the most frequent type of file changes performed. To do this, you can use a simple Terms aggregation of the audit.file.action field.
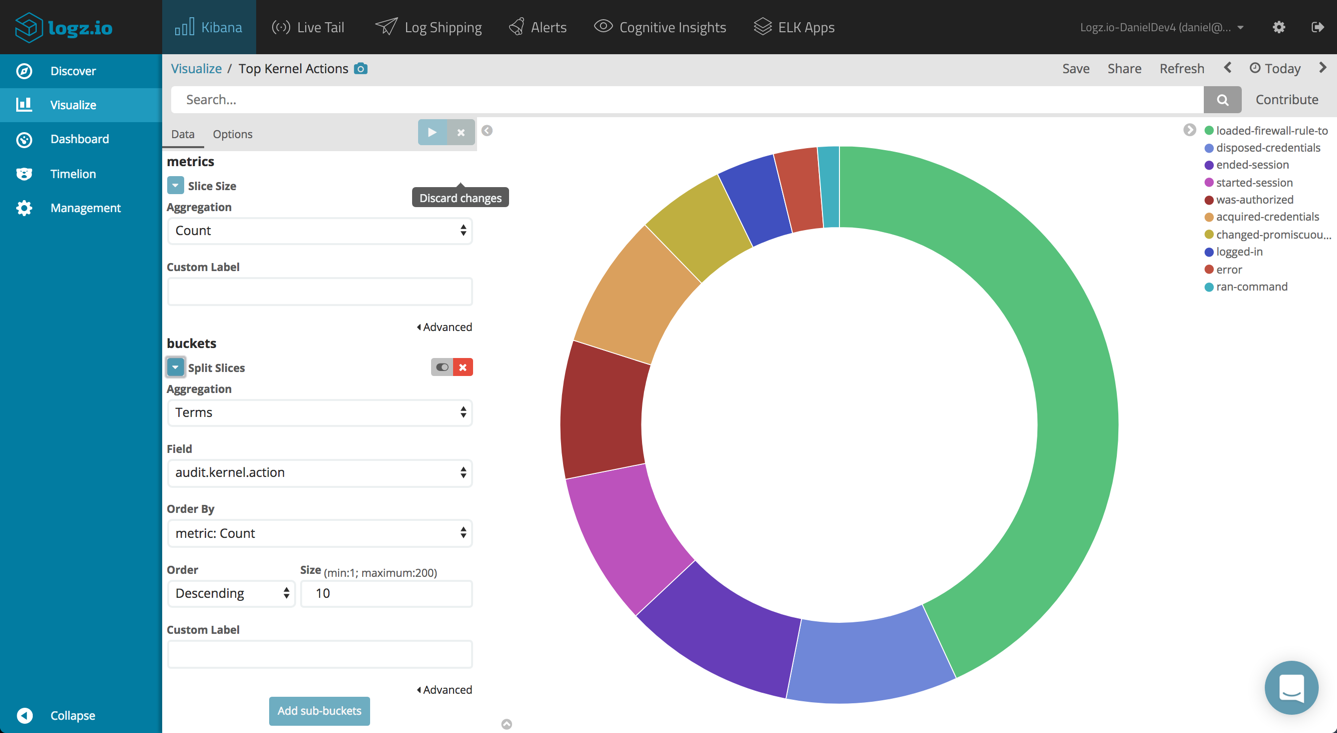
Top Kernel Actions
Same goes for the top kernel actions performed, only this time you will use the audit.kernel.action field.
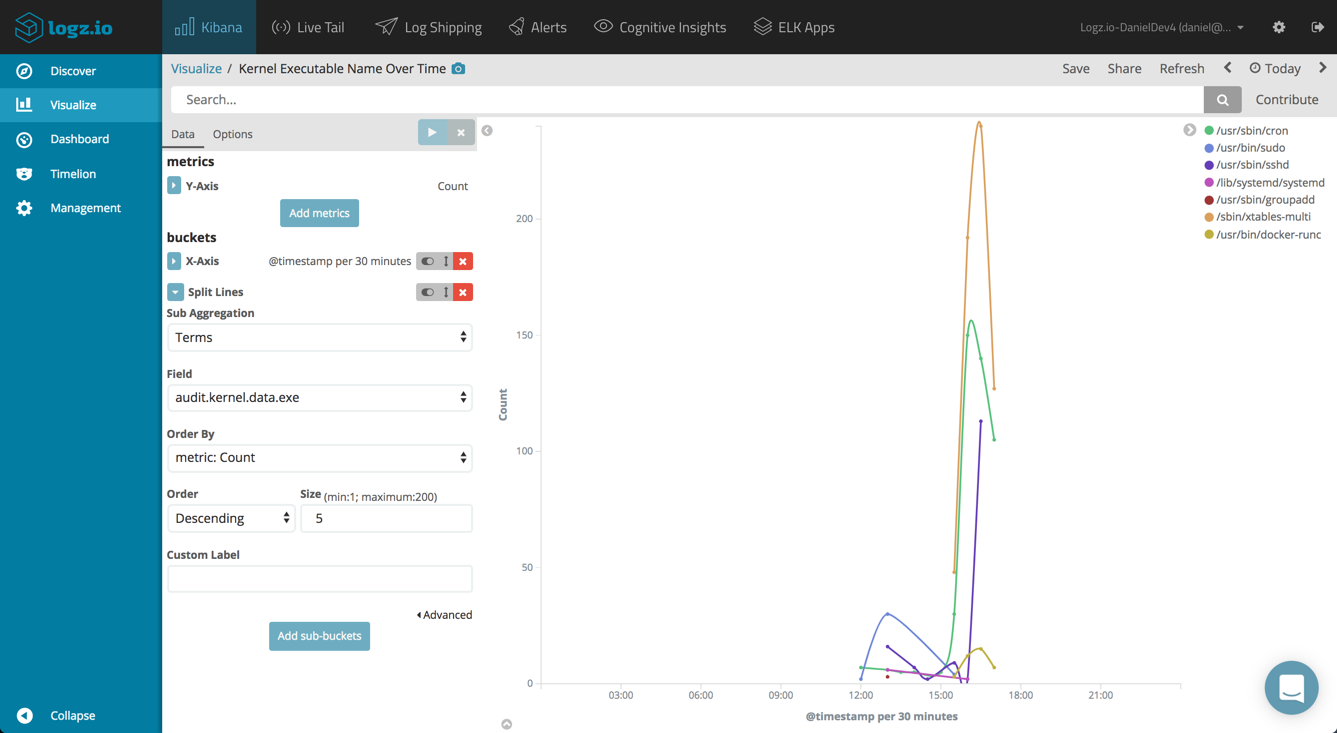
Kernel Executable Name Over Time
It would also be interesting to monitor the executed processes in the system over time. A line chart visualization, using a Date Histogram for the X-axis and a Terms aggregation of the audit.kernel.data.exe field will do the job nicely.
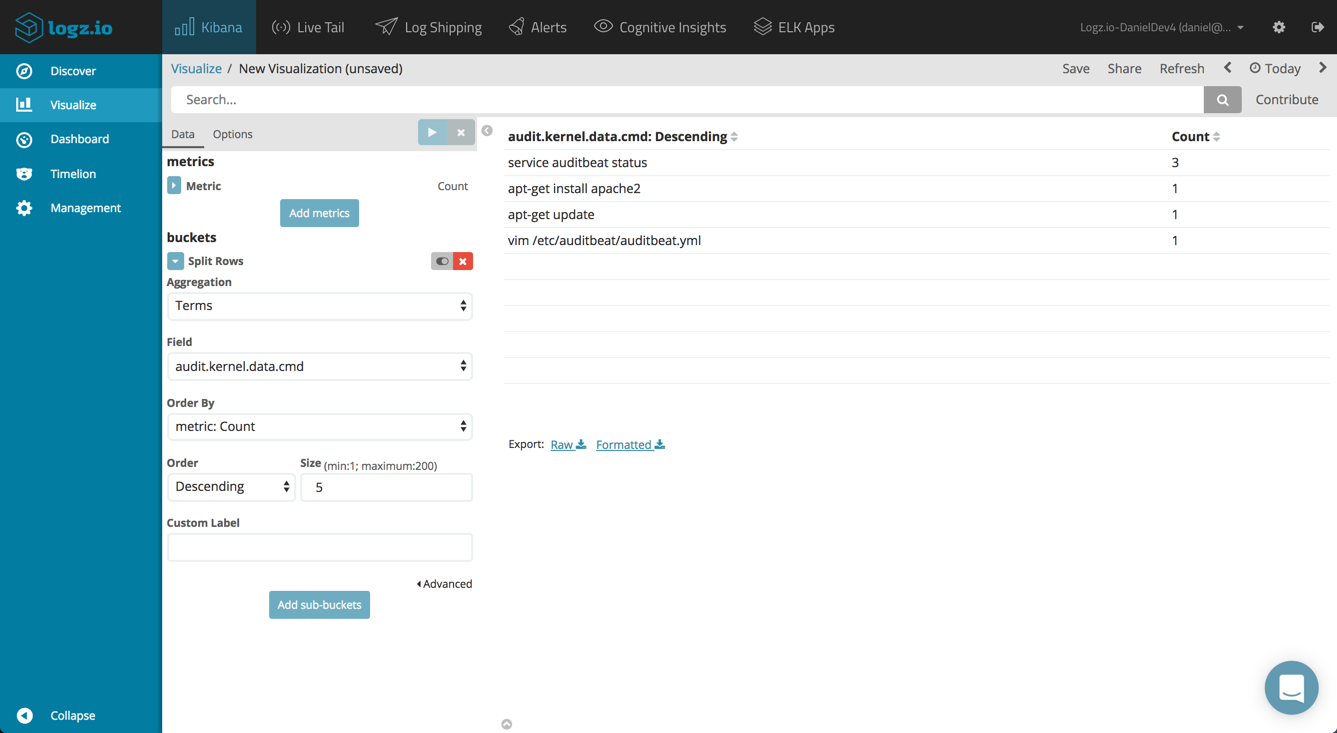
Top Kernel Commands
Another visualization can list the top kernel commands executed. This time, we will use the Data Table visualization and the audit.kernel.data.cmd field.
The sky’s the limit here, and you can combine all of these visualizations together build an extremely comprehensive auditing dashboard.
Endnotes
System auditing is a crucial component of a series of compliance and security protocols. Thankfully, there are a variety of tools, both open source and proprietary, that give you the ability to perform effective monitoring and accounting.
More on the subject:
Auditbeat seems to be a great solution as it wraps the functionality of auditd together with the powerful analysis and visualization capabilities built into Elasticsearch and Kibana. This is just the beginning (Auditbeat is part of the beta version of ELK Stack 6), so we can expect this beat to improve in the near future, but for now, I recommend taking it for a ride and enjoying the granularity of information it gives.
Happy auditing!

You Might Also Like

How to Get Full Kubernetes Observability in Minutes

Monitoring Azure Application Gateway with Logz.io
Get started for free
Completely free for 14 days, no strings attached.
