Announcing Logz.io Unified Dashboards

In today’s cloud environments, a typical observability stack might include an Elasticsearch cluster for logging, a few Prometheus servers for metrics monitoring, and an AppDynamics deployment for APM. You may run something similar – most observability stacks consist of multiple siloed tools dedicated to collecting and analyzing specific types of monitoring data.
But with this approach, engineers would need to scramble across these three separate interfaces to connect the dots between their logs, metrics, and traces to analyze the data during a production incident. This is why using multiple observability tools can prolong investigations that require teams to quickly correlate information from different datasets.
Now imagine logging into a single observability platform, opening up a favorite dashboard, and seeing all of the data that you need – logs, metrics, and traces – brought together side by side. Now, all you need to do is add a few filters to narrow down the data to quickly gather all the information needed to understand exactly what is causing the production incident.
Sounds nice, right?
Get the Full Picture with Logz.io Unified Dashboards
During ScaleUp 2021, Logz.io announced Unified Dashboards is coming soon. This huge next step in advancing Logz.io’s full stack observability platform will allow users to visualize and filter their logs, metrics, and traces in a single dashboard!
Logs, metrics, and traces all provide helpful, but different, insights into the current and past states of a system. When you have all the data side by side, you can quickly see the full picture of your environment. Now, you can accomplish all of this without bouncing between separate interfaces specific to log, metric, or trace analytics.
Using this unified platform approach, engineers can investigate problems faster so they can resolve them sooner.

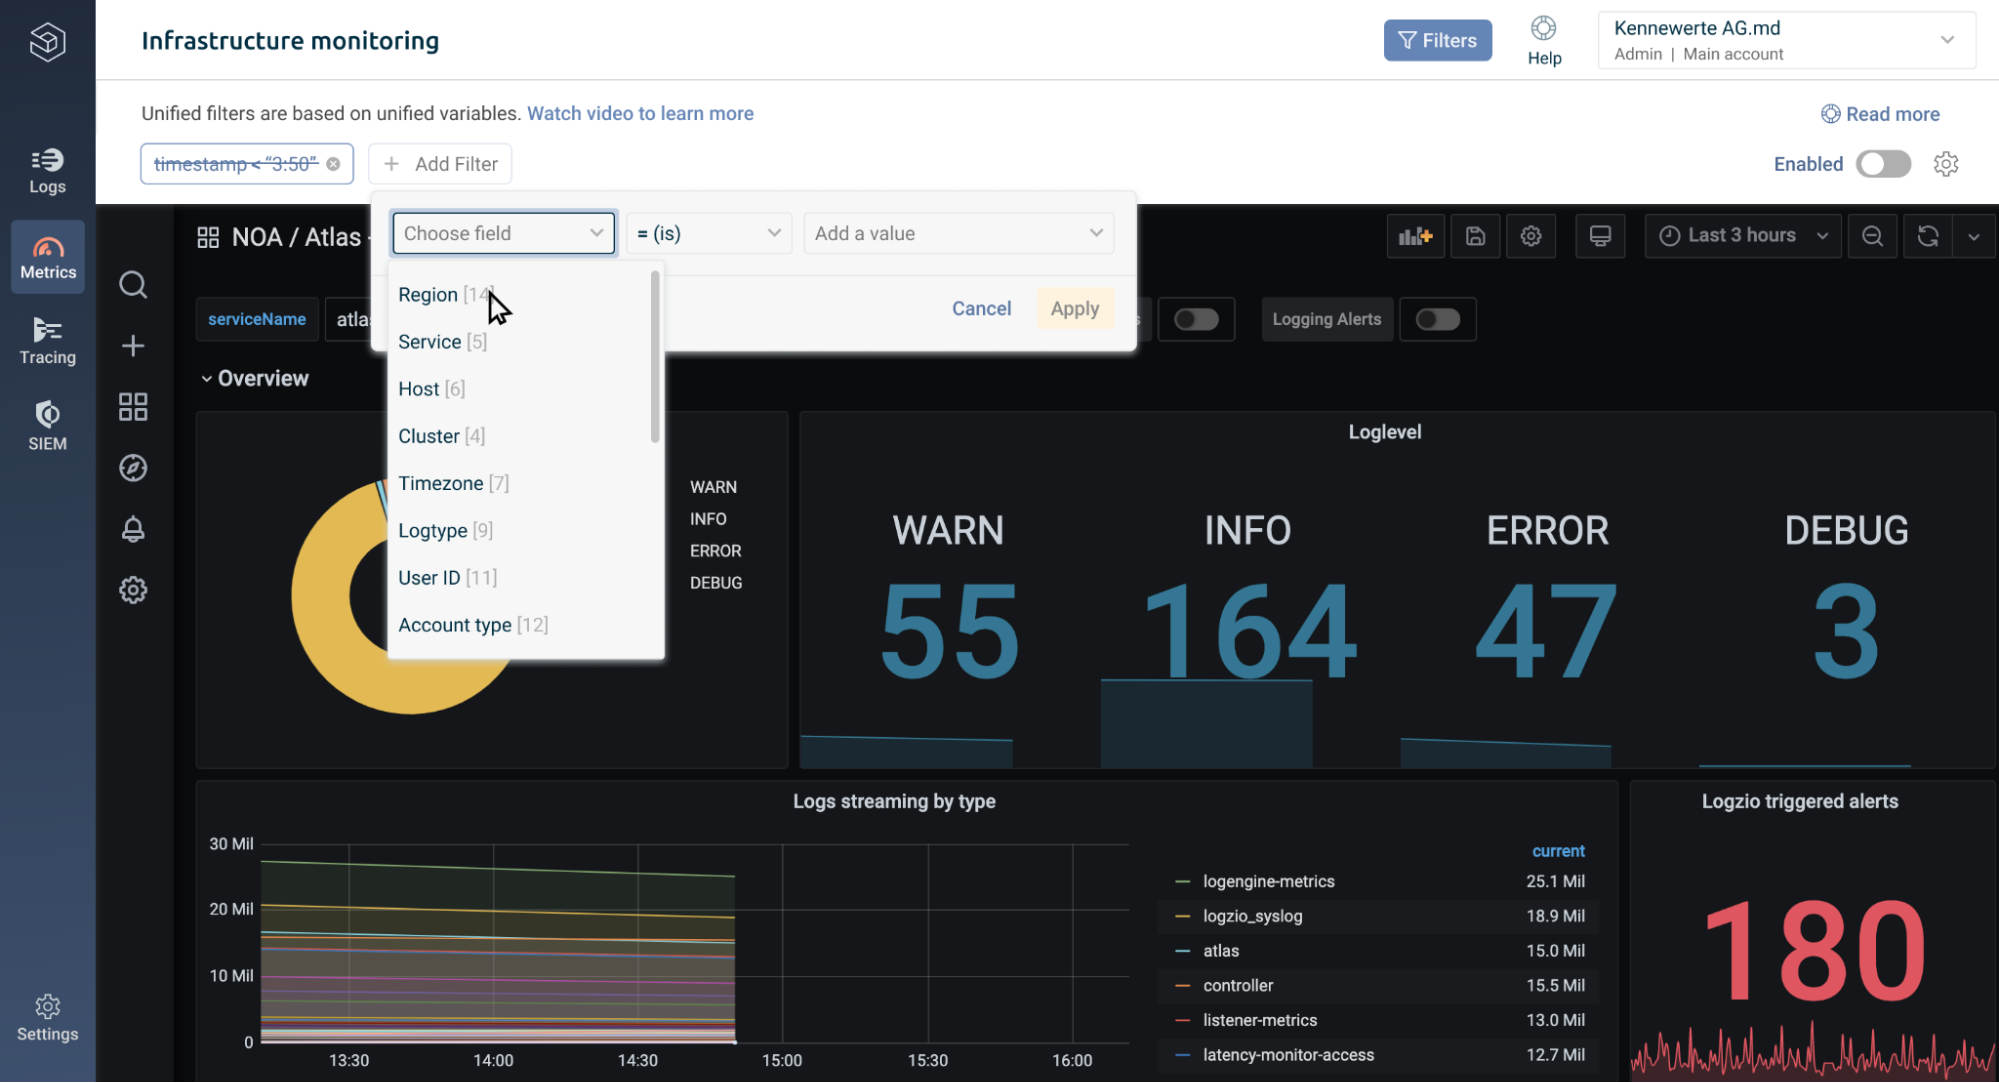
With Logz.io Unified Dashboards, you can start with a broad overview of your environment, then add Unified Filters to narrow down the logs, metrics, and traces – all together in a single view.
To filter the data, users choose from a drop down menu of Unified Variables, which represent common variables Logz.io automatically identified across logs, metrics, and/or traces – such as cluster, pod, or host.
For example, Unified Variables would identify that logs, metrics, and traces in an account contain cloud regions data – and automatically create a variable called ‘Region.’ Logz.io would then identify the values for that variable, which in this case could include AWS us-east-1, AWS us-west-2, or Azure Central US.
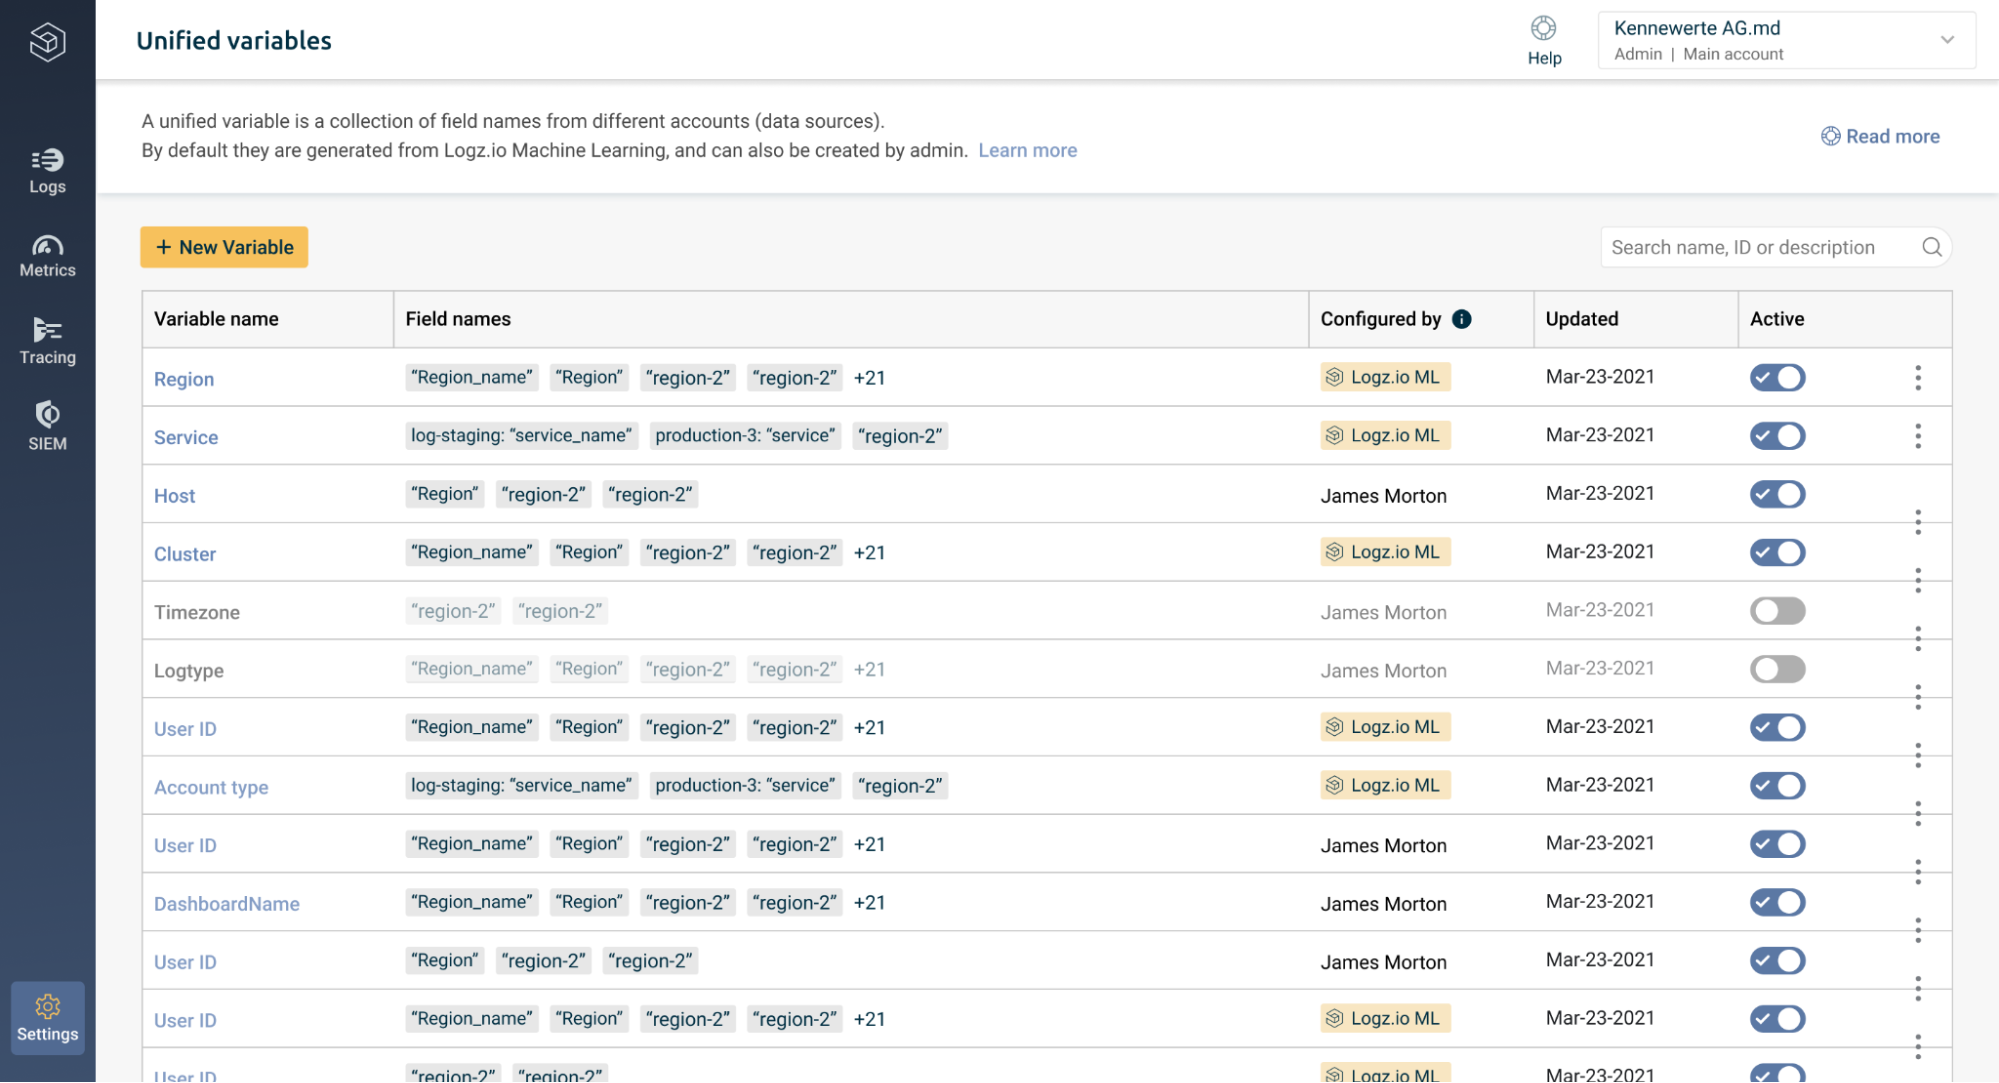
Users can navigate to the Unified Variables page to see all the variables Logz.io has generated. Here, they can deactivate or reactivate specific variables, edit existing variables, or manually create new ones to gain added insights.
A Big Next Step in Logz.io’s Observability Platform Journey
Navigating between siloed and disconnected monitoring tools to investigate telemetry data can slow down engineers during the time they need to be fastest: production incidents.
For this reason, Logz.io unified log, metric, and trace analytics into a platform over the last few years. With full stack observability, customers can quickly understand exactly what is happening across their environment, and rapidly investigate problems as they arise. Using Logz.io’s data correlation capabilities, users can correlate the relevant data to dive into the root cause of problems faster.
Logz.io’s Unified Dashboards take correlation to the next level. Now, users can simply add filters to dashboards monitoring logs, metrics, and traces to gather the information they need from their different telemetry data – all in one place.
Look out in the coming weeks to try it for yourself!
You Might Also Like

Cloud-Centric PCI Compliance Demands Cloud-Native Controls

Monitoring and incident management: a winning combination
Get started for free
Completely free for 14 days, no strings attached.
