Announcing Logz.io’s Data Optimization Hub
December 7, 2022
To help our customers reduce their overall observability costs, we’re excited to announce the Data Optimization Hub as part of our Open 360™ platform. The new hub inventories all of your incoming telemetry data, while providing simple filters to remove any data you don’t need.
Gone are the days of paying for observability data you never use.
Why We Built Data Optimization Hub, and What it Does
Observability has a cost problem. For many engineering teams we speak with, observability is their second-largest expense behind cloud computing costs. Frighteningly, there are no signs of observability costs slowing down. As cloud footprints grow, observability data volumes will always follow. Larger workloads means more observability data, which means higher costs.
Most are told that these costs are inevitable. Observability isn’t optional—the alternative means being blind to production incidents that directly impact the user experience and bottom line—so you need to send all your observability data for storage and analysis.
We’re here to tell you that just isn’t true. Working with customers and really combing through their data, we’ve found about a third of observability data is junk that provides no insight.
This problem isn’t new. We took steps to address it a few years ago for log data through our Log Patterns and Drop Filters capabilities. Log Patterns provided the inventory of all your log data so you could quickly see which logs made up the bulk of your total volume, while Drop Filters provided an easy way to remove the unneeded data.
For many of our customers, this dramatically optimized data volumes, and therefore the cost, of observability.
This was a good solution for logging, but we asked ourselves and customers how we could take data optimization and cost reduction to the next level. We wanted to answer questions such as: “What about metric and trace data optimization? How can we make data optimization even easier? Can we proactively identify data that isn’t being used?”
These questions drove us to the Data Optimization Manager.
For the first time, you can inventory all of your incoming logs, metrics, and traces, and filter out the low priority data in a few clicks—and it’s all in one unified UI. It’s now easier than ever to proactively reduce your data volumes and costs.
In addition to filtering out unneeded data, you can also manipulate it to reduce costs. This includes converting logs to LogMetrics, which provides low cost log data visualization without indexing the data. As data volume spikes and dips, the cost remains the same. Users can also roll up metric data to reduce costs for long-term storage.
Data Optimization Hub is not the only way to remove or manipulate unneeded data. Using Datadog, Splunk, Elastic, and other observability vendors, you can manually search around your data and add filters at the agent level to filter out the unneeded data. But this isn’t easy, fast, or intuitive.
Data Optimization Hub is all of those things, which is why our customers will actually use it to reduce their costs. The average Logz.io customer reduces their data volumes by a third after filtering out unneeded data with Data Optimization Hub!
How Data Optimization Hub works, and how to use it
As we covered in the previous section, Data Optimization Hub provides a single place to identify, remove, or manipulate unneeded observability data to easily reduce costs.
Simply navigate to the ‘Data Hub’ tab on the left toolbar and hit ‘Optimization Hub.’ You need to be an ‘Admin’ user to access this page.
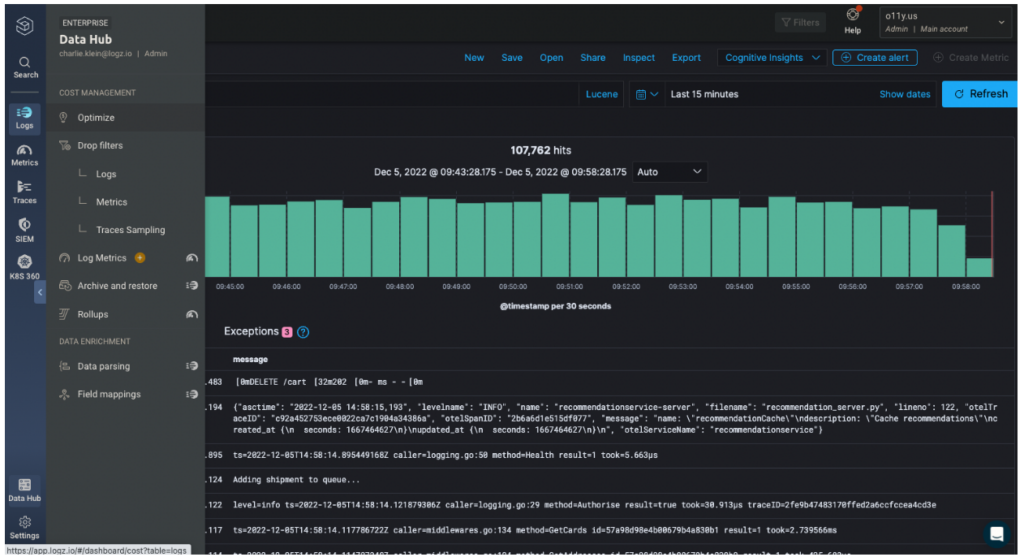
From here, you’ll see a full inventory of incoming observability data. Click across the ‘Logs’ or ‘Metrics’ tabs to see the different data types (we will add a tracing tab later in 2023. For now tracing data can be optimized through sampling configurations – stay tuned to learn more about this feature!).
Log optimization
Starting with the ‘Logs’ tab, scroll through your data to identify what you need, and what you don’t.

Logs are automatically grouped by their structure—making it easy to scan through your log data to see which structures are helpful and which take up the most space in your plan. The second column shows the percentage of total data that the log structure occupies.
For your logs, you will have the option to filter log patterns out by adding a Drop Filter, or convert them to LogMetrics. You can manage your Drop Filters (dynamically switch them on or off to control data flow, or delete them altogether) in the ‘Drop Filters’ page within the ‘Data Hub’ tab.
LogMetrics converts your logs to metrics to provide low cost log data visualization. Even as the log volumes spike and dip, the costs of the metrics . This is great for access logs, HTTP logs, or any other log you need to monitor, but not actually read. Stay tuned for more on this feature!

Metric optimization
Under the metrics tab, each metric you send is documented on the left, along with the labels it contains. The second column shows the total unique time-series for that metric—which is how Logz.io metrics are priced ($0.40/day for 1,000 unique time series)—as well as how much space the metric occupies in comparison to the rest of your data (as a percentage).

In the fourth column, Logz.io tells you whether you’re currently monitoring the metric with a dashboard or an alert—which can help you prioritize what you need, versus what you can filter out to reduce costs.
And in the last column, you’ll see the option to filter metrics out using a Drop Filter, or to roll them up by hitting ‘Rollup.’ Rolling metrics up condenses the data for most cost-efficient long-term storage.
It’s not always obvious which data is a candidate for removal, so Logz.io helpfully includes recommendations for filtering unneeded data based on which data is being monitored in dashboards or alerts.

To get started, start a Logz.io free trial and begin sending telemetry data to your new account. From there, just open up Data Optimization Hub to automatically get a full inventory of your incoming data, along with filters, LogMetrics, and rollups to optimize your data volumes and reduce costs.

You Might Also Like

What’s New at Logz.io – January 2026

