
Installing the ELK Stack on Mac OS X
January 29, 2018
The installation matrix for the ELK Stack (Elasticsearch, Logstash and Kibana) is extremely varied, with Linux, Windows and Docker all being supported. For development purposes, installing the stack on Mac OS X is a more frequent scenario.More on the subject:
Without further adieu, let’s get down to business.
Installing Homebrew
To install the stack on Mac you can download a .zip or tar.gz package. This tutorial, however, uses Homebrew to handle the installation.
Make sure you have it installed. If not, you can use the following command in your terminal:
/usr/bin/ruby -e "$(curl -fsSL https://raw.githubusercontent.com/Homebrew/install/master/install)"
If you already have Homebrew installed, please make sure it’s updated:
brew update
Installing Java
The ELK Stack requires Java 8 to be installed.
To verify what version of Java you have, use:
java -version
To install Java 8 go here.
Installing Elasticsearch
Now that we’ve made sure our system and environment have the required pieces in place, we can begin with installing the stack’s components, starting with Elasticsearch:
brew install elasticsearch && brew info elasticsearch
Start Elasticsearch with Homebrew:
brew services start elasticsearch
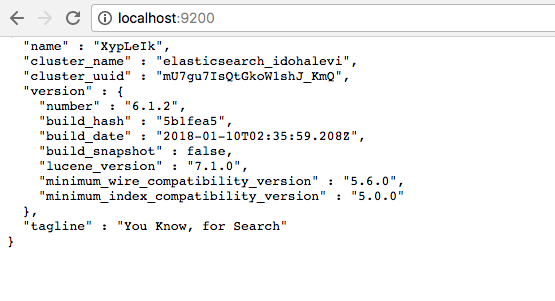
Use your favorite browser to check that it is running correctly on localhost and the default port: http://localhost:9200
The output should look something like this:
Installing Logstash
Your next step is to install Logstash:
brew install logstash
You can run Logstash using the following command:
brew services start logstash
Since we haven’t configured a Logstash pipeline yet, starting Logstash will not result in anything meaningful. We will return to configuring Logstash in another step below.
Installing Kibana
Finally, let’s install the last component of ELK – Kibana.
brew install kibana
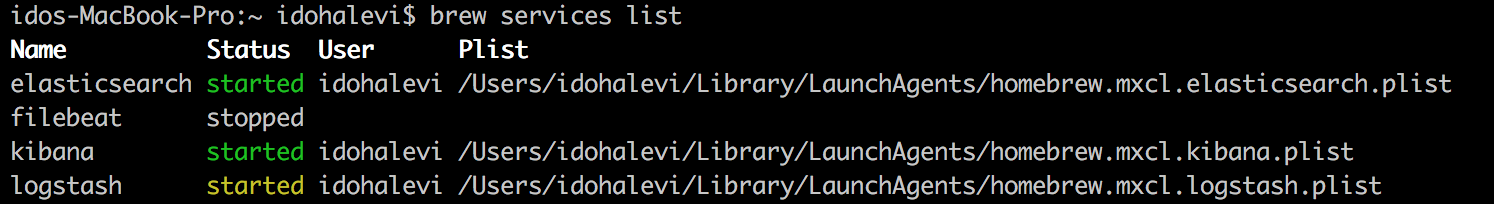
Start Kibana and check that all of ELK services are running.
brew services start kibana
brew services list
Kibana will need some configuration changes to work.
Open the Kibana configuration file: kibana.yml
sudo vi /usr/local/etc/kibana/kibana.yml
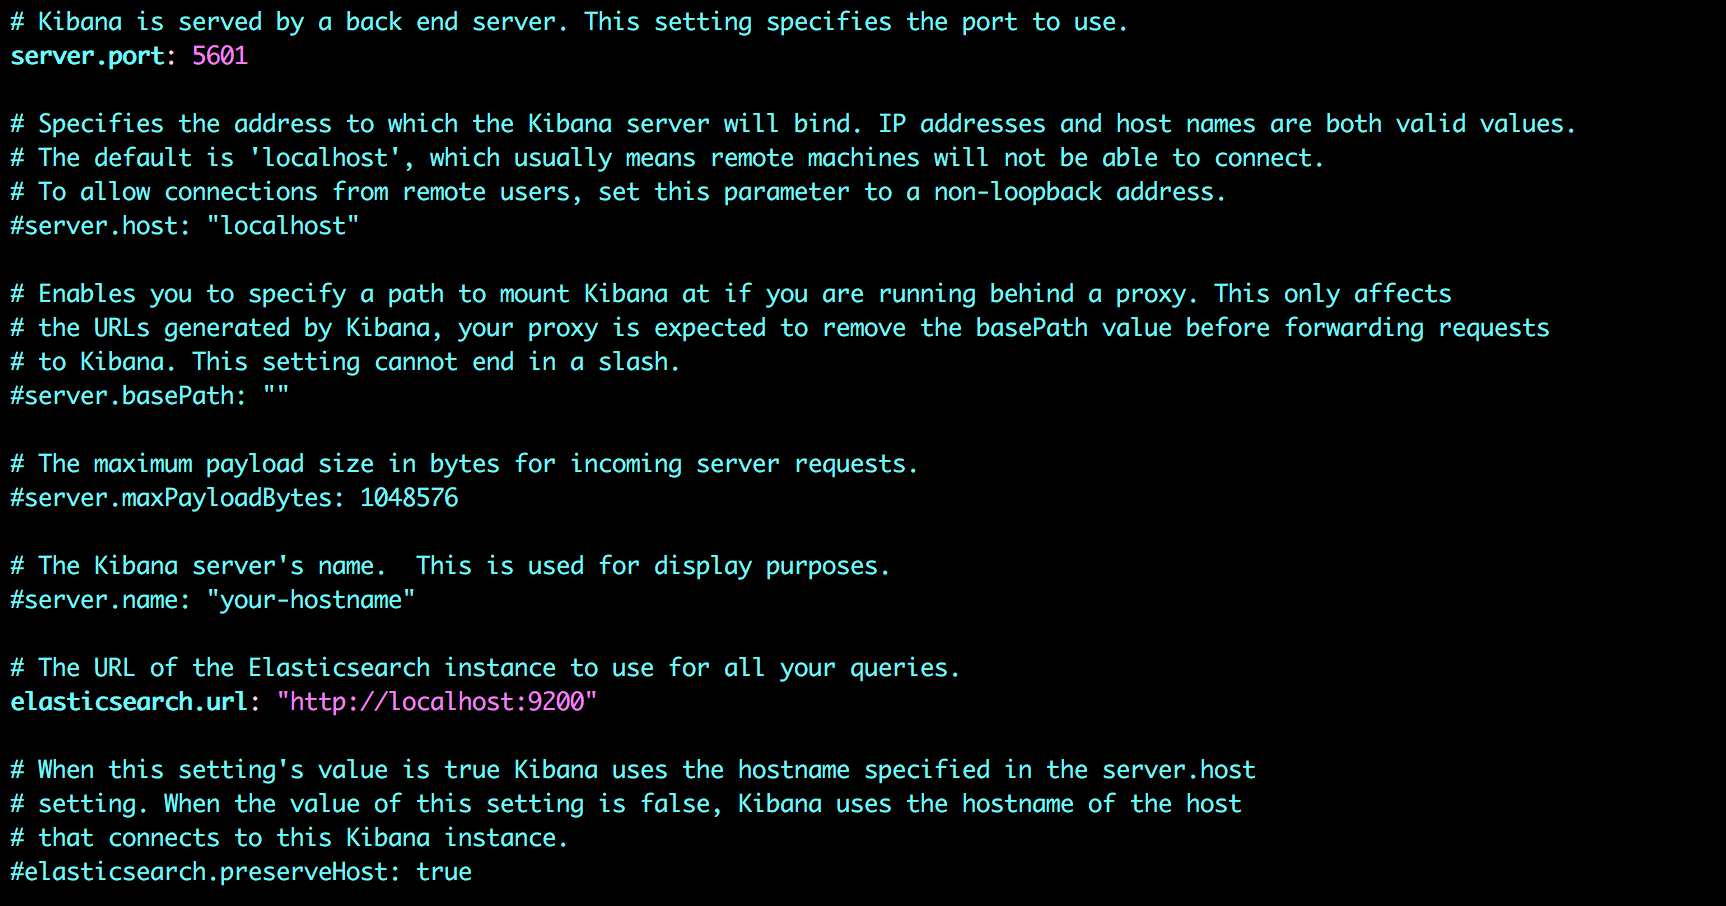
Uncomment the directives for defining the Kibana port and Elasticsearch instance:
server.port: 5601
elasticsearch.url: "http://localhost:9200”
If everything went well, open Kibana at http://localhost:5601/status. You should see something like this:

Congratulations, you’ve successfully installed ELK on your Mac!
Since this is a vanilla installation, you have no Elasticsearch indices to analyze in Kibana. We will take care of that in the next step.
Shipping some data
You are ready to start sending data into Elasticsearch and enjoy all the goodness that the stack offers. To help you get started, here is an example of a Logstash pipeline sending syslog logs into the stack.
First, you will need to create a new Logstash configuration file:
sudo vim /etc/logstash/conf.d/syslog.conf
Enter the following configuration:
input {
  file {
    path => [ "/var/log/*.log", "/var/log/messages", "/var/log/syslog" ]
    type => "syslog"
  }
}

filter {
  if [type] == "syslog" {
    grok {
      match => { "message" => "%{SYSLOGTIMESTAMP:syslog_timestamp} %{SYSLOGHOST:syslog_hostname} %{DATA:syslog_program}(?:\[%{POSINT:syslog_pid}\])?: %{GREEDYDATA:syslog_message}" }
      add_field => [ "received_at", "%{@timestamp}" ]
      add_field => [ "received_from", "%{host}" ]
    }
    syslog_pri { }
    date {
      match => [ "syslog_timestamp", "MMM  d HH:mm:ss", "MMM dd HH:mm:ss" ]
    }
  }
}

output {
  elasticsearch {
    hosts => ["127.0.0.1:9200"]
    index => "syslog-demo"
  }
  stdout { codec => rubydebug }
}
Then, restart the Logstash service:
brew services restart logstash
In the Management tab in Kibana, you should see a newly created “syslog-demo” index created by the new Logstash pipeline.

Enter it as an index pattern, and in the next step select the @timestamp field as your Time Filter field name.

And…you’re all set! Open the Discover page and you’ll see syslog data in Kibana.


You Might Also Like

What’s New at Logz.io – January 2026

