Enrich Kubernetes with New Deployment Tracking Capability
November 9, 2023
When things go wrong, we’d all love the ability to go back in time, return things to the way they were, and fix whatever issues pop up at the start so they never happen in the first place.
This is no different when maintaining complex microservices-based architectures. With any complex system, things are bound to go wrong from time to time.
When it’s your responsibility to investigate an issue with a service, the first thing you’ll likely do is check to see if there are any new deployments that may be causing the problem.
While we can’t exactly offer you a time machine, we can help you pinpoint the specific changes to production that created new production issues. For Logz.io Open 360™ customers using Kubernetes 360 and Service Overview, we’re making it much easier to investigate issues with a new deployment tracking feature.
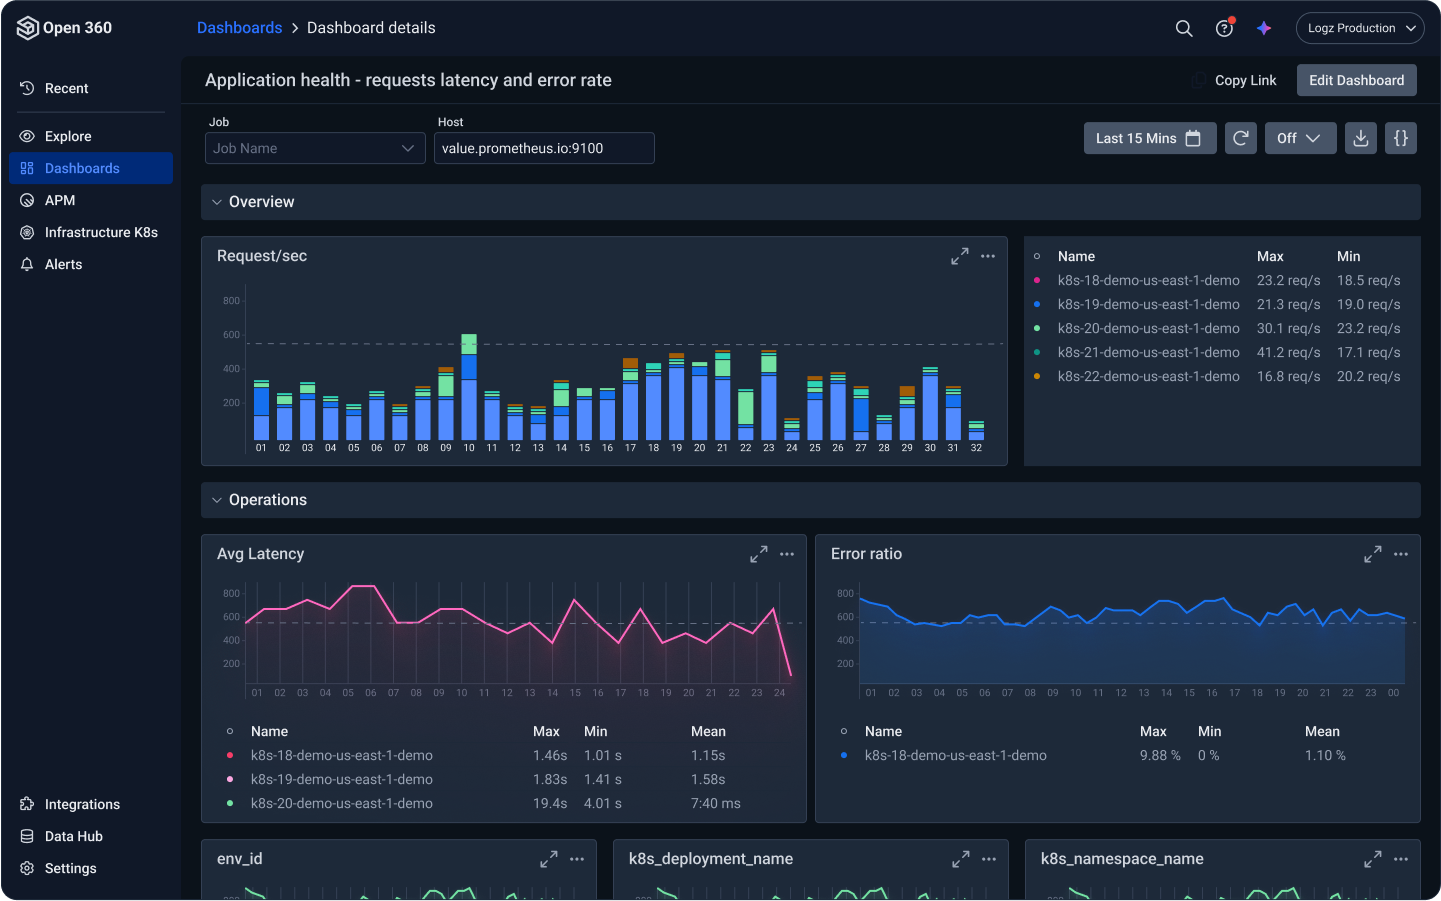
This new capability allows users to view and track their services’ deployments, which are overlaid on telemetry data visualizations – making it easy to see the impact of deployments on production health and performance. Users gain visibility into when services were deployed, which versions are running, and the impact they have on the system to better troubleshoot production incidents.
You’ll be able to automatically detect any changes such as edit spec, edit config and upgrading images in Kubernetes to provide a better understanding on what can cause an issue a user is investigating.
You can enrich your Service Overview graphs by adding an indication of recent deployments, helping you determine if a deployment has increased response times for end-users, altered your application’s memory/CPU footprint, or introduced any other performance-related changes.
DevOps/developers can integrate deployment data to Open 360 easily and quickly so they can view it in the system. All your deployments are matched on the dashboard so it can be correlated with any alerts you’re seeing.
How to Activate Deployment Tracking
Deployment events with this new functionality will be shown in Kubernetes 360 (metrics tab) and Service Overview within the Open 360 platform.
To enable deployment tracking ability, you have a couple of options. First, you can run the Telemetry Collector on your Kubernetes clusters.
You can also do this manually by installing the Logz.io Kubernetes events Helm chart. Once enabled, the graphs will include a deployment marker, marked by a dotted vertical line.
You can view additional deployment data by clicking on the line. This data includes the deployment time, the associated service and environment, and a quick link to view the commit in your logs.
Click View Commit to access and view your own code related to this deployment, allowing you to probe deeper into the relevant data.

With this automatic detection of changes in your Kubernetes environment, we can show you the change and correlate it with the change of the behavior of your application, or your infrastructure.
If you’d like to learn more about this feature and how Logz.io can help you meet your observability goals, sign up for a free trial of Logz.io’s Open 360 platform for essential observability today.


