
Full Stack Observability Guide – Examples and Technologies
July 27, 2025
Key Takeaways
1. Full stack observability helps triage and resolve incidents cohesively across the entire tech stack.
2. The first step is visualizing and analyzing telemetry data.
3. Logz.io can surface performance and behavior issues across the application and infrastructure layer.
What is Full Stack Observability?
Full Stack Observability is the practice of monitoring and understanding the health, performance and behavior of the entire technology stack. This starts at the frontend user interface, goes through application services, and ends at backend infrastructure and networks. It goes beyond traditional and siloed monitoring by correlating telemetry data (logs, metrics, traces) across every layer, providing a cohesive and unified view. This helps DevOps and engineering teams conduct RCA and triage incidents faster, to reduce MTTR, even across complex systems.
As modern software systems become increasingly distributed, interconnected, and complex, ensuring production reliability and performance is becoming harder and more stressful. This has made enabling full stack observability of paramount importance.
Seemingly nondescript changes to our infrastructure or application can have massive impacts on system uptime, health, and performance, all while the cost of production incidents continues to grow.
While we need telemetry data – including logs, metrics, and traces – to quickly surface production issues and diagnose system behavior, simply collecting the data is not enough to realize observability.
In this guide, we’ll show an example of full stack observability for an application running on Kubernetes and AWS. In doing so, we’ll examine methodologies, best practices, pitfalls, and common technologies to unify telemetry data from across your stack in a single location.
Common Obstacles and Pitfalls in Achieving Full Stack Observability
The road to full stack observability can be challenging for organizations without the right tooling and priorities in place.
Once properly instrumented, applications and infrastructure emit reams upon reams of telemetry data. For the most part, the vast majority of that telemetry is not particularly useful to organizations. Getting to full stack observability can be particularly challenging when your tools and systems aren’t configured to filter out the noisy data.
As my colleague Dotan Horovits notes, observability is a data analytics problem. And one of the most pervasive observability data analytics challenges is that the data is usually siloed across teams and services according to varying budgets and preferences.
This strategy increases troubleshooting complexity because interconnected systems require interconnected observability. When changes to production have ripple effects across the entire stack, siloed visibility requires engineers to zoom in to individual components at a time, rather than investigating the issue within the context of the larger system.
Alternatively, with full stack observability, we have a single place to visualize, investigate, and correlate information about our services. This enables us to quickly answer business-critical questions like, “What is causing this sudden latency in our front-end? Why can’t users login to our service? Why did check outs sharply decline?”
Understanding the Components and Methods of Full Stack Observability
Let’s review the core methodologies to realize full stack observability using the Logz.io observability platform.
In this example, we’ll collect and analyze all our telemetry data – from the infrastructure to the application layers – in a single place so we can analyze and correlate information without switching tools or context.
In our demo application, we’ll use technologies like AWS, Java, Kubernetes, Kafka, Redis, Go, OpenTelemetry, and other popular dev components. See the full architecture of our demo application below.

The first step to full stack observability: data collection
Full stack observability starts configuring your environment to generate telemetry data – so this is where we’ll begin. Afterwards, we’ll visualize and analyze the data to begin extracting insights about the health and performance of our system.
There are many technologies to collect telemetry data, such as Prometheus, Fluentd, OpenTelemetry, and the Datadog agent. As you can probably guess, the Datadog agent only works for the Datadog platform, so we’ll focus on vendor-agnostic technologies to enable easier migration across observability back-ends.
Specifically, we’re going to use OpenTelemetry, as well as Logz.io features that simplify OpenTelemetry instrumentation, configuration, and deployment.
First, we’re going to configure a Logz.io Telemetry Collector, which is an agent based on OpenTelemetry. After logging into Logz.io and navigating to the ‘Send your data’ section, simply click on the technology you want to monitor – in this case we’ll collect EKS.

Next, we’ll determine where we’re running the script, which is Helm in this case.

Now we can simply copy the script and deploy it on our EKS clusters, which will collect logs and metrics from our infrastructure and continuously send them to Logz.io in real time.

At this point, we have infrastructure logs and metrics, as well as application logs and traces in Logz.io. Now we can begin visualizing, analyzing, and investigating the data to gain insights about the current state of our environment.
By opening up the Homepage, we can see a summary of alerts, new log exceptions, and the volumes of data across logs, metrics, and traces.

Application observability data analytics
Now that we’re collecting telemetry data, we can use it to surface production issues, diagnose our services’ behavior, and understand how changes impact the overall health and performance of our application.
Now, we need effective ways to analyze the telemetry data to surface those insights. Let’s go through some examples.
We’ll start with Logz.io’s Service Overview, which provides an out-of-the-box view of the health and performance of our microservices – no configuration is necessary to see this dashboard. All of this data is updated in real time from the data collection components we set up in the previous section.

From here, we can immediately analyze three of the four golden signals for service performance: including request rate (traffic), latency, and errors. We’ll see the fourth signal, saturation, in just a moment.
Keep these metrics in mind when you’re building out your own observability dashboards; they are industry-accepted signals for understanding the current state of your system health and performance.
From that dashboard above, we can see that the front end service may be experiencing some issues – let’s click to investigate.

This dashboard provides a deeper look into the current health and performance of our front-end service. We can see all of the four golden signals in this view – including the resource saturation (memory and CPU) – on the bottom right. This dashboard is automatically generated for every service in our environment.
While high level service metrics are helpful for spotting issues in our application, we also need to diagnose the issue by quickly diving into investigations into the root cause.
To do this, we can correlate different data types from the same service during the same time. This allows us to quickly begin root cause analysis (using logs and traces) from a high level view of service performance (using metrics).
In the bottom left of the dashboard, we can see the request rate, latency, and error metrics for every operation executed by this service, which are generated by correlated trace data from the same service, at the same time. This allows us to quickly zoom into the individual transactions that could be causing our service performance issues.
If we want to search the logs from the front end service to further investigate the root cause, we can see the correlated log data by scrolling down.
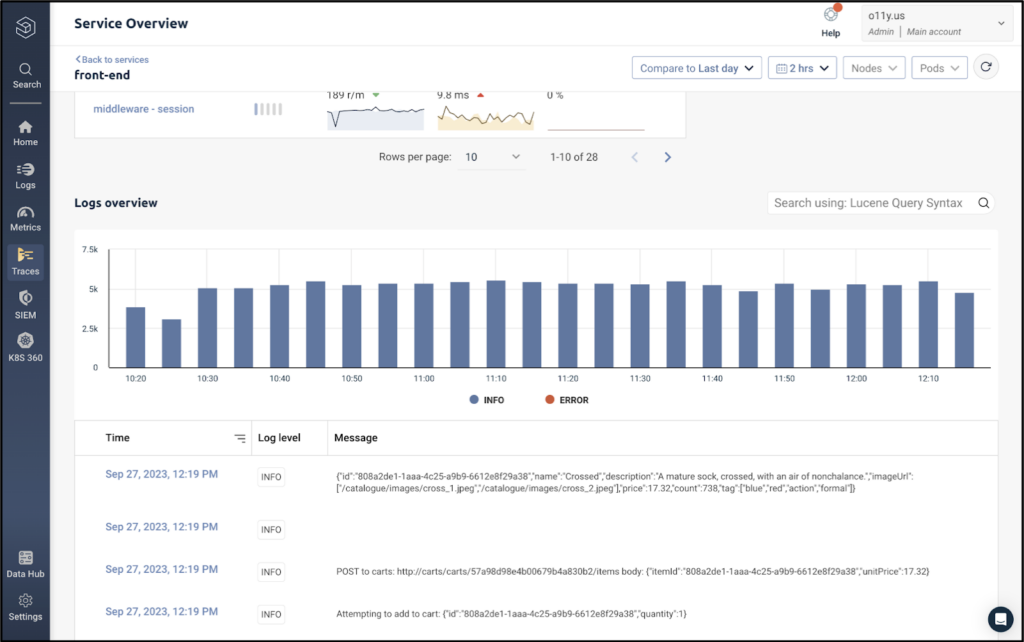
Here, we can query and search our logs to debug the issue immediately. We know all of the logs will be relevant, because they’re being generated from the same service, at the same time as the metrics above.
Similarly to searching across individual logs generated by the front-end service, we can also investigate the relevant traces by scrolling back up and clicking on the HTTP GET operation executed by the front-end service.

This will bring us to a specific transaction executed by our system. Logz.io Distributed Tracing captures the latency of each operation within the application request as it pings different microservices. This view makes it exceptionally easy to pinpoint the location and source of latency in our application.
By opening up one of the spans, we can see an exception message tied to the trace, which explains the source of our performance issue.

That’s a brief overview of application analytics. But we’re talking about full stack observability, so let’s move on to our infrastructure analytics.
Infrastructure observability analytics
In the last section, we focused mostly on the application layer, but maintained some insight into the infrastructure. In this section, we’ll do the opposite. As engineers begin to focus on the infrastructure and application layer (as opposed to one or the other), this centralized view of the full stack is critical.
Just like we opened up Service Overview to get immediate insights into our application performance without any configuration, we’ll do the same thing for our infrastructure by opening up Kubernetes 360.
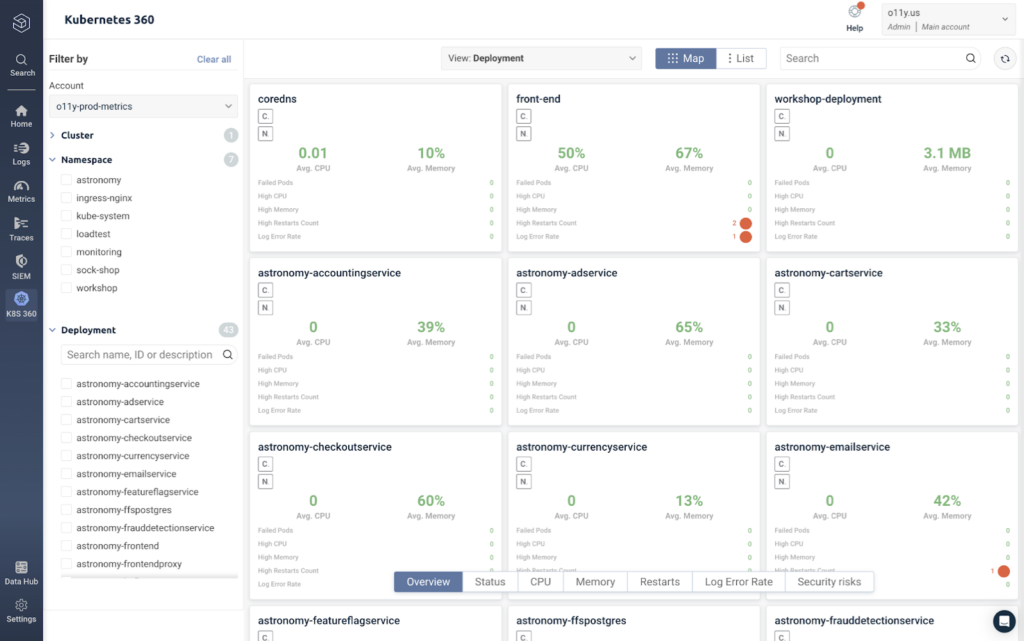
This view shows us a performance overview of each deployment in our Kubernetes environment, including uptime, CPU, memory, restarts, and error rates. We can filter by these specific metrics by clicking across the bar at the bottom.

We can continue to slice and dice the data in many ways to explore our infrastructure health and performance. This view shows our pods per deployment, but we can monitor our infrastructure by node, statefulset, daemonset, job, or pod – see the pod view below.

Similarly, we can explore this data by filtering per cluster, namespace, deployment, statefulset, daemonset, job, node, or pod.
Dicing up high-level performance metrics across services is a great way to explore the current state of our system. After we find something interesting, we’ll want to quickly investigate it without switching tools or context – this requires data correlation.
By clicking on a pod, we can see the pod’s performance metrics over time, as well as the option to view the correlated logs and traces to investigate the pod performance.

If we want to continue exploring, we can pivot to the logs tab – where we can query and explore the log data from the same service at the same time.

We can do the same for our traces by jumping to the trace tab. Here, we can see our spans, which each represent a specific operation executed by the front-end service. We can sort them by duration, operation, or status code to bring the most interesting data to the top.

To view the operations within the context of the complete application request, we can click on the span, which brings us to the full stack trace within Logz.io.

From this view, we can easily pinpoint the source of latency to debug our microservices.
Essential Tools and Methods for Achieving Full Stack Observability
Throughout these two examples of application and infrastructure-focused data analytics, we stayed within the same platform.
Without infrastructure metrics, it’s hard to understand how software bugs impact our system. Without application data, we can’t investigate the root cause of production issues. When it’s all in one place, we can troubleshoot issues within the context of our entire system performance, rather than zooming in on one component at a time.
We only covered a few important elements of full stack observability. Below is a summary of these elements, in addition to links for further reading on topics we didn’t cover.
- Telemetry data collection: Open source is the way! Instrumenting your system to generate telemetry data with open source technologies ensures flexibility if you ever want to switch observability back-ends. Ripping and replacing telemetry instrumentation can be an enormous time suck.
- Dashboard creation: While we didn’t spend much time on building dashboards in this blog, we spent plenty of time analyzing them. Logz.io’s auto-generated dashboards for Kubernetes infrastructure and application services are a fast and easy way to begin monitoring critical metrics and correlating information. You can also build your own dashboards within Logz.io or other tools like Grafana or OpenSearch Dashboards.
- Unified data: Switching across tools to analyze different types of telemetry data (such as infrastructure vs application data, or metric data vs logs data) requires context switching whenever investigating production issues – which can ultimately delay MTTR. Additionally, tool sprawl can be easily avoided when the data is altogether.
- Data correlation: Similarly to the point above, data correlation is key to troubleshooting with context. Correlated data enables us to easily connect the dots between different services and infrastructure components so we can quickly diagnose system behavior.
- Monitoring and alerting: This is a critical element of observability that we didn’t cover. Setting the right alerts for cloud monitoring is an art – if you’re looking to learn more about implementing alerts, I’d recommend getting started here.
- Service level objectives: Ensuring reliability and uptime is a critical observability use case, and many system reliability practices are based on SLOs. Get started here to learn about SLO implementation.
- Cost control: While we didn’t have time to cover cost control, it is one of the defining challenges of observability initiatives. Learn how data optimization can keep your costs under control without sacrificing visibility into your system.
Discover how full stack observability can help you meet your goals by signing up for a free trial of the Logz.io Open 360™ platform today.
FAQs
What are the key aspects of full-stack observability?
End-to-end visibility across the entire application stack, from frontend interfaces and APIs to backend services, infrastructure, and network layers. It encompasses logs, metrics and traces, correlating telemetry, contextual insights, real-time dashboards, alerting, and AI analysis
How does full-stack observability differ from traditional monitoring?
Traditional monitoring focuses on predefined metrics and thresholds like CPU usage, memory, server uptime. It tells you what is wrong, but not necessarily why or where. Full-stack observability provides deep, contextual insight into why something broke, enabling faster root cause analysis across services and teams.
Why does full-stack observability matter?
Systems are growing more distributed and complex, blind spots are multiplying and it’s taking engineers hours of work to hunt down and investigate issues. Full-stack observability enables tracing performance issues across every layer. This reduces downtime, accelerates MTTR, and helps teams move from firefighting to continuous improvement.
What kind of data does full-stack observability encompass?
Telemetry data from logs, traces and metrics, user monitoring, configurations, and business metrics like conversion rates and churn rates.
What are the benefits for engineering teams adopting full-stack observability?
Faster issue detection and resolution, fewer escalations, less silos between teams, higher system reliability and more time spent on innovation rather than debugging.

You Might Also Like
What is Infrastructure Monitoring? How it Works, Key Metrics & Use Cases

