
Bitcoin and Cryptocurrency Tracking with the ELK Stack
It’s hard to ignore the buzz around Bitcoin and Cryptocurrency in general. Despite reservations by financial organizations and experts around the world, there can be no denying of the growing influence of crypto coins and the underlying Blockchain technology.
One of the reasons many are still hesitant to get involved is the volatility of the market which often experiences extreme fluctuations. It seems that the cryptocurrency market is as unpredictable and unstable as other more traditional markets.
There are plenty of websites and online tools that provide ways to monitor this market, providing information on trends and helping the speculant decide what coin to buy, when to buy it, and probably more importantly — when to sell.More on the subject:
If you’re an ELK user, which I suspect many of you are if you’re reading this blog, and are an active player in this market or thinking of making your first steps in it, below is a simple way to hook up the ELK Stack with data on the Cryptocurrency market courtesy of CoinMarketApp.
The screenshots will be showing the Logz.io ELK Stack, but you can use the exact same workflow and configurations with your own open source stack. I assume you either have a Logz.io account or your own ELK already installed.
Building the data pipeline
The data I used for building my crypto monitoring dashboard is made available by CoinMarketCap Ticker API which collects and displays information on the top 100 cryptocurrencies by market capitalization.
Polling the https://api.coinmarketcap.com/v1/ticker endpoint, responses are JSON formatted, and contain a wealth of information about different crypto coins. To get an idea, here’s an example of a response:
{
        "id": "bitcoin",
        "name": "Bitcoin",
        "symbol": "BTC",
        "rank": "1",
        "price_usd": "573.137",
        "price_btc": "1.0",
        "24h_volume_usd": "72855700.0",
        "market_cap_usd": "9080883500.0",
        "available_supply": "15844176.0",
        "total_supply": "15844176.0",
        "percent_change_1h": "0.04",
        "percent_change_24h": "-0.3",
        "percent_change_7d": "-0.57",
        "last_updated": "1472762067"
    }
To poll for events from this endpoint and ship them into ELK, I used the Logstash http_poller input plugin, which can aggregate, decode and ship data from a defined endpoint URL.
Let’s take a closer look at the Logstash configuration file segment by segment.
Logstash input
The input section defines the http_poller input plugin — the URL endpoint to poll, a request timeout, a CRON-based schedule (once an hour, everyday) and the codec to use (JSON). The metadata_target setting is optional, and adds some fields to the responses on the performance of the poller.
input {
  http_poller {
    urls => {
      url => "https://api.coinmarketcap.com/v1/ticker"
    }
    request_timeout => 60
    schedule => { cron => "0 * * * *"}
    codec => "json"
    metadata_target => "http_poller_metadata"
  }
}
Logstash filter
Since the API responses are in JSON, there is little processing or parsing that is required from Logstash. Still, as seen above, the filter section does use the mutate filter plugin to parse specific fields as integers — crucial for the metric aggregations. We are also parsing the last_updated field using the date filter plugin and the UNIX processor.
filter {
  mutate {
    convert => { "total_supply" => "integer" }
    convert => { "rank" => "integer" }
    convert => { "price_usd" => "integer" }
    convert => { "market_cap_usd" => "integer" }
    convert => { "price_btc" => "integer" }
    convert => { "percent_change_24h" => "integer" }
    convert => { "max_supply" => "integer" }
    convert => { "percent_change_7d" => "integer" }
    convert => { "available_supply" => "integer" }
    convert => { "percent_change_1h" => "integer" }
    convert => { "24h_volume_usd" => "integer" }
   }
  date {
    match => ["last_updated","UNIX"]
    target => "last_updated"
  }
}
Logstash output
I think this last section is pretty self-explanatory, right?
output {
  elasticsearch {
    hosts => ["localhost:9200"]
  }
}
Combine all three sections into your Logstash configuration file and start Logstash — Logstash will begin polling and an index will be created in Elasticsearch once the first poll is performed. You can then use the full power of Elasticsearch queries to search the data.
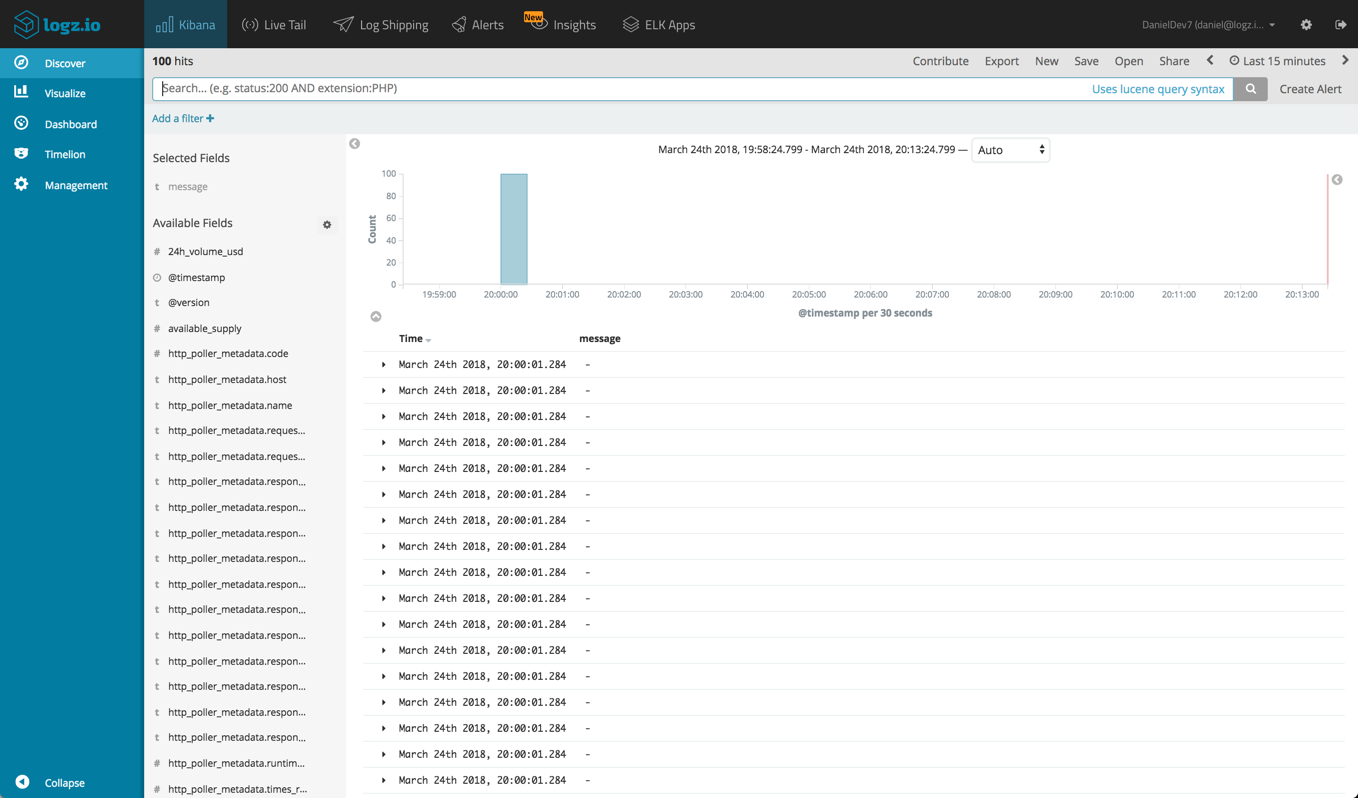
For analysis in Kibana, first define a new logstash-* index pattern and you will start seeing response data in the Discover page in Kibana.

Shipping into Logz.io
For Logz.io users, there are just a few small tweaks to be made to the Logstash configuration file — an additional mutate filter that adds your Logz.io user token (retrieved from the Settings page in the UI) and a different tcp output filter to send the data to Logz.io’s listeners.
The final configuration file looks like this:
input {
  http_poller {
    urls => {
      url => "https://api.coinmarketcap.com/v1/ticker"
    }
    request_timeout => 60
    schedule => { cron => "0 * * * *"}
    codec => "json"
    metadata_target => "http_poller_metadata"
  }
}

filter {
  mutate {
    convert => { "total_supply" => "integer" }
    convert => { "rank" => "integer" }
    convert => { "price_usd" => "integer" }
    convert => { "market_cap_usd" => "integer" }
    convert => { "price_btc" => "integer" }
    convert => { "percent_change_24h" => "integer" }
    convert => { "max_supply" => "integer" }
    convert => { "percent_change_7d" => "integer" }
    convert => { "available_supply" => "integer" }
    convert => { "percent_change_1h" => "integer" }
    convert => { "24h_volume_usd" => "integer" }
    add_field => { "token" => "<yourUserToken>" }
  }
  date {
    match => ["last_updated","UNIX"]
    target => "last_updated"
  }
}

output {
  tcp {
    host => "listener.logz.io"
    port => 5050
    codec => json_lines
  }
}
Starting Logstash, your data will begin to show up in Logz.io.
Analyzing and visualizing the data
One benefit of using Kibana as opposed to one of the basic online tools is the different options available for analyzing and visualizing the data.
Here’s a sample of what can be done:

But let’s not jump the gun. There are a few steps that we need to take until we get to that monitoring dashboard.
Formatting fields
First, we want to make sure values for monetary fields display the $ symbol. In Kibana, we will open the Management → Index Patterns page, and search for one of these fields, say the market_cap_usd field:
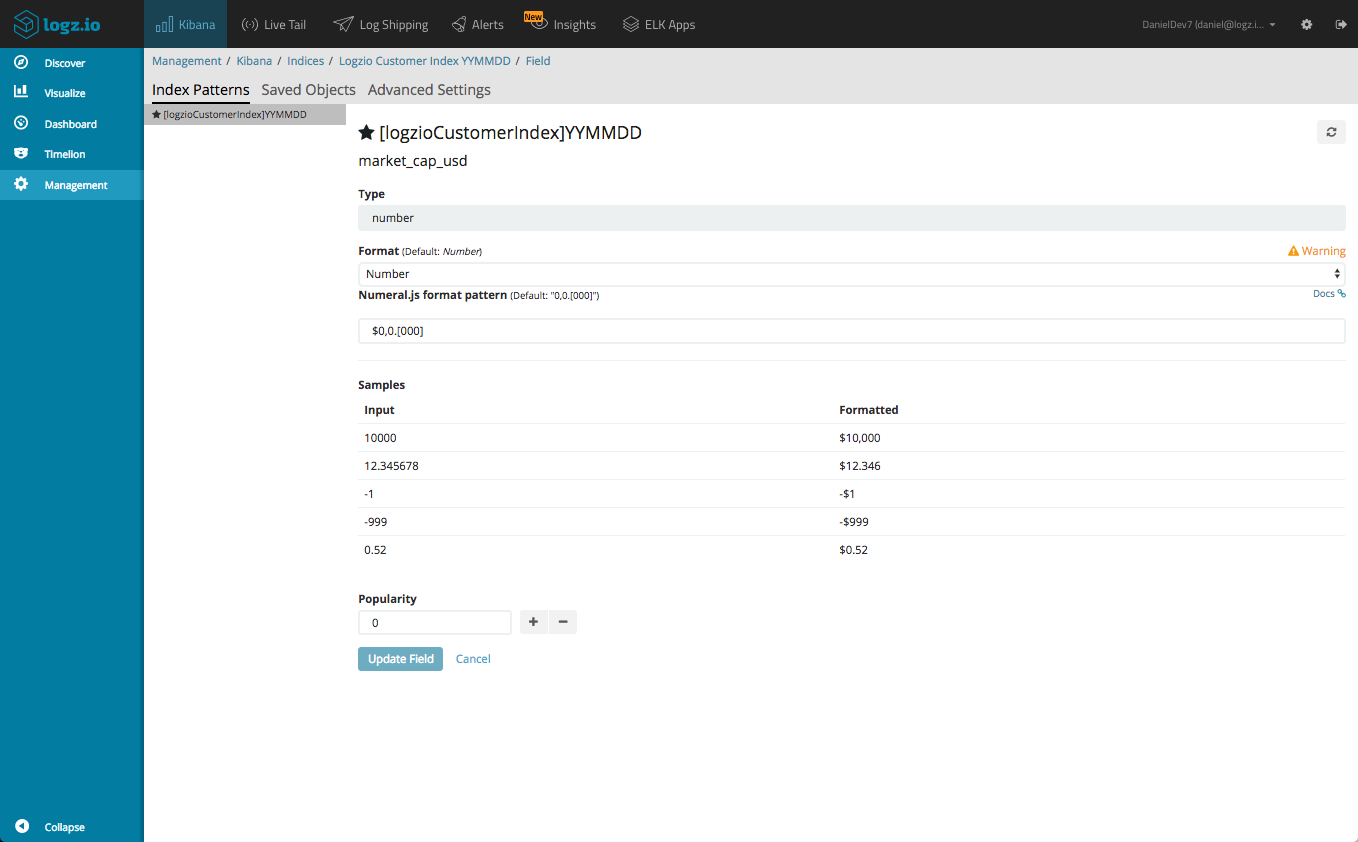
We will then select the number format and simply add the $ symbol before the pattern. Hitting the Update field button will update the field accordingly. Repeat the process for the other relevant fields (price_usd, 24h_volume_usd).
Building visualizations
Now that we’ve made sure our fields are formatted correctly, it’s time to have some fun and play around with some visualizations.
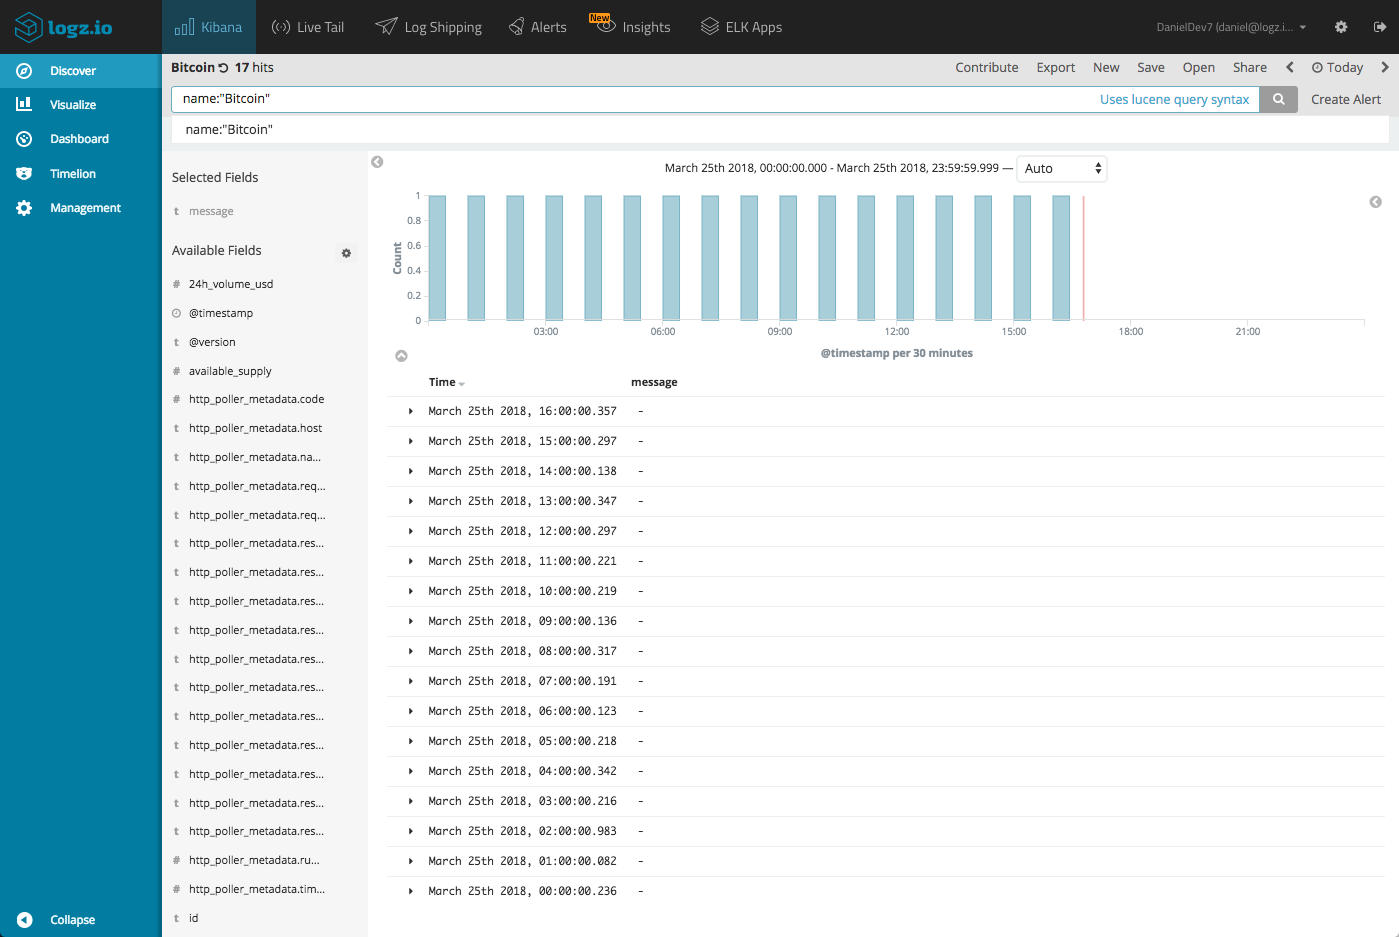
Bitcoin monitoring
To start out, let’s build some visualizations displaying information on the king of them all — Bitcoin. To do this, we will first enter, and save, a search on the Discover page to focus only on Bitcoin related data:
name:”Bitcoin”
We should be seeing a line for Bitcoin data, one per hour for each poll performed.
When creating the new metric visualization, be sure to select the saved search.
We’ll start with displaying the price of the currency:

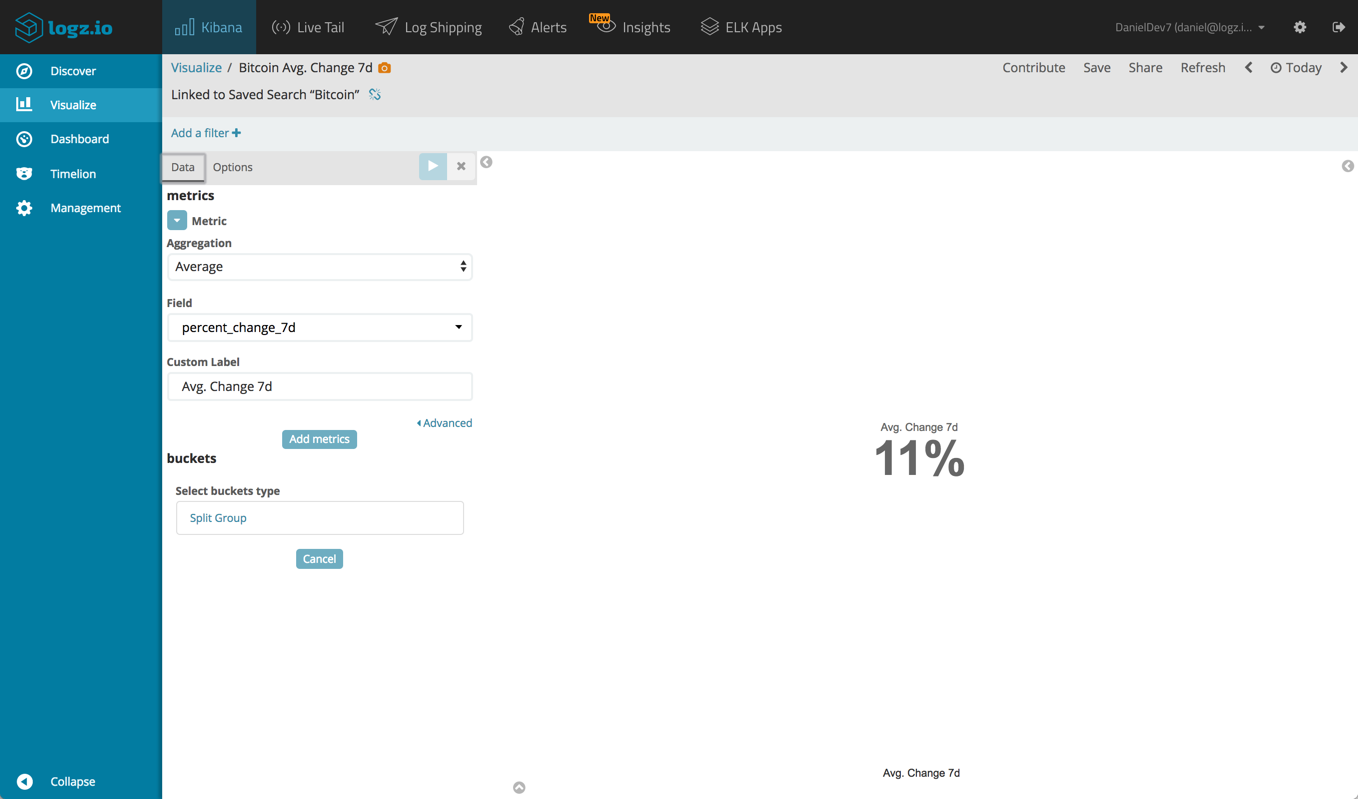
We can also create some metric visualizations that display the avg. change in the price of Bitcoin for different time periods (to display in percentage mode, open the Options panel and select the Percentage Mode check-box).
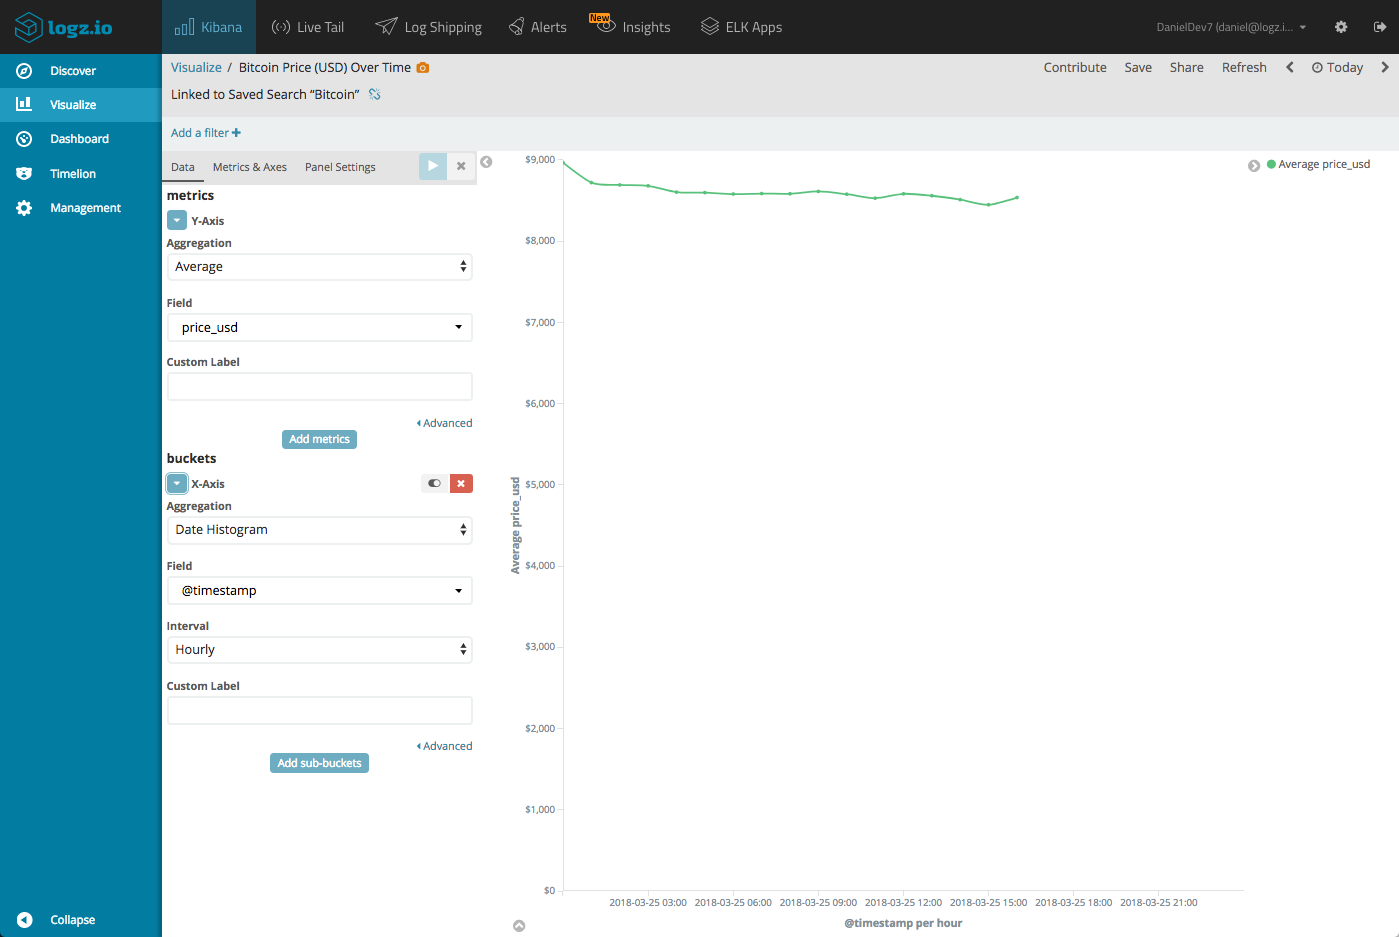
Next, let’s build a line chart showing the price of Bitcoin over time:
Cryptocurrency overview
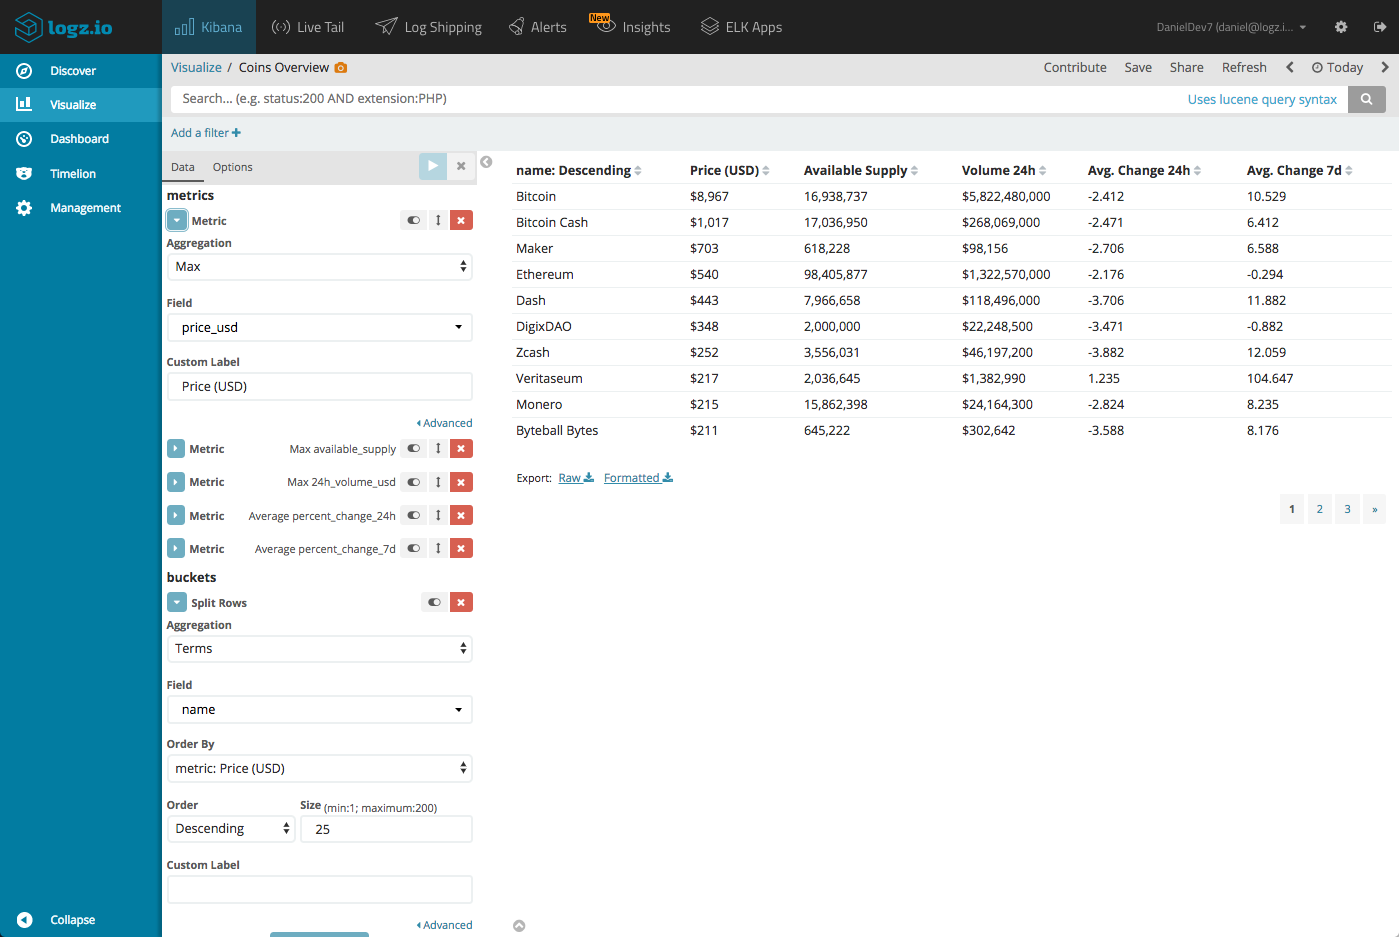
Just to make sure you don’t feel you’re missing out using ELK and not an online tool, let’s create a data table visualization that provides a nice general overview of the different coins.
To do this we will use all the dataset, so no need to use a saved search. We will use a number of metric aggregations and one bucket aggregation using the name field.
Trend line charts
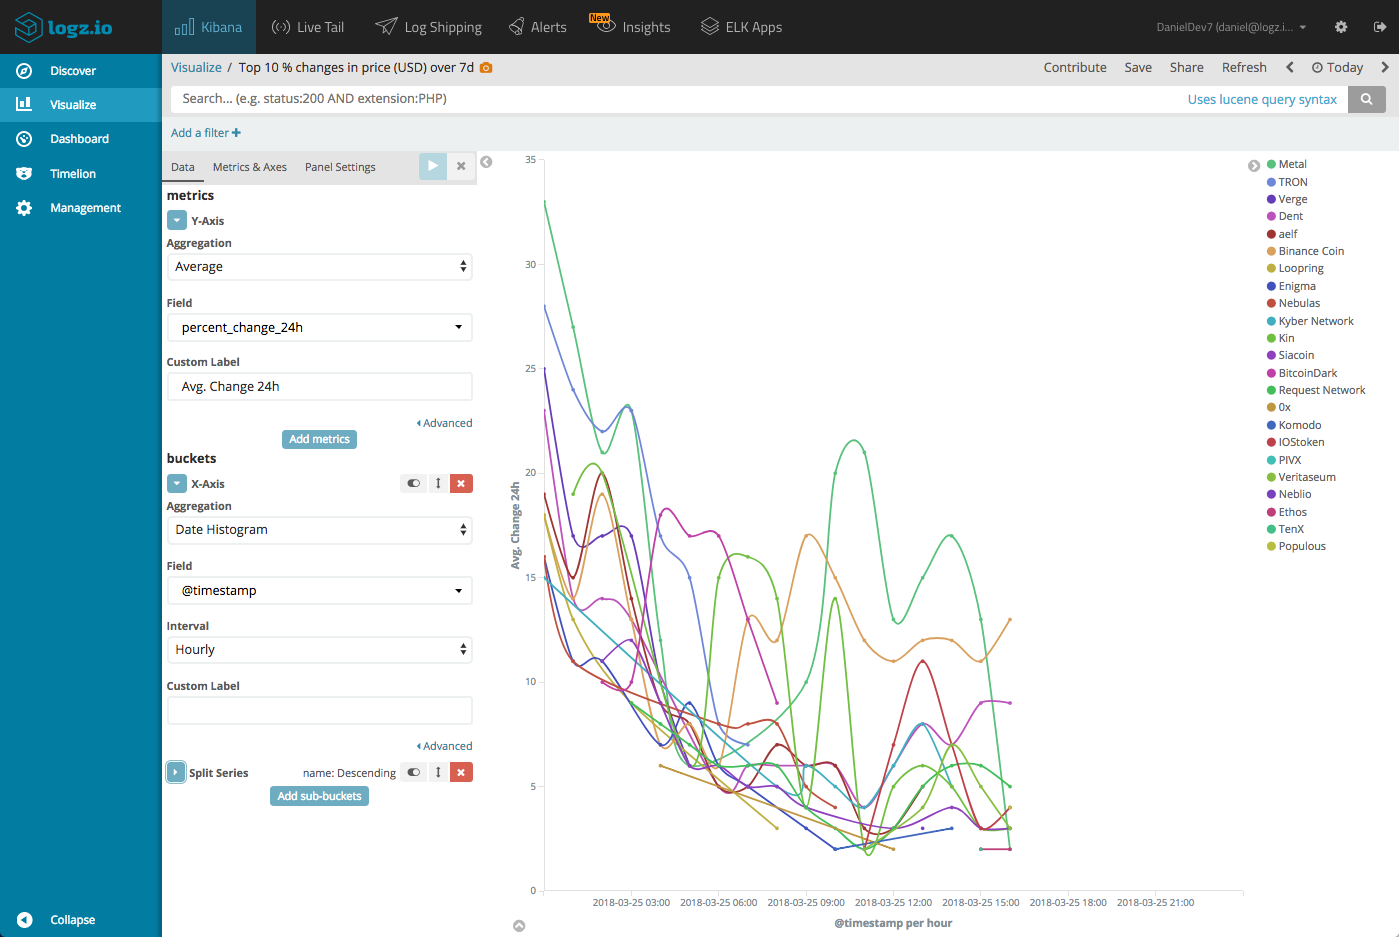
We can use a variety of different line charts to analyze trends. For example, we can create a line chart visualization that monitors the coins with the least or most change over the past 7 days:
Building your dashboard
These were some examples of what can be done with Kibana, but the sky’s the limit. Once you’ve got your individual visualizations ready, add them up into one comprehensive dashboard and organize them as you see fit for the best results.
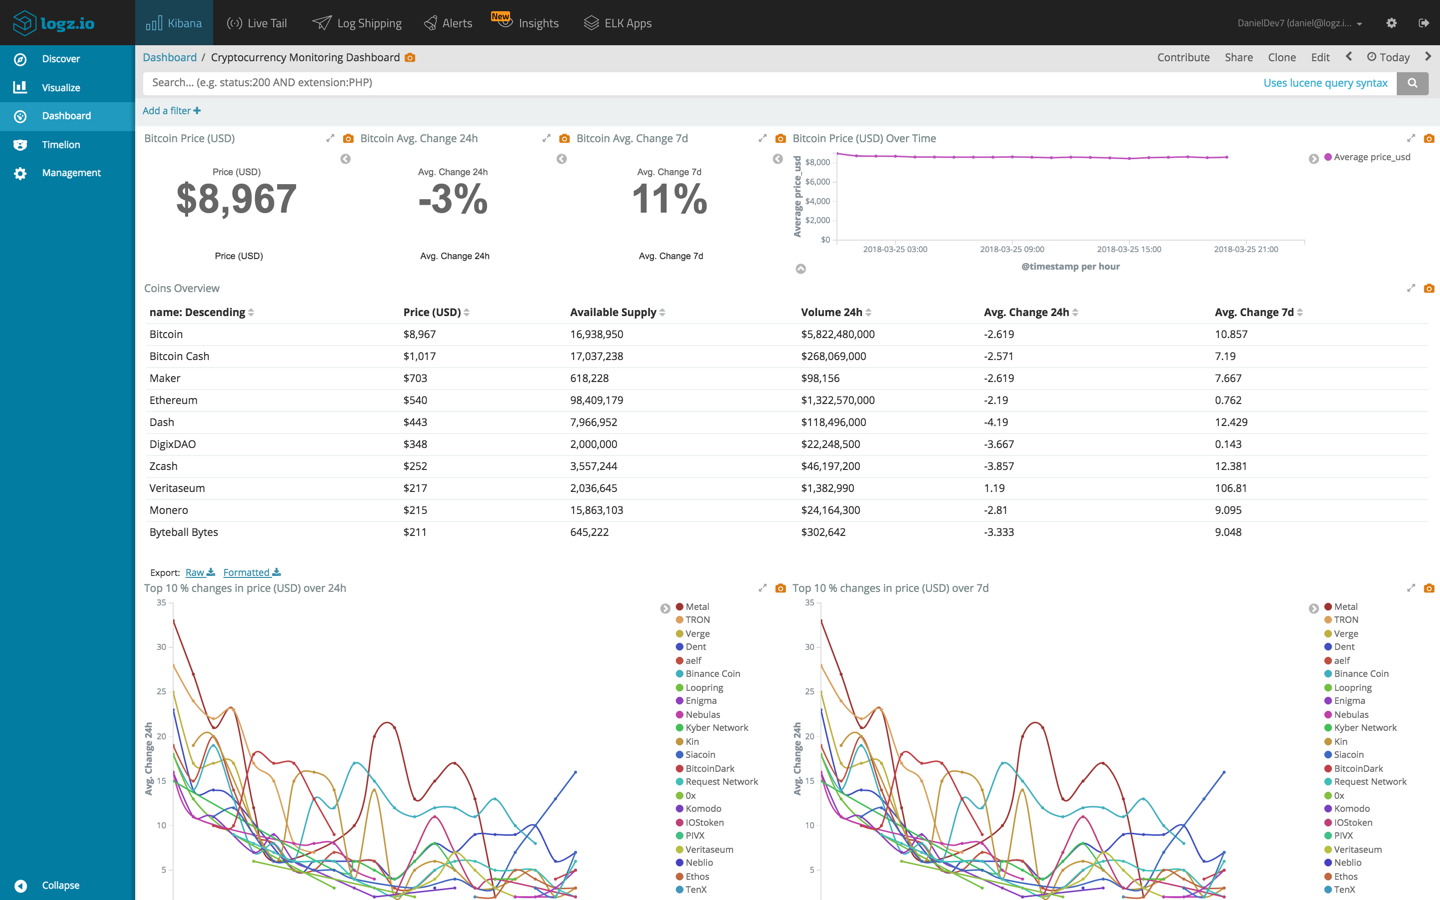
The dashboard shown here is available for importing as an object into Kibana here.
When do I buy/sell?
Good timing can make all the difference between loss and profit. What if you could get notified, in real time, on sudden dramatic changes in the market? Logz.io users can use the built-in alerting feature to set up an alert based on the cryptocurrency data analyzed in this article.
Bitcoin is no longer training for $20,000, not even $10,000. If you’re holding onto Bitcoin and want to know if there is another dramatic drop in its value, you could set up a similar alert to this:
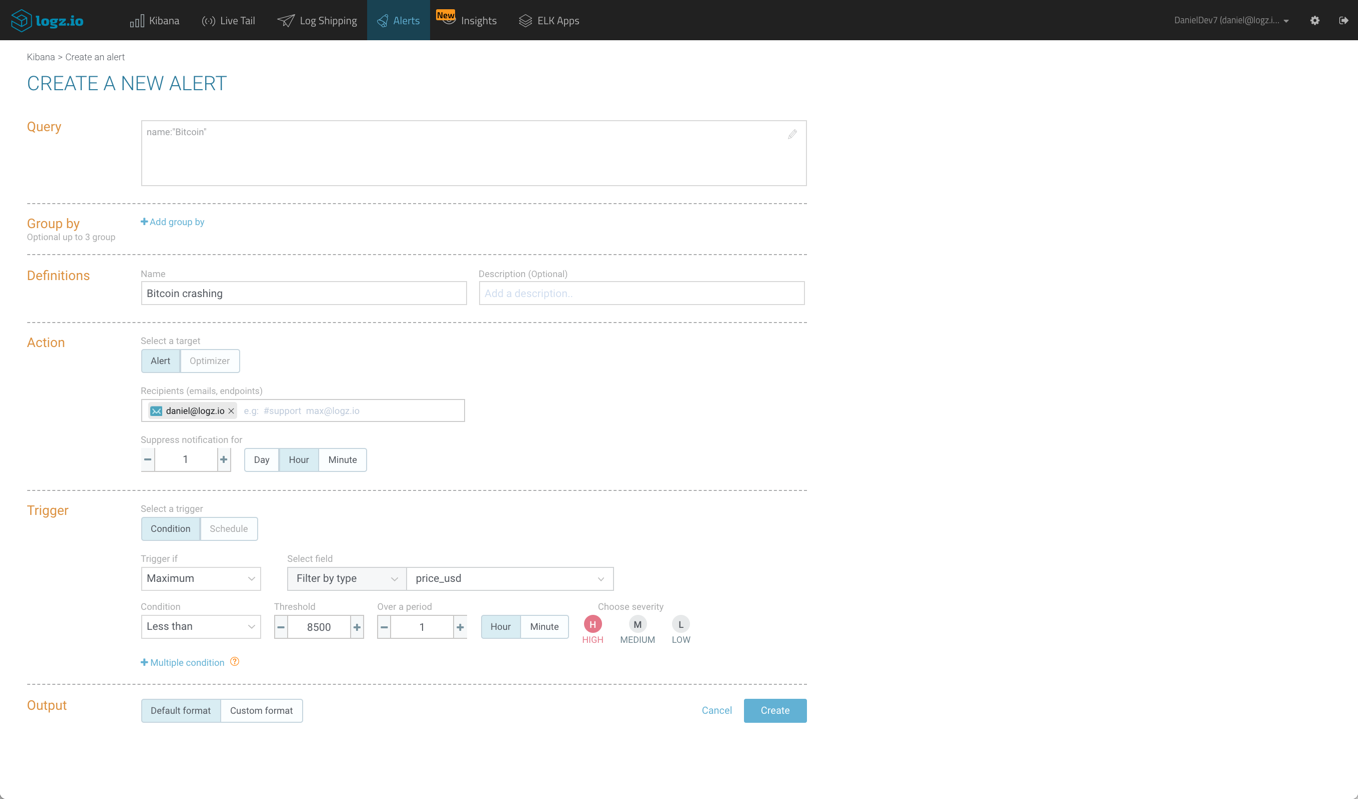
I’m using a Kibana query (name:”bitcoin”) and a max aggregation with a defined value for the condition. This will trigger an alert should Bitcoin’s price drop under $8,500 and notify me via email.
Summing it up
Last year, 2 Bitcoins was the the ransom asked by the instigators of a ransomware attack against unsecured Elasticsearch clusters. In this article we’ve taken a look at a different way these two technologies can interact, this time in a more amiable way.
Using the ELK Stack to monitor cryptocurrency might seem like an overkill, but the rich analysis options in Kibana, coupled with the publicly available data, are good reasons to try the integration out. Especially if you’ve already got a Logz.io account or your own ELK deployment.
Give it a try! If you’re using your own ELK, the dashboard shown above can be imported as a Kibana object from here. Feedback is welcome!

You Might Also Like

Battle of the Automation Servers: Jenkins vs. Bamboo vs. TeamCity

Logz.io Named Best Place to Work by Built In Boston
Get started for free
Completely free for 14 days, no strings attached.
