Is Managed Prometheus Right For You?
March 22, 2023

What is Prometheus?
Prometheus is the de facto open-source solution for collecting and monitoring metrics data. Its straightforward architecture, operational reliability, minimal upfront cost, and versatility in integrating with cloud-native systems make it the preferred choice for many.
Getting started is as simple as configuring the Prometheus server and setting simple parameters such as the scrape intervals and targets, cadence, and setting the job name based on the function of the server. Finally, you can begin to query in Prometheus’ expression browser and utilize its metrics collection capabilities.
While Prometheus’s single-node architecture makes it easy to get started with, it also limits its Prometheus scaling capabilities.

Since the metrics data is stored locally on a disk for each server, Prometheus can easily become overwhelmed when facing large amounts of data coming from cloud-native applications. As a result, some organizations will need to configure 10s or hundreds of individual Prometheus servers to collect their metrics.
While getting started with a few Prometheus servers is no problem – it can be a manual and complex process to install, configure, and manage 10 or 100s of Prometheus servers independently.
Prometheus is a great tool for monitoring metrics coming from your workload but can be challenging to manage at scale. Luckily, there is an alternative way to use it to its fullest potential without having to worry about managing a complicated architecture.
Why Use a Managed Service for Prometheus?
What are the best options to collect Prometheus metrics at scale? It is possible to set up an architecture with multiple Prometheus servers or even utilize a remote storage option such as Cortex, Thanos, M3DB, or something similar to manage high volumes of data.
However, these solutions still require manual oversight of the Prometheus architecture, and often need performance tuning and cluster management help with scaling.
If the goal is to spend less valuable time maintaining systems, then a managed service for Prometheus may be the right choice – especially if you already have Prometheus servers in place collecting data.
With a managed service, your Prometheus infrastructure’s scalability, reliability, and overall management are mostly outsourced. Instead of spending time maintaining your Prometheus architecture, your team can instead dedicate their effort to monitoring their metrics and resolving the production issues flagged by them.
Fortunately, several vendors can provide managed services for Prometheus that are in the market today. While there are slight differences among them, they all offer solutions that can manage your Prometheus infrastructure and scale seamlessly alongside your data.
Amazon Managed Service for Prometheus (AMP)

Amazon Managed Service for Prometheus (AMP) is a serverless monitoring system that allows for monitoring containerized applications and infrastructure at scale.
It provides a fully managed Prometheus as a service experience that is backed by the security, scalability, and availability of the AWS infrastructure. Data is stored using Cortex, an open-source time series database that is based on Prometheus and allows for horizontal scalability.
Querying for Amazon Managed Service for Prometheus is done through PromQL, a flexible query language that was developed to troubleshoot and gain insights from Prometheus data. PromQL results can be ingested by external systems through the HTTP API and tools such as Grafana using the Prometheus data source plugin.
A notable drawback of using AWS is the need to purchase and use multiple tools to see the full benefit of AWS’ observability suite.
For example, to visualize your metrics data within the AWS ecosystem, you would need to separately purchase Amazon Managed Grafana, while other platforms provide visualization capabilities at no additional cost. This adds an additional recurring cost and complexity by adding more tools.
Another impact of having to use separate tools for monitoring is the added difficulty of correlating data types.
AMP requires users to configure and analyze their metrics, log, and trace data in separate tools altogether (AMP is only able to manage metrics, for example), which does not provide the benefits of quick correlation among the data types. Observability data is complex, and it’s essential to use a tool that allows you to troubleshoot quickly and efficiently.
Google Cloud

Google Cloud Managed Service for Prometheus (GMP) is another popular multi-cloud solution for Prometheus management.
With Google Cloud’s solution, you’re able to monitor metrics by using the familiar features of Prometheus while the scalability and operational management are all handled by Google. GMP can monitor data that comes from hybrid and multi-cloud workloads and retain data for 24 months at a time.
The data from Google Cloud Managed Service for Prometheus is stored in Monarch, the globally distributed data store created and used by Google to monitor their internal systems.
Managed Service for Prometheus combines PromQL’s Query API with Monarch’s data so that you’re able to query your metrics data from either Managed Service for Prometheus, or even query data from Google Cloud Monitoring (GCP’s proprietary monitoring solution) or GKE (Google Kubernetes Engine).
Like AWS, Google Cloud Managed Service for Prometheus faces the issue of tool sprawl, a problem that adds complexity and can impact the mean-time-to-resolution in your system. Tools such as Cloud Monitoring, Cloud Logging, and Managed Service for Prometheus all live in separate interfaces, making it difficult to correlate the data coming from each of them.
In other platforms, the functionality and integration of these three tools follow a more unified approach. When telemetry data is aggregated into one platform and visualized with this approach in mind, it creates a much simpler route to addressing complex issues in a workload.
Similarly, a pervasive issue for monitoring is managing expanding telemetry data volumes. Google’s platform provides features that allow you to reduce the amount of data ingested, but this forces the user to spend time manually filtering and selecting their data to decide what’s important.
More modern solutions utilize automation, AI, and machine learning to help users deprioritize noisy data and identify what’s important for troubleshooting in their environment, saving them valuable time and effort.
Grafana Labs

Grafana Labs is the company behind Grafana – the open-source dashboarding tool mainly used for metrics but has expanded to now provide a full open-source analytics platform. This platform is known as Grafana Cloud, which combines logs, metrics, and traces that are all supported by Grafana’s top-of-the-line visualizations.
In 2022, Grafana Labs launched Grafana Mimir, intending to create a scalable, open-source metrics database as an alternative to others like Cortex, Thanos, and M3DB. Mimir was originally forked from Cortex and has improved on the query performance from it by up to 40 times the speed, according to Grafana.
Mimir integrates directly with Prometheus and supports the use of its features such as remote write, PromQL, and alerting capabilities. You’re also able to utilize Grafana Agent, their observability data collector, to send metrics, trace, and log data to the Grafana platform.
While Grafana Labs has created a comprehensive observability tool around its open-source visualization tool, the next step for them to improve their Prometheus-as-a-service offering is to focus on their data optimization capabilities.
GrafanaLabs does not provide a unified UI to inventory and drop data from all telemetry types when necessary, or other features to get rid of noisy data.
Having to spend time searching through and excluding certain data can be a complex and timely process. Part of what makes Prometheus management difficult is the high volume of data, and it’s important to be able to easily discard metrics as they age and become less relevant.
Grafana Labs also utilizes their proprietary Grafana Loki and Grafana Tempo for their log and trace observability solutions. Grafana Loki’s capabilities are unique in the sense that they are inspired by Prometheus in terms of their logging aggregation.
Similarly, Grafana Tempo offers tracing observability without the need for indexing any traces. While this may have some benefits, these products are as widely adopted as technologies such as OpenSearch and Jaeger, which users may have more familiarity with.
Logz.io

Logz.io Infrastructure Monitoring also offers Prometheus as a service, unified with logs and traces all in one platform. This allows you to scrape metrics with your existing Prometheus implementation, without having to worry about its management and scalability that comes with long-term storage.
Centralizing your metrics from Prometheus and other sources is simple with Logz.io. Once creating an account, it’s possible to start ingesting metrics data by adding a remote write to your Prometheus config files or from any other cloud, hybrid, or on-premise environment.
Or, if you’re not currently using Prometheus, you can use Logz.io’s Telemetry Collector agent to begin collecting metrics for Logzio storage and analysis in a few simple steps.
Being able to visualize all of your data is essential for effective observability. Our open-source platform is based on the leading open-source technologies for each telemetry type.
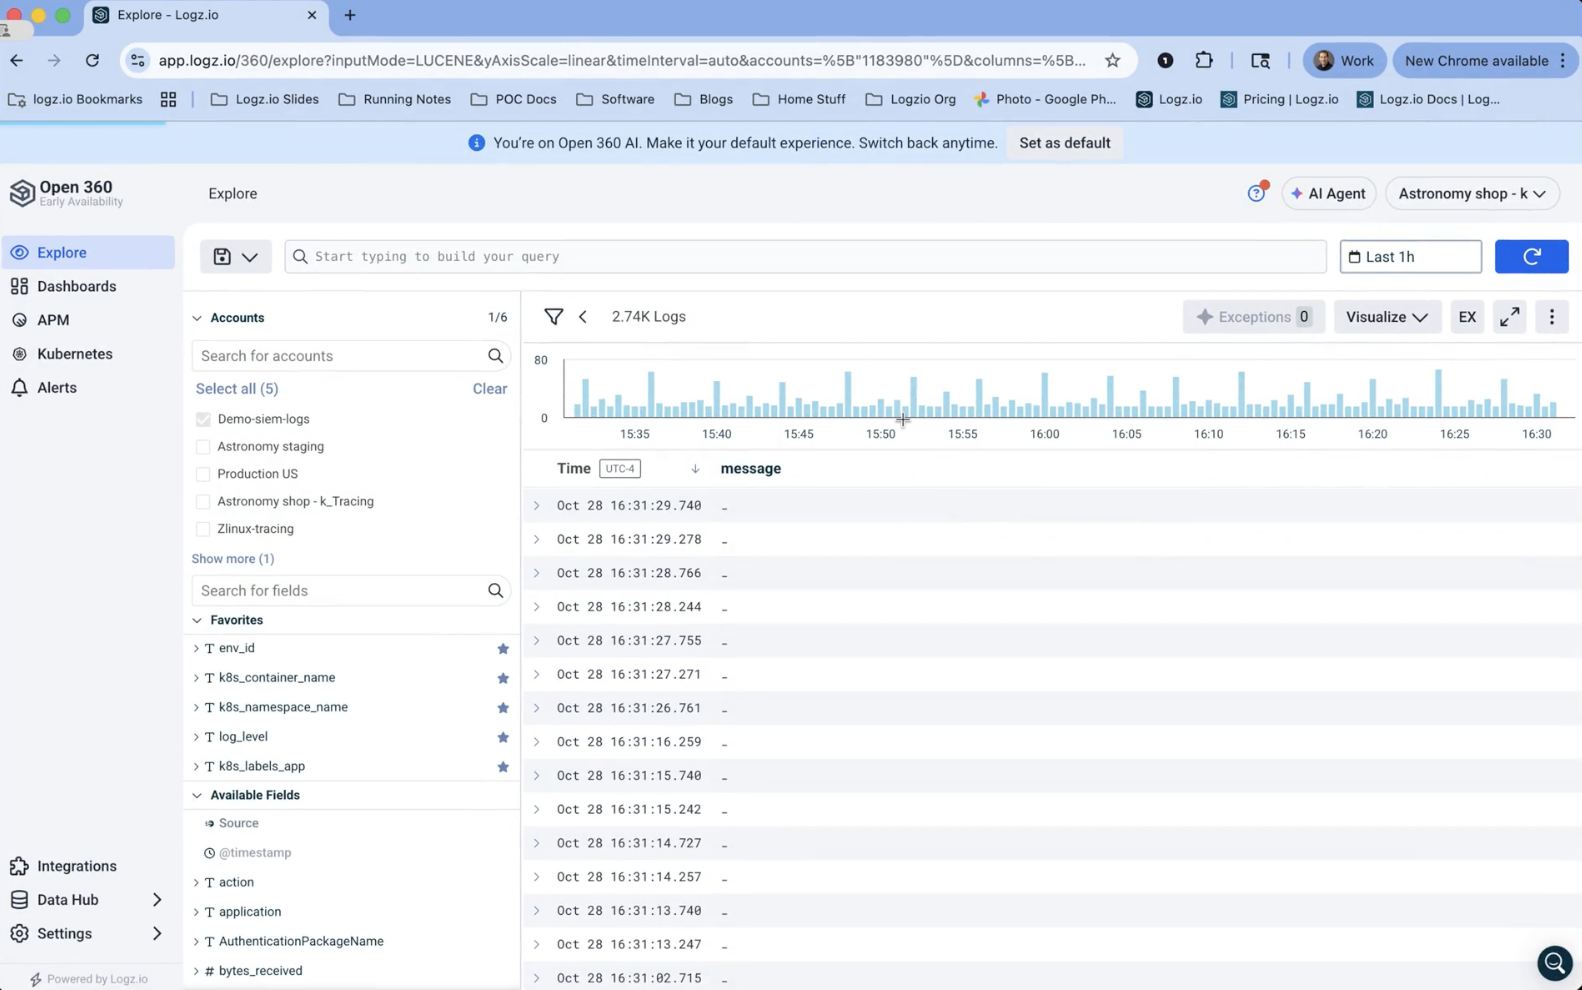
Within our platform, you’re able to create customizable dashboards, utilize pre-built dashboards, or migrate existing dashboards you currently use. In order to quickly correlate observability data, it’s possible to switch directly from dashboards to view the related logs and traces and even analyze spikes based on recent deployments for further analysis.
To manage the growing volumes of your metrics and other telemetry data, we launched the Data Optimization Hub. This allows you to inventory all of your metrics, logs, and traces and filter out all low-priority data within a unified UI to reduce costs.
Logz.io shows metrics that are being used for monitoring, and those that are not can be filtered out of Logz.io or rolled up to reduce their volume and costs. Metrics are retained in our platform for 18 months.
Our alerting capabilities can bring the data and insights directly to you and your team. You’re then able to stay on top of any issues that arise in real time by sending alerts to your team’s preferred notification endpoints. Our alerts can be sent to specific users, and even combine metrics, logs, and traces data all within one alert for more unified reporting.
Prometheus As A Service
Prometheus is the industry standard for collecting cloud infrastructure and application metrics, and it’s becoming more and more prominent in DevOps observability toolkits.
If you’re using Prometheus and want a unified, open-source tool that can help with scaling your architecture, start a Logz.io free trial and start monitoring your metrics today.


