How to Effectively Monitor Kubernetes in 2025
August 17, 2025
As Kubernetes environments continue to grow in scale and complexity, having a robust monitoring strategy is no longer just good practice, it’s essential for survival. For engineering teams in 2025, effective monitoring and observability is the bedrock of performance, reliability, and cost control. This guide dives into the critical aspects of modern Kubernetes monitoring, from key metrics to the top tools/frameworks and the rising role of AI in managing these complex systems.
Key Takeaways
- Complexity is the new norm: In 2025, Kubernetes environments are more dynamic and distributed than ever, so many new technologies to add on top of it. Monitoring is critical to manage the chaos of ephemeral pods, service meshes, and multi-layered abstractions that define modern cloud-native systems.
- Go beyond basic metrics: Successful monitoring requires tracking a combination of cluster, node, pod, and application-level metrics. Pay close attention to API server latency, container restart rates, and resource usage versus requests/limits to ensure both stability and cost-efficiency.
- AIOps is a game-changer: Integrating AI/ML into your monitoring strategy is becoming essential. AIOps tools automate anomaly detection, correlate disparate signals to find the root cause of issues faster, propose remediation action and predict future problems, moving teams from a reactive to a proactive stance.
- Observability requires a unified approach: The different observability signals: traces, metrics, and logs are essential for deep insights. Not all of them are mandatory, it depends on the use case, but sometimes relying on one pillar alone is not enough to diagnose complex issues in a distributed architecture.
- The right tooling is crucial: While open-source tools like Prometheus and Grafana are foundational, a truly effective strategy often involves combining them, using a platform that can handle the scale and reduce the management overhead or combine both of the best worlds (open-source and vendors).

Why Monitoring Kubernetes Is Critical in 2025
Let’s be real, if you’re running Kubernetes in 2025, you’re not just managing a few simple deployments. You’re likely dealing with a sprawling ecosystem of microservices, serverless functions, and complex networking layers, possibly across multiple clusters. This growing complexity makes effective monitoring non-negotiable for several reasons:
- The ephemeral challenge: Pods and containers are “transient” by nature. They can be created, destroyed, and rescheduled in seconds. When a pod crashes, its logs and state disappear with it unless you have a logging and monitoring system in place to capture that data immediately.
- Deep abstraction layers: An issue could originate at the hardware level of a node, within the Kubelet, in the container runtime, inside a specific container, or from an interaction between services. Without a comprehensive kubernetes observability strategy, pinpointing the root cause is rough, trust me.
- Cost Control and FinOps: Inefficient resource management is a silent budget killer. Over-provisioning CPU and memory “just in case” leads to wasted cloud spend. Kubernetes cluster monitoring provides the data needed to right-size your workloads, enforce sensible resource quotas, and make data-driven decisions to optimize costs.
- Security in a Distributed System: Kubernetes security monitoring is a critical, yet often overlooked, aspect of observability. Monitoring Kubernetes API server audit logs, network policies, and RBAC roles helps detect unauthorized access, suspicious activity, or misconfigurations that could expose your cluster to threats.
Key Metrics to Monitor in Your Kubernetes Environment/Cluster
To get a clear picture of your cluster’s health, you need to collect metrics from multiple levels. Many of these metrics are exposed by core Kubernetes components like the
Kubelet and its integrated cAdvisor daemon, which runs on each node to gather container performance data.
Cluster-Level Metrics
- Node Status: The number of nodes in Ready vs. NotReady states. A rise in NotReady nodes is a major red flag for cluster health.
- Resource Allocation: Track the total CPU, memory, and disk space available in the cluster versus the resources requested by all pods. This helps with capacity planning and prevents widespread pod scheduling failures.
- API Server Health: The Kubernetes API server is the brain of the cluster. Monitor its request latency and error rates (specifically 4xx and 5xx HTTP codes). High latency can slow down the entire cluster, including deployments and autoscaling.
- Etcd Health: Keep an eye on etcd database size, disk latency, and leader changes issues here can cause cluster-wide instability.
Node-Level Metrics
- Resource Utilization: CPU, memory, and disk usage for each node. Sustained high utilization (e.g., >85%) can lead to performance degradation and pod evictions.
- Disk Pressure: A specific condition indicating that disk space is running low on a node. This can prevent new pods from being scheduled and can impact logging and container image storage.
- Network I/O: Tracking bytes sent and received per node helps identify potential network bottlenecks or unusually high traffic patterns.
Pod and Container-Level Metrics
- Pending Pods Count: A spike means the scheduler can’t place pods, often due to insufficient resources or node taints.
- Container Restarts: One of the most critical health indicators. A high restart count for a container in a pod almost always signals an application-level crash loop, Liveness & Readiness Probe Failures (direct indicators that an app is unhealthy or not ready to serve traffic), or an out-of-memory (OOM) kill.
- CPU and Memory Usage: Monitor the actual CPU and memory consumption of your pods against their configured requests and limits. This is vital for both performance tuning and identifying candidates for cost optimization.
- CPU Throttling: This metric tells you how often a container wanted to use more CPU than its limit allowed. Significant throttling indicates that your pods are under-provisioned and performance is likely suffering.
- Network Latency per Pod: Useful for pinpointing service-to-service communication problems.
The Rise of AIOps: Integrating AI/ML into Kubernetes Monitoring
As we collect terabytes of observability signals, the next challenge isn’t data collection, it’s data interpretation. This is where AIOps comes in. Manually sifting through dashboards and log queries during an outage is no longer scalable. AI/ML practices are transforming monitoring from a reactive to a proactive and predictive discipline.
- Contextual Alert Analysis and Noise Reduction: Beyond just triggering an alert, AIOps excels at enriching it with context. It can group related alerts from different system components into a single, actionable incident. For example, a flood of 50 alerts might be condensed into one problem: “Node X is under memory pressure, causing cascading pod failures.” This cuts through the noise, allowing engineers to immediately grasp the full scope of the issue without having to piece it together manually.
- Automated Root Cause Analysis: When an issue occurs, the real challenge is correlating signals across the stack. Did a spike in pod restarts cause the high API latency, or was it a failing node? AIOps features can analyze different telemetry data simultaneously to identify the most likely root cause and affected dependencies, reducing the famous (but important) MTTR, from hours to minutes. This is something platforms like Logz.io are actively developing with features that surface critical exceptions from logs and correlate them with performance metrics.
- Predictive Analytics: The ultimate goal is to solve problems before they happen. By analyzing historical data, ML models can predict future capacity needs, forecast potential component failures, and identify seasonal patterns in application load. This allows platform teams to proactively scale resources or perform maintenance during low-traffic periods, preventing outages altogether.
- AI-Driven Workflow Automation Between Platforms: The AI not only detects, correlates, and analyzes critical issues, but also manages workflows in external platforms. For example, it can create detailed tickets with root cause summaries, affected services, relevant log snippets, and correct team assignments, bridging observability and action while eliminating manual steps in incident creation.
- Guided and Automated Remediation: Modern AIOps tools can suggest fixes based on historical data and similar past incidents (e.g., rollback latest deployment, increase pod memory). In advanced setups, this extends to automated remediation via webhooks or runbooks, where predefined actions like pod restarts or rollbacks resolve common issues without human intervention.
Ways to Observe and Monitor Your Kubernetes Environment (2025)
The landscape of kubernetes monitoring tools is vast, but a few key players and stacks have emerged as industry standards. Here’s a look at five powerful, unranked approaches you should consider.
- OpenTelemetry (OTel)
OpenTelemetry is more than a tool; it’s the vendor-neutral CNCF standard for instrumenting, generating, and collecting telemetry data. By implementing OTel, you decouple your application’s instrumentation from the monitoring backend, avoiding vendor lock-in. In a Kubernetes context, we’ll need two installations of the collector, one as a Daemonset (you can think of it as an agent) and one as a Deployment (you can think of it as a gateway). The Daemonset installation of the collector will be used to gather telemetry related to nodes and workloads running on those nodes. The deployment installation of the collector will be used to collect telemetry related to the cluster as a whole. After the data is collected, it can be sent to any backend you choose, enabling you to monitor and analyze your cluster.
- Fluentd / Fluent Bit
When it comes to logging in Kubernetes, Fluentd and its lightweight counterpart, Fluent Bit, are the undisputed champions. Fluent Bit is designed for high-performance, low-resource log collection at the edge, making it the perfect choice to run as a DaemonSet on every node, tailing container logs. It can then forward this data to Fluentd, which acts as a more powerful aggregation and routing layer for forwarding to output destinations like Logz.io, S3, Nagios, among others log management and monitoring systems. - Prometheus / Grafana
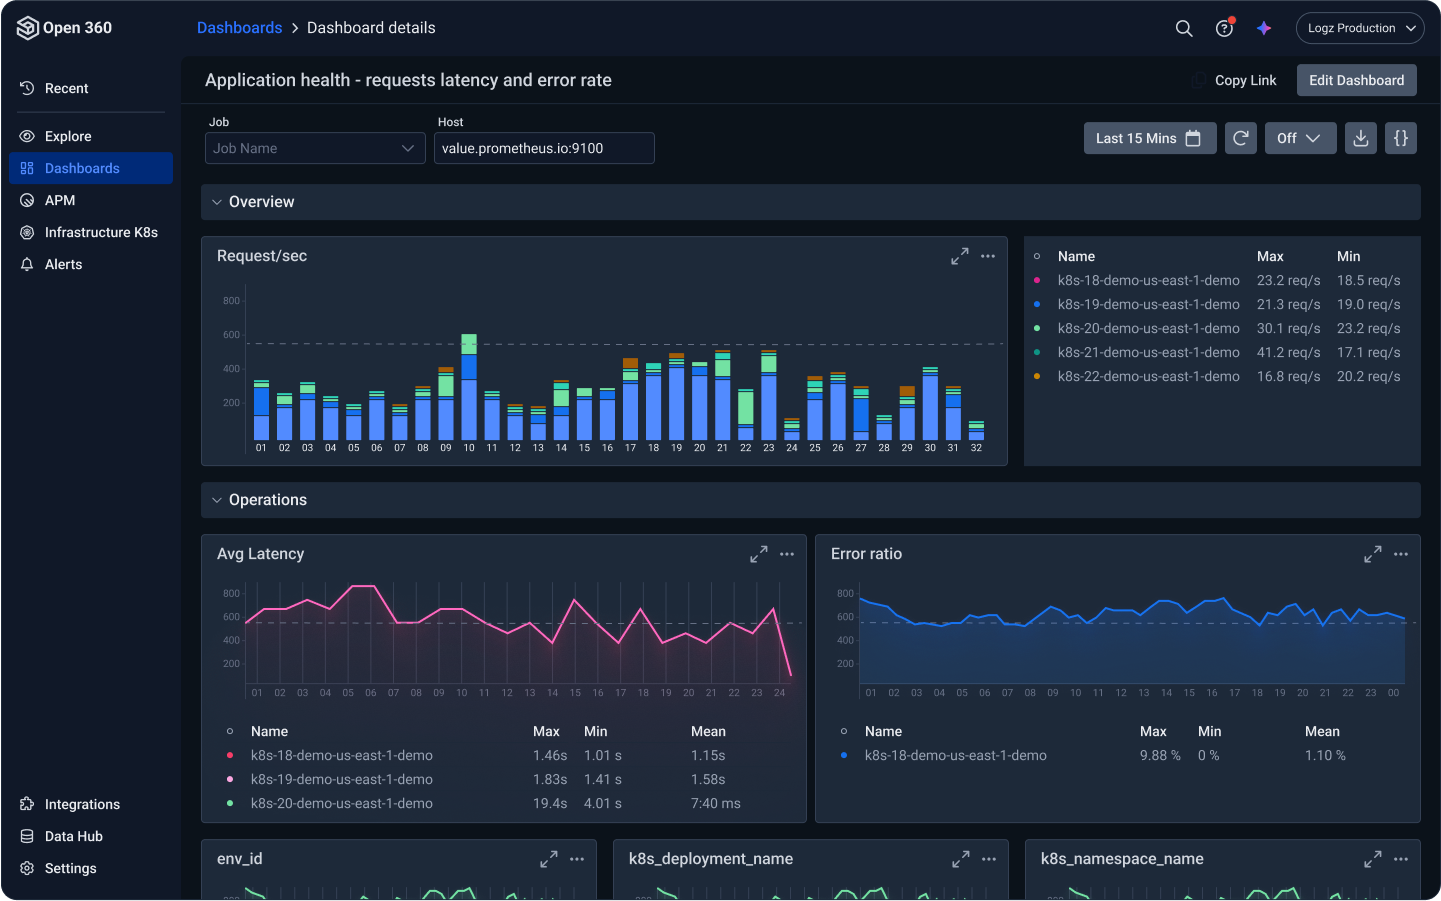
This is the de facto open-source stack for metrics-based Kubernetes cluster monitoring. Prometheus uses a powerful pull-based model, automatically discovering and scraping metrics from Kubernetes services. Grafana provides a flexible and visually appealing way to explore and visualize that data. While this stack offers immense flexibility and control, it can require careful configuration and ongoing management to fully leverage its capabilities in complex environments. - Logz.io
Logz.io offers a unified, SaaS-based, AI-powered observability platform built on popular open-source standards, including OpenSearch for logs, Prometheus for metrics, Jaeger for traces, and full support for OpenTelemetry to collect, process, and route telemetry data to the platform. The key value here is offloading the immense operational burden of scaling and managing these open-source stacks yourself. Logz.io provides a single pane of glass for all your telemetry data, enhanced with AI agent insights to do automatic root cause analysis, alert analysis, and correlate data across signals to dramatically speed up troubleshooting. - Kubewatch
While not a comprehensive observability tool, Kubewatch is an excellent, lightweight addition to any monitoring toolkit. It acts as a Kubernetes event watcher, notifying you in real-time about changes in your cluster. You can configure it to send alerts to Slack, Microsoft Teams, or other webhooks when specific events occur, like a pod being terminated or a ConfigMap changing. This provides immediate visibility into cluster activities. - Cillium
Powered by eBPF, Cilium provides incredibly deep visibility into network communication at the kernel level. It allows you to monitor and visualize traffic flows between services, get L3/L4 and even L7 metrics (like HTTP request/response rates), and enforce network security policies. Through its observability platform, Hubble, you can generate a real-time service dependency map, diagnose network drops, and gain insights that are invaluable for both kubernetes security monitoring and troubleshooting complex connectivity issues.
FAQs
What is the primary purpose of Kubernetes monitoring tools?
Their main purpose is to provide deep visibility into the health, performance, and resource utilization of clusters, nodes, and the workloads running on them. These tools empower engineers to proactively detect, diagnose, and resolve issues before they impact users. They are essential for ensuring application reliability, optimizing performance, and controlling operational costs.
Why is monitoring Kubernetes environments more complex than traditional infrastructure?
It’s more complex due to Kubernetes’ dynamic and distributed nature. Unlike static servers, Kubernetes components like pods are ephemeral. They are created and destroyed constantly. This requires a monitoring system that can track issues across multiple abstraction layers and correlate data from thousands of short-lived, interconnected components, a challenge that doesn’t exist in monolithic systems.
What key types of data do Kubernetes monitoring tools typically collect?
They primarily collect the three pillars of observability. This includes Metrics, which are numerical, time-series data like CPU usage or request latency. They also gather Logs, which are structured or unstructured text-based event records from applications. Finally, they collect
Traces, which map the entire journey of a request as it moves through various microservices in the cluster.
What are the benefits of effective Kubernetes monitoring?
The core benefits are improved reliability, performance, and cost-efficiency. Effective monitoring drastically reduces Mean Time to Resolution (MTTR) for incidents, leading to higher uptime. It helps engineers pinpoint and fix performance bottlenecks to enhance the user experience. Furthermore, by providing clear insights into resource consumption versus allocation, it enables significant cost savings on cloud infrastructure


