Anti-DDoS Attack Protection with the ELK Stack
March 1, 2017

Last October, a DDoS attack against Dyn’s DNS infrastructure brought down sites in the United States and Europe including Twitter, Netflix, Reddit, and CNN.
Distributed Denial of Service attacks, of course, is not new. But what made this one especially interesting was that this unprecedented-in-size attack was orchestrated using IoT devices — specifically, a Mirai botnet that was activated on cameras and DVR players.
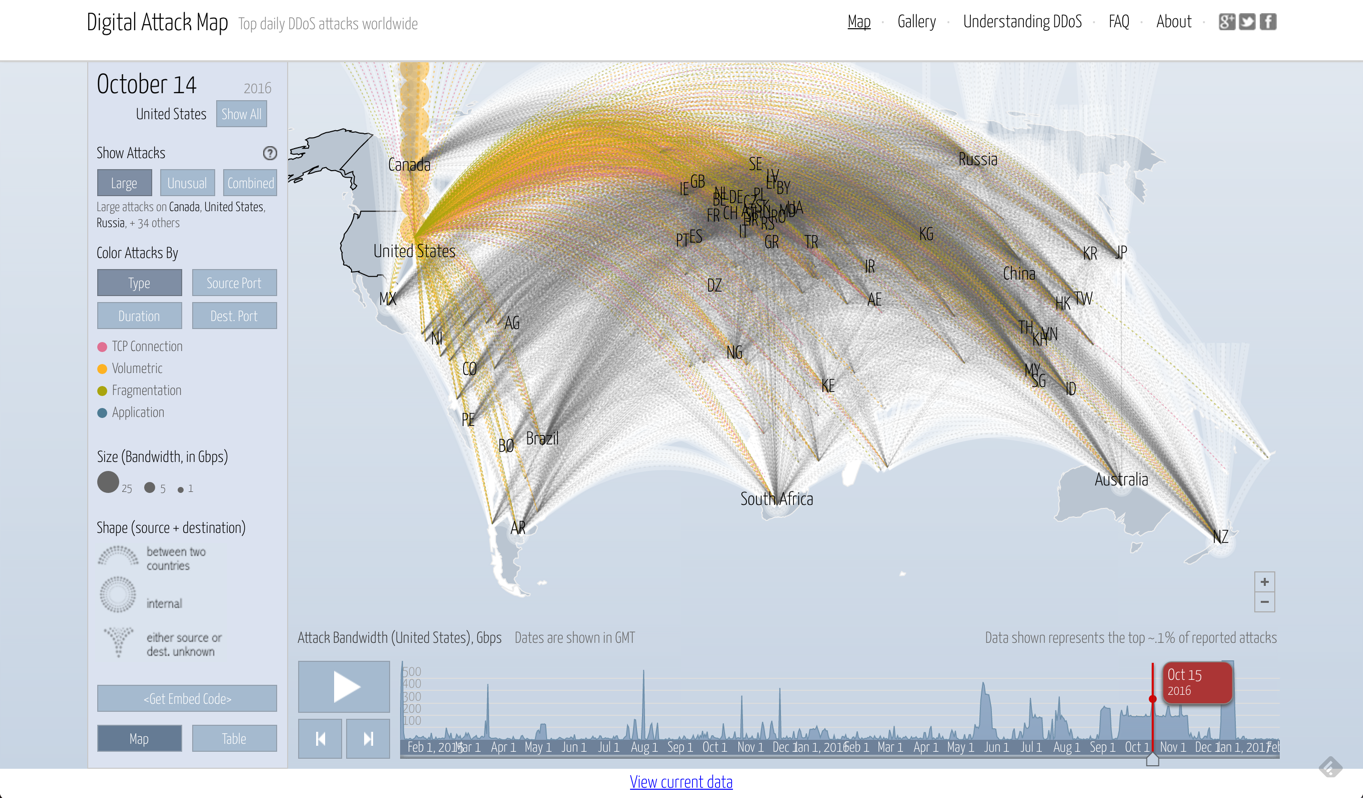
To get an idea of what this attack looked like from a visual perspective, here is a map by Digital Attack Map:
That’s what cyber piracy looks like these days.
Centralized Logging and Monitoring
DevOps engineering and IT operations teams employ a variety of security measures to prevent hackers from accessing systems and customer data, but the fact is that little can be done against attacks that focus on creating a surge of requests from distributed sources with the goal of disrupting a service from the outside.
Once an attack is mounted, time is of the essence. Quick identification is key to minimizing the damage, and that’s where log monitoring comes into the picture. Logs contain the raw footprint generated by running processes and thus offer a wealth of information on what is happening in real-time.
Using the ELK Stack, companies can build an effective, centralized logging architecture that:
- Pulls the data from the different layers in your IT environment including applications, web servers, databases, and firewalls
- Enhances and parses the data so it is easier to analyze
- Stores the data, and
- Visualizes the data in powerful monitoring dashboards
However, in the context of a DDoS attack, not every log will be important and not every visualization will help identify an attack.
So, what logs can and should be monitored? This, of course, depends on the specific system that you are maintaining. This article will focus on the most popular targets for DDoS attacks — websites.
Web Server Requests
Monitoring requests to web servers is the main method currently in use and in this context being able to analyze and visualize access and error logs in server log analysis is instrumental for quick identification.
Whether Apache, IIS, or NGINX — these access logs contain a wealth of information about the requests being made to your servers such as response errors and originating IP addresses, geolocations, and devices. With Kibana, you can build a series of visualizations to monitor for the signs that may indicate that an attack is taking place.
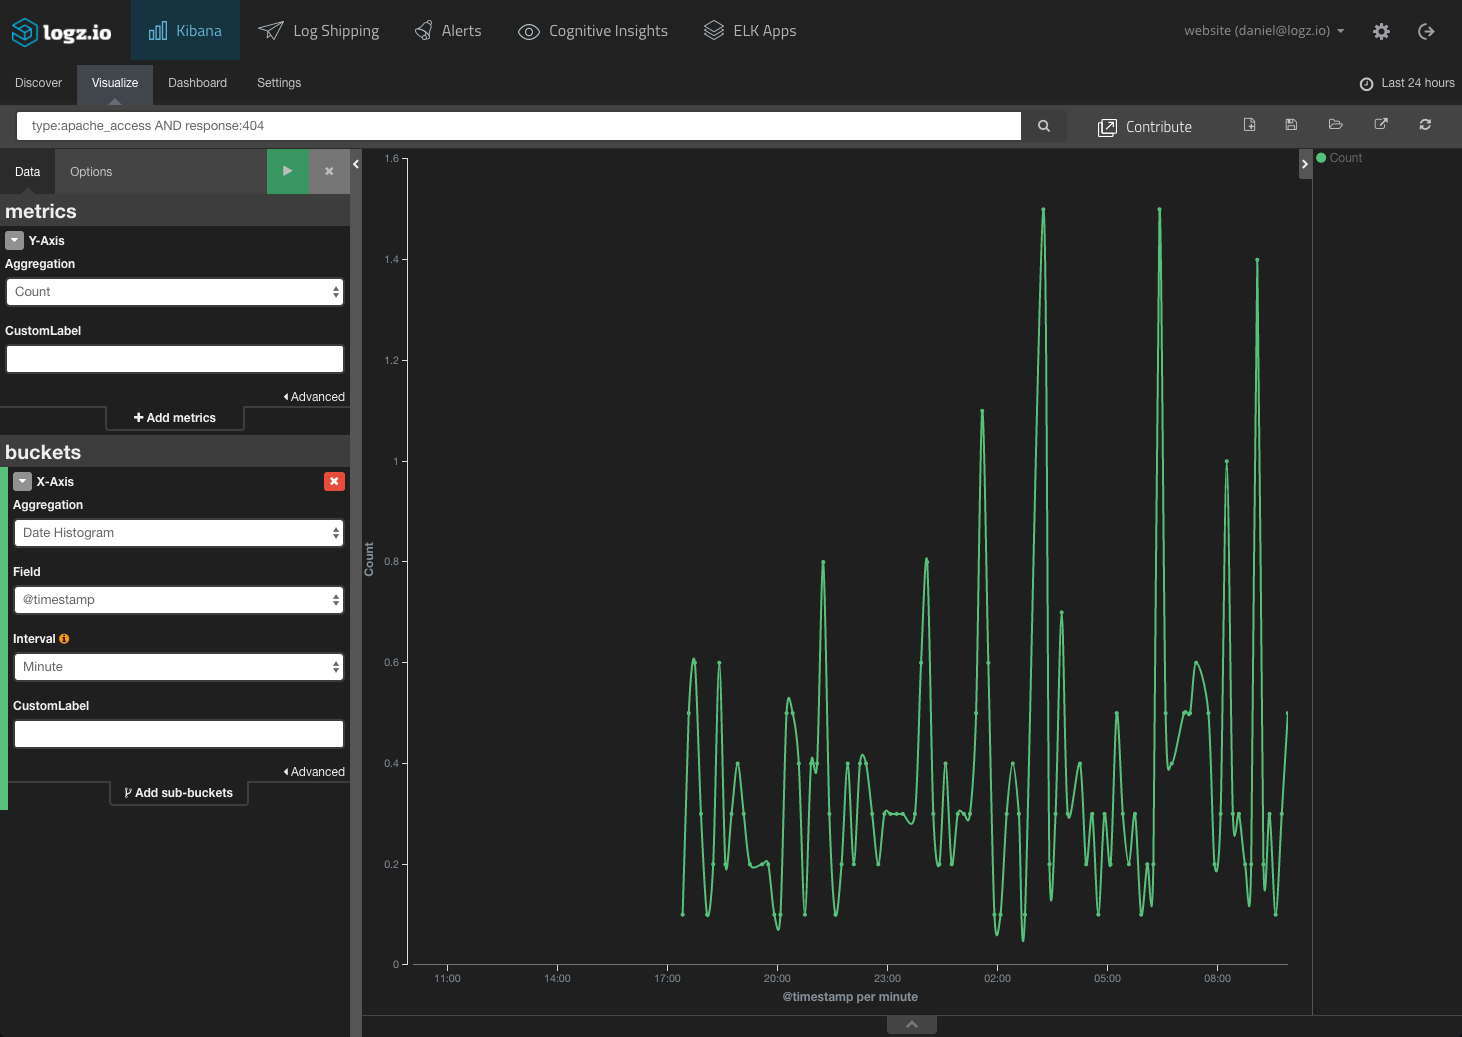
Monitoring “503” responses from your server for slow response times is too late because the response codes indicate that your service is already down. However, attacks will bombard the server with bad requests, so monitoring for spikes in “404s” can help. Based on a baseline metric, you could create an alert that would notify you once a certain number of “404s” are triggered over a specific period of time:
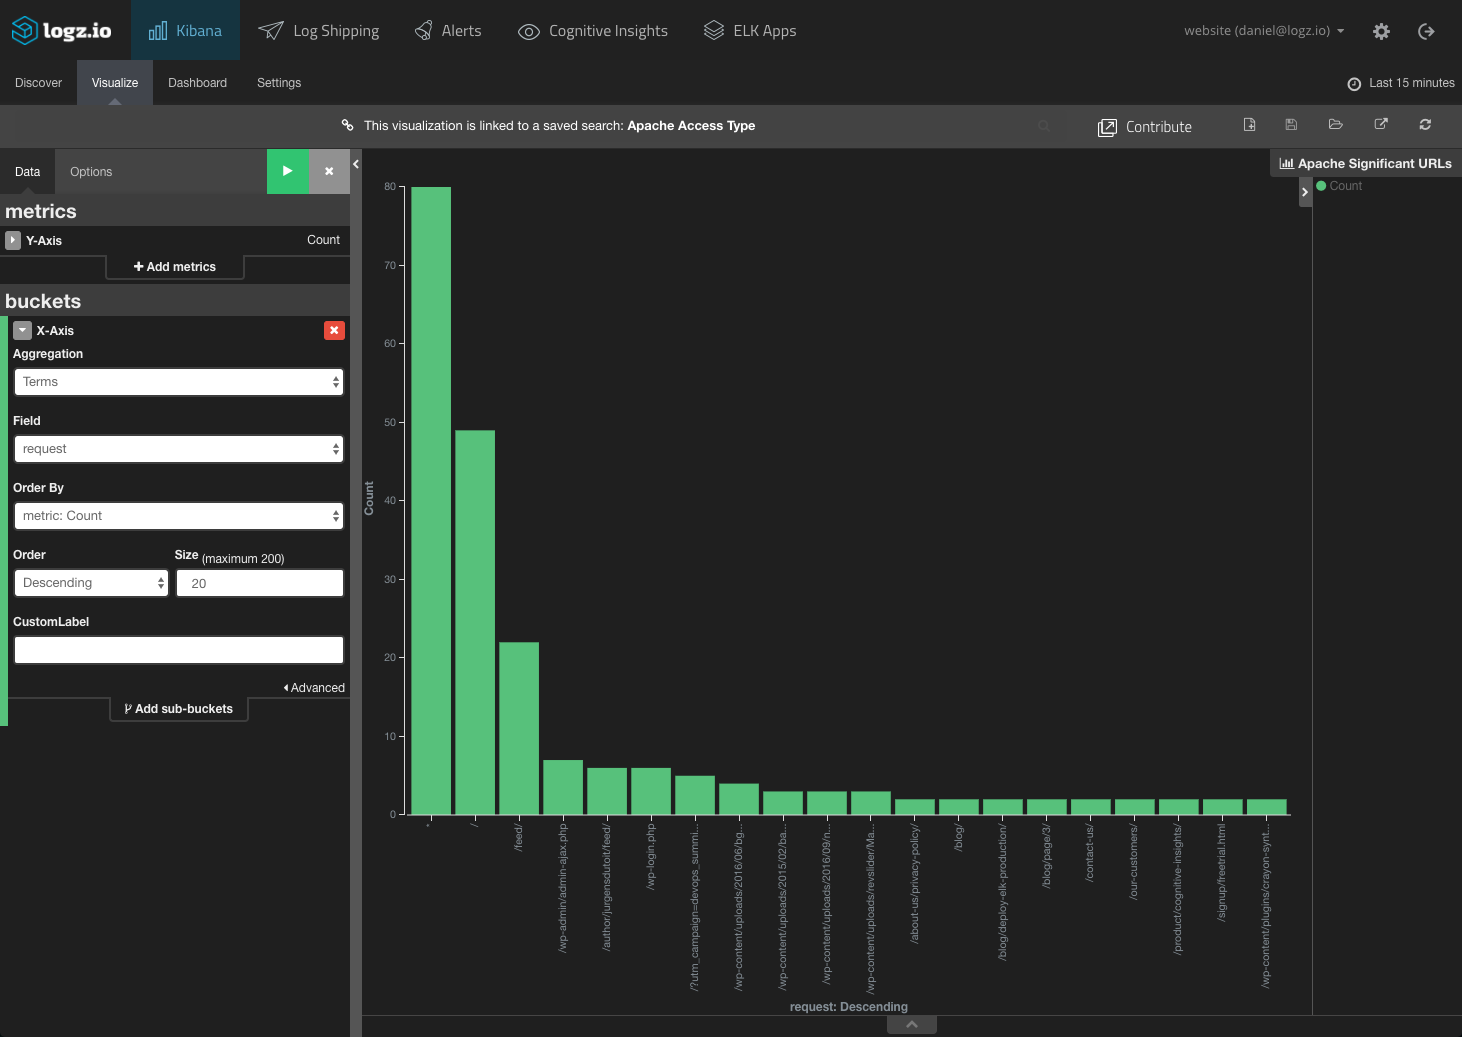
Monitoring the actual request URLs is another method. Attacks will use similar URL patterns with changing parameters, so you could build a Kibana visualization to display the top 20 URLs:
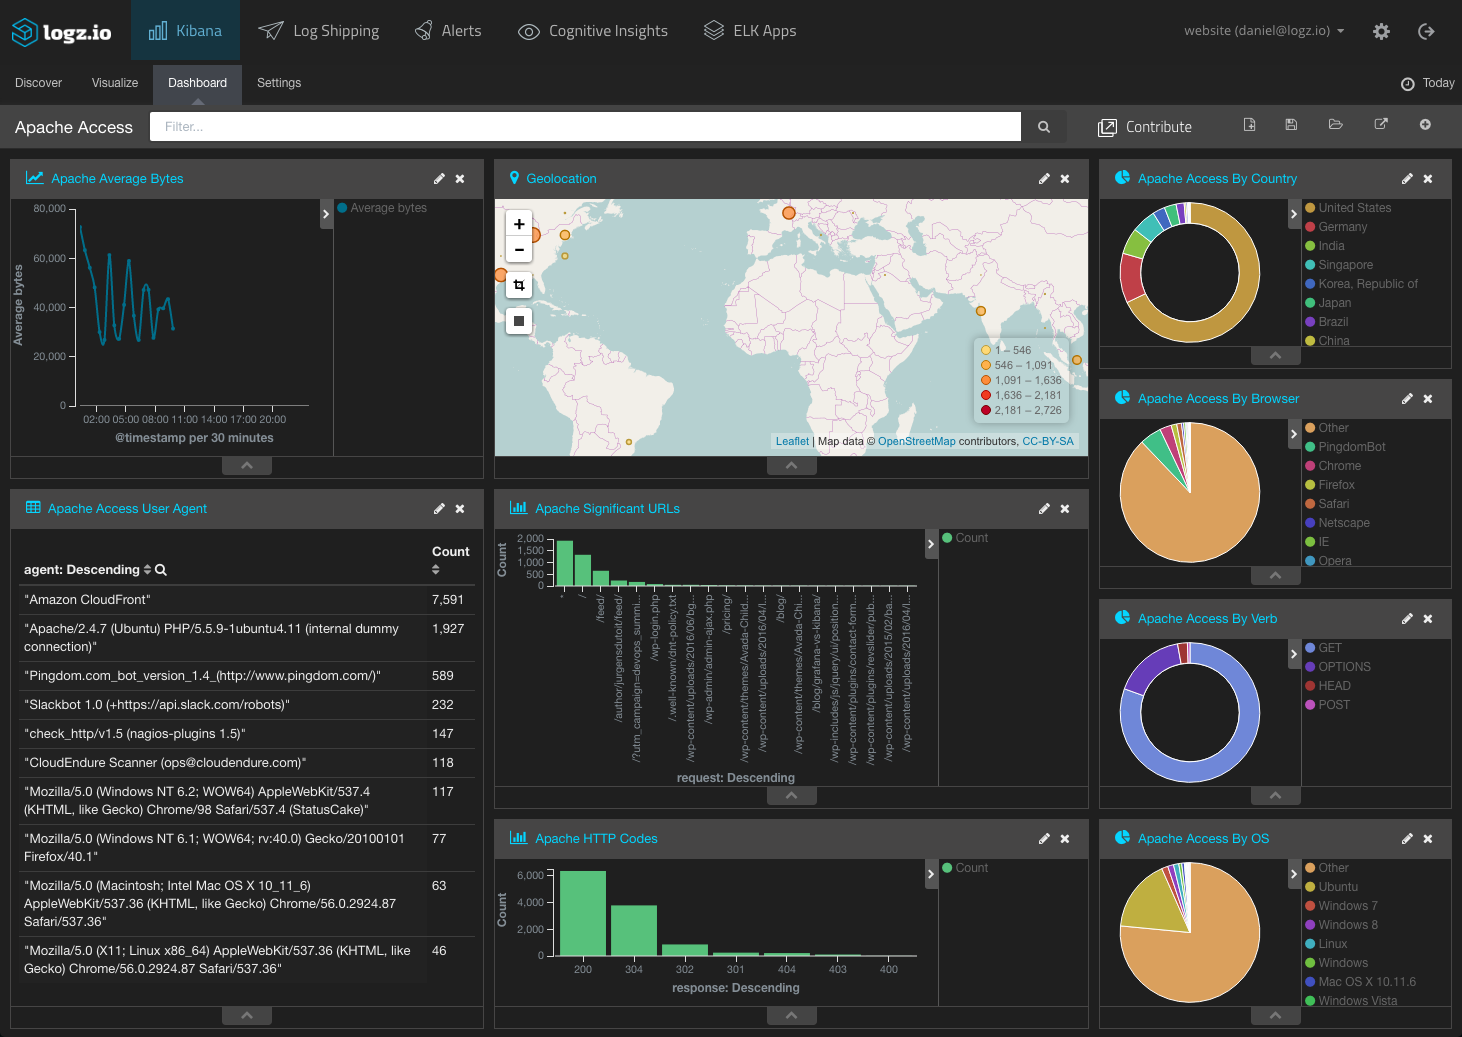
By putting these visualizations together with others to monitor your Apache access logs, you can get a nice overview of the requests being sent to your web server:
This Apache access dashboard is available in ELK Apps — the free Logz.io library of pre-made Kibana dashboards and visualizations.
CDN Traffic
Most websites today use a CDN service for serving their website’s pages to the end-user. Since the CDN routes requests, monitoring logs generated by this waypoint can also be useful for identifying a DDoS attack.
What are some telling signs of attacks that can be monitored?
To start with — and in a similar way to monitoring web servers — tracking bad URLs and error response codes is one method you can use.
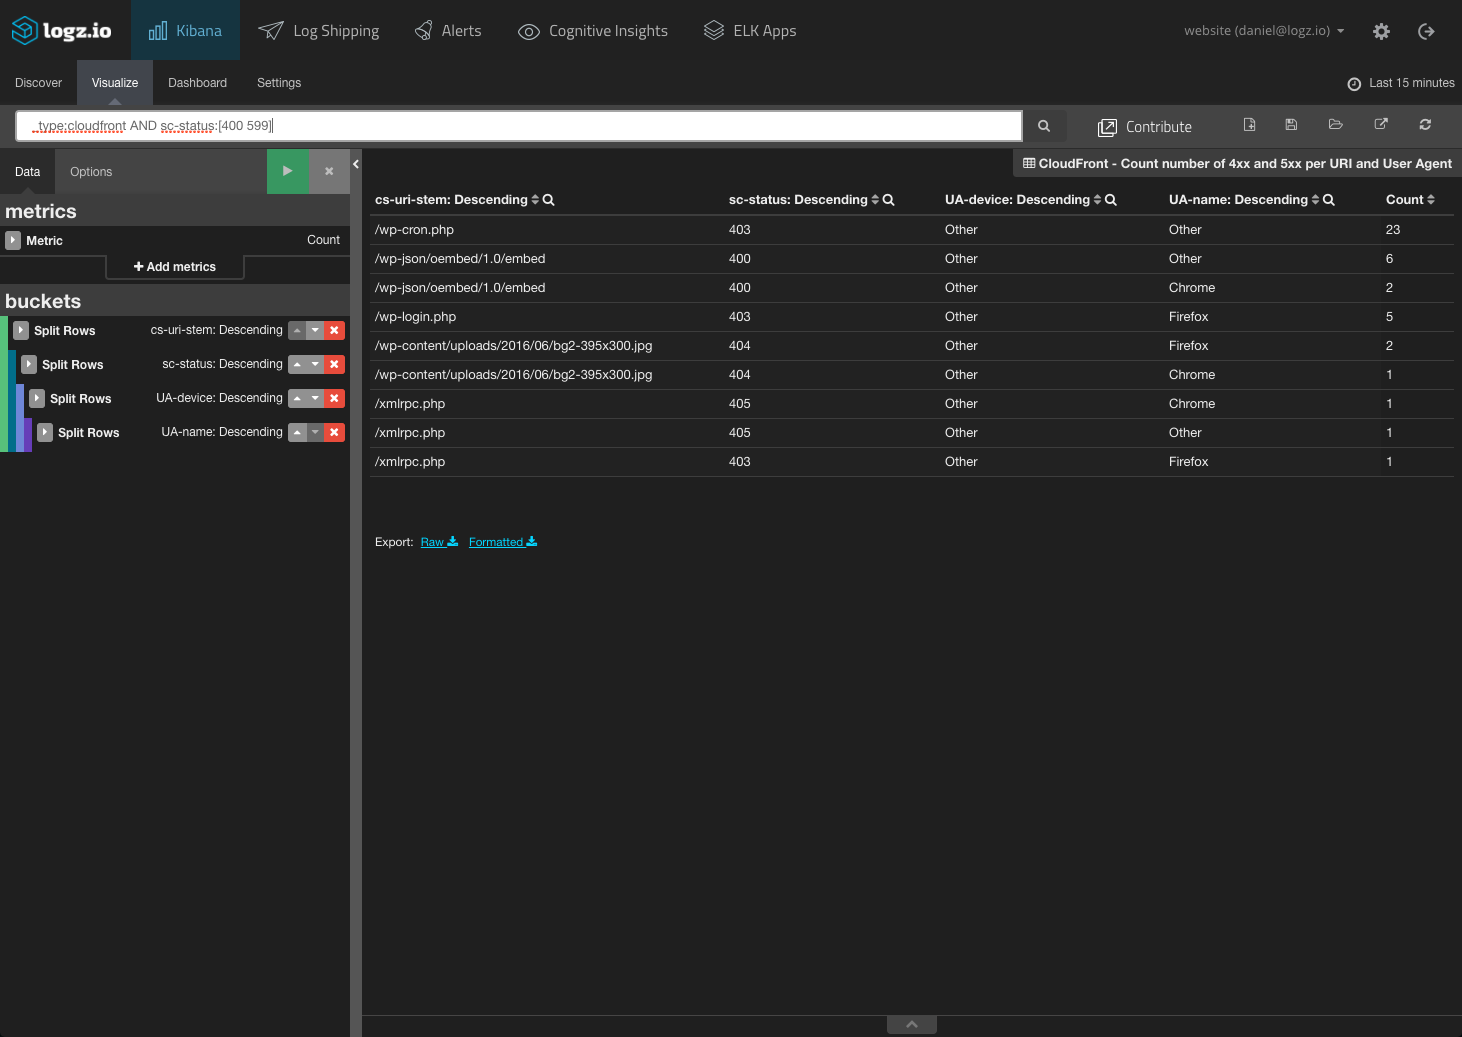
In the visualization below, for example, we are displaying 4xx and 5xx errors per URI and user agent, as reported by a CloudFront CDN:
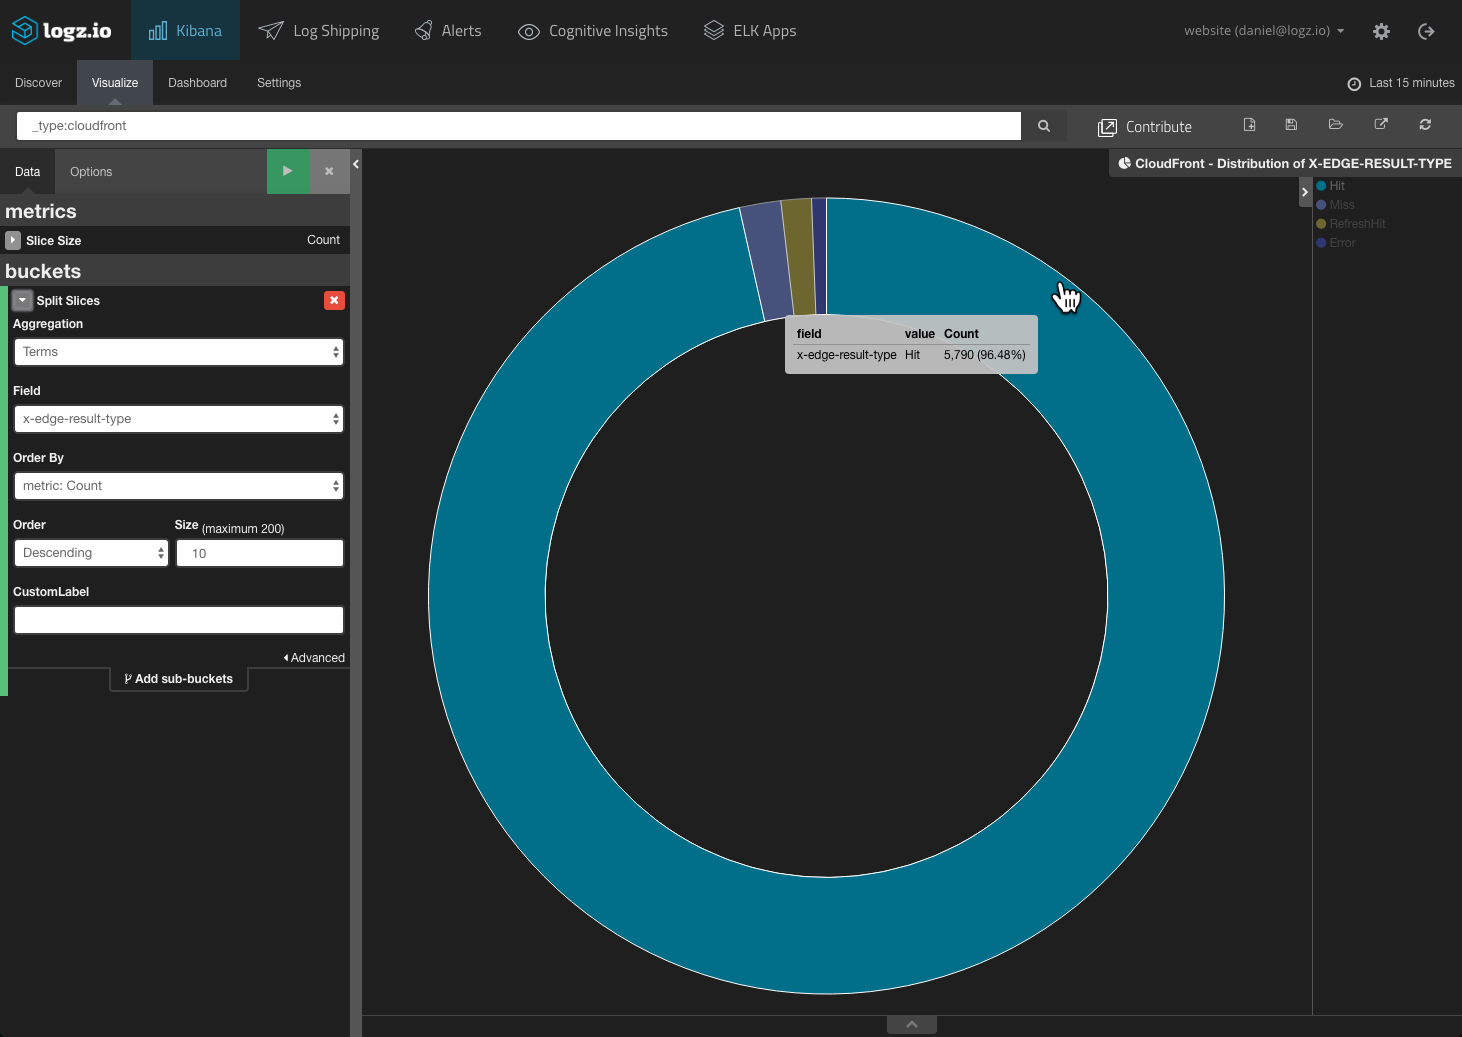
As mentioned above, attacks often involve a surge in bad URL requests. This means that your CDN logs should report a sharp rise in the “miss” rate. So, another useful Kibana visualization is the hit-miss ratio:
Again — configuring an alert that will notify you once a specific threshold is passed can alert you within moments of an attack taking place.
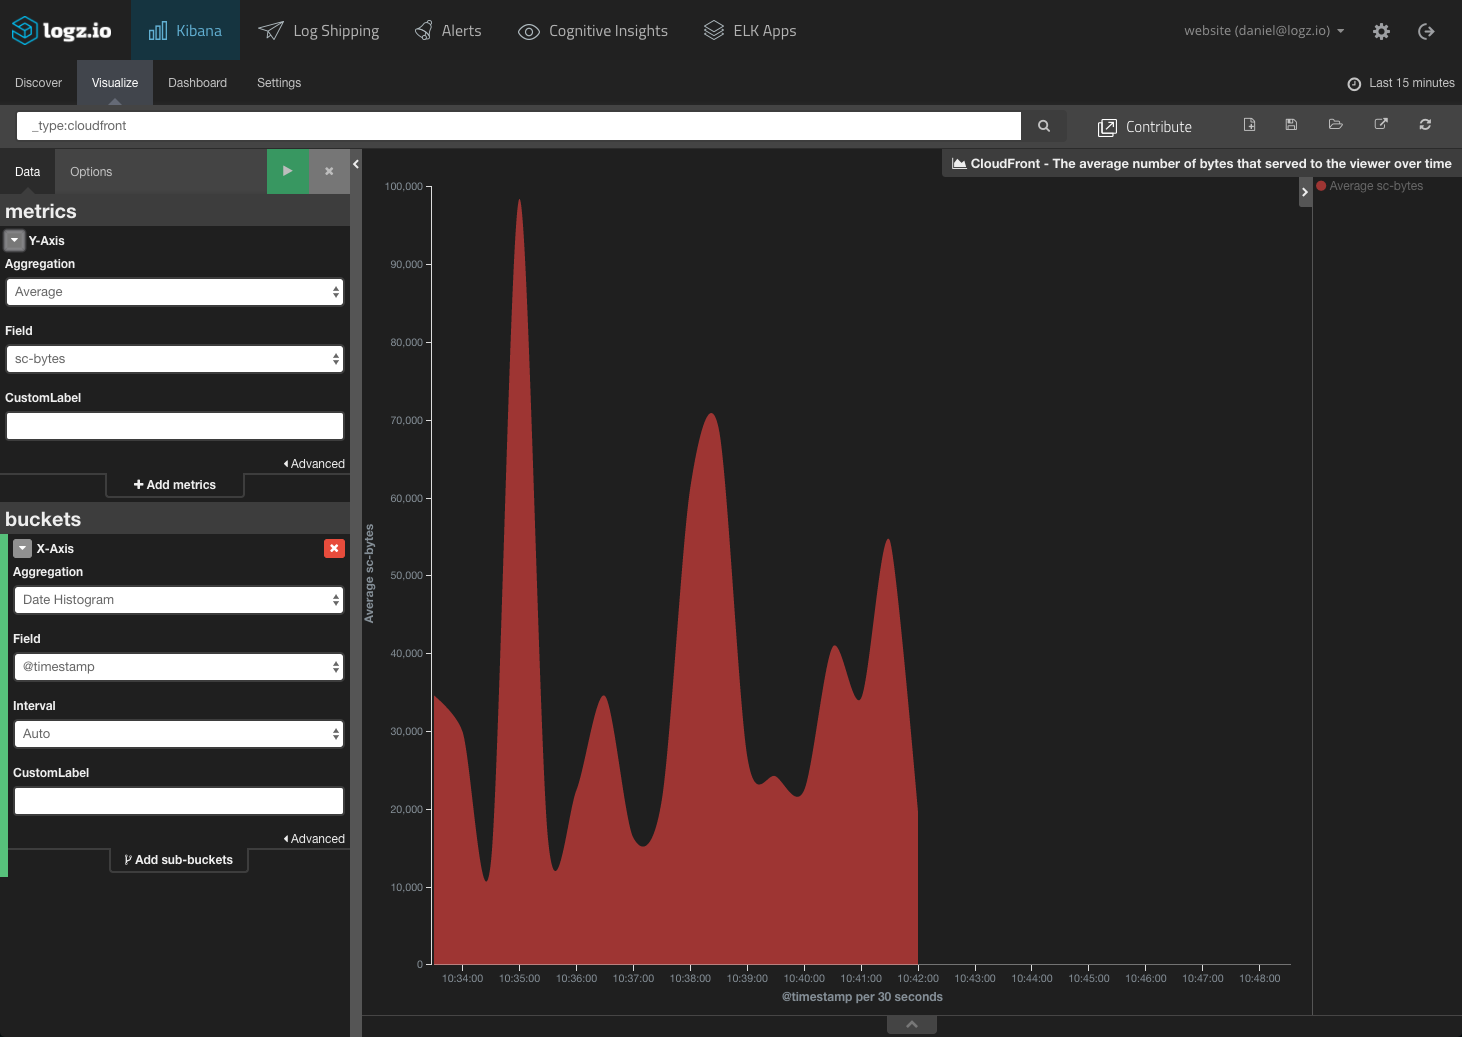
CDNs also report the sizes (in bytes) of incoming and outgoing server requests. So, you can build a visualization that monitors the average amount of bytes served to users over time. A DDoS attack might be taking place if a sudden spike occurs:
A CloudFront dashboard is also available in ELK Apps, the aforementioned free Logz.io library of pre-made Kibana dashboards and visualizations.
Network Traffic
Another method complementing — and, in certain circumstances, taking precedence over — request monitoring is network traffic monitoring. The latter is not only faster because data in the packets passing through the wire is available sooner but also more helpful in identifying small attacks that sometimes pass under the radar when monitoring web server traffic.
You could, for example, monitor the total amount of packets sent through a network at any given time or the number of packets sent and received by a specific IP address.
Again, alerts can be put in place so you are notified when a certain threshold is passed that is based on the average amount of packets sent and received.
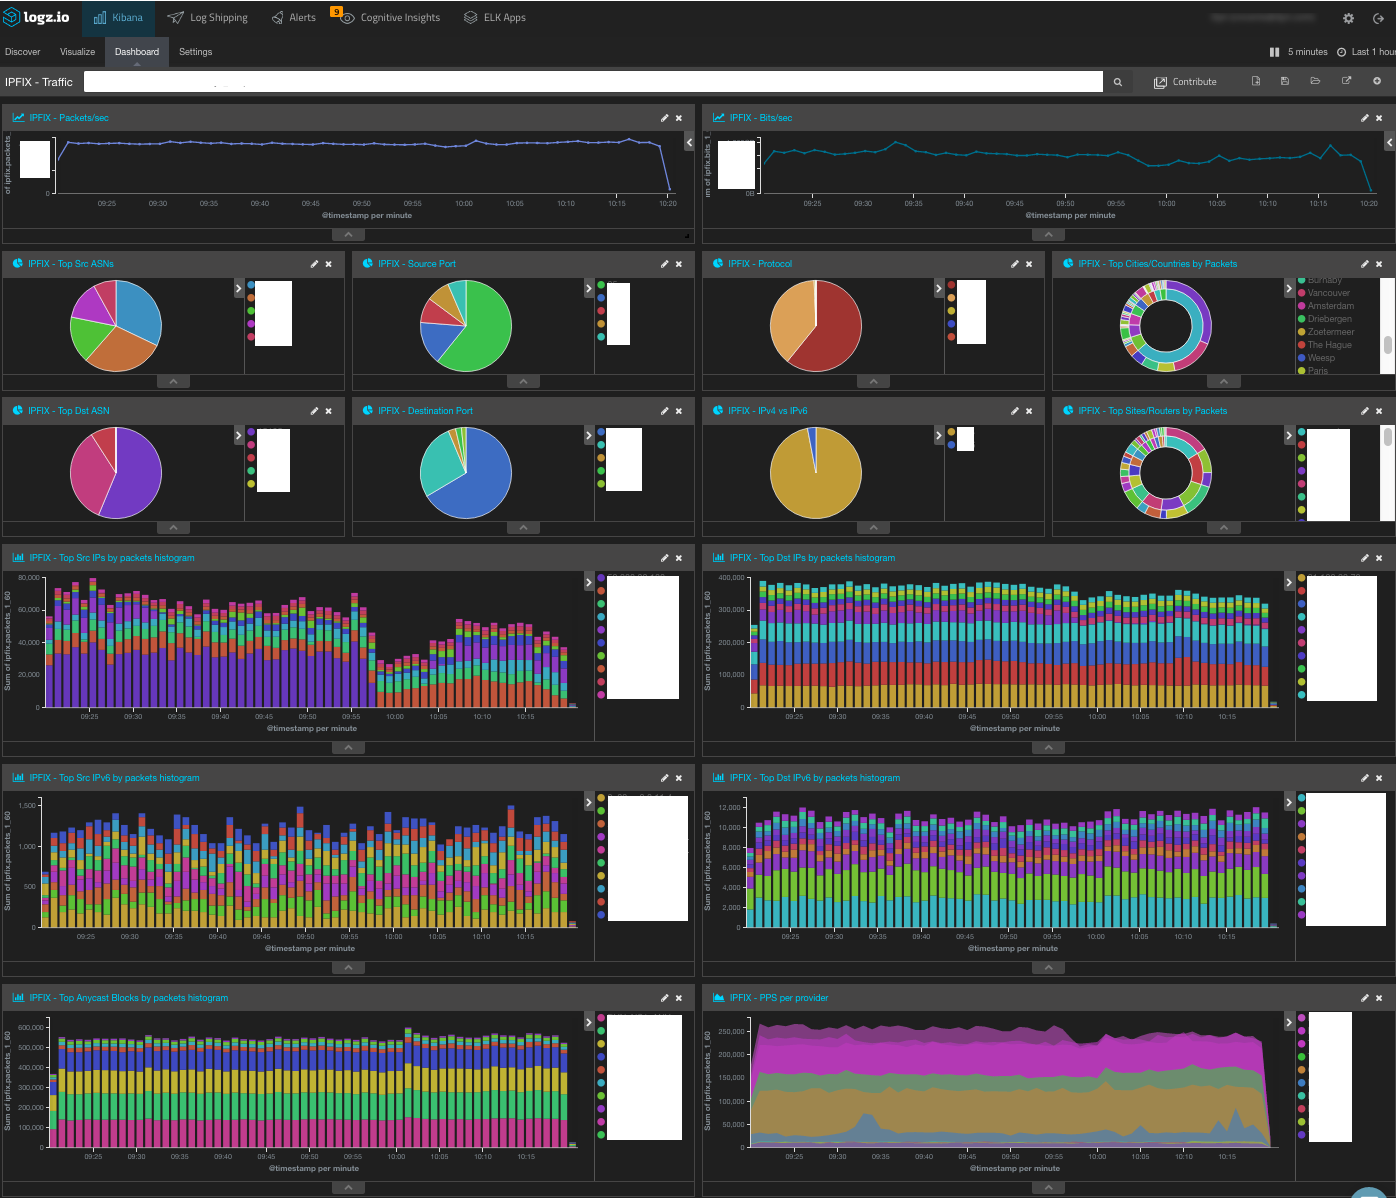
Below is a dashboard for monitoring NetFlow logs (NetFlow is a network protocol for collecting IP and network traffic). Some fields have been redacted for privacy reasons, but as you can see, the dashboard contains detailed visualizations on packet-per-IP trends:
Summary
Any ELK-based anti-DDoS strategy must be based on three main elements — retrieving and parsing the logs from the different layers in your technology stack, creating monitoring dashboards, and defining alert thresholds. The latter is crucial for being able to identify quickly that an attack is taking place.
Of course, if you’re using your own deployment of the ELK Stack, adding alerts is a challenge as an out-of-the-box solution does not exist. You can either add X-Pack or hack your own solution. Logz.io provides an extensive alerting mechanism as part of our service.
More on the subject:
As Akamai reported in Q4 last year (PDF), while the overall number of DDoS attacks didn’t increase during 2016, the size and severity of the attacks did — and there is no reason to believe this trend is about to go away anytime soon. Logging remains one of the most solid methodologies to use to identify these attacks, and ELK is perfectly poised to be your weapon of choice.
