How to Analyze Salesforce Data with the ELK Stack
April 19, 2016
The ELK Stack (Elasticsearch, Logstash, and Kibana) is most commonly used for analyzing log files produced by networks, servers, and applications. Powerful indexing and searching capabilities coupled with rich visualization features make ELK the most popular open-source log analytics platform.
If you’re an IT manager or a DevOps engineer, you’re probably already using ELK to analyze and manage your company’s logs. But ELK is extremely useful in other use cases as well. In a previous post, we described how marketers could use ELK to analyze server logs for technical SEO, and others are using the stack for business intelligence, log-driven development, and various other purposes as well.
This article introduces yet another interesting use case — ingesting data from Salesforce for sales and marketing analysis. If you’re managing your company’s Salesforce account, you also know that analyzing Salesforce data to provide your CEO with insights he can use is not an easy task. This article provides a way to solve this challenge. Specifically, we will be showing how to create a pipeline from a Salesforce account, into Logstash, and then into Logz.io — our ELK as a service platform. Of course, you can perform the same procedure using your own hosted ELK stack.
More on the subject:
By ingesting Salesforce data into ELK, sales and marketing teams can go back in time and perform deep analyses of cross-team metrics. For example, you could measure the performance of your sales representatives overtime or get an overall picture of lead generation efforts and the numbers of closed deals over a specific length of time.
Step 1: Creating a connected app in Salesforce
Before we begin to install and configure Logstash, we need to retrieve some credentials from Salesforce that will allow us to access the data and stream it into Elasticsearch. This involves the creation of a new connected app and the generation of a user token.
In Salesforce, open the Setup page. In the Build section on the left, select Create → Apps.
Here, you’ll see a list of the Apps in your Salesforce organization. In the Connected Apps section at the bottom of the page, click New to create a new connected app:
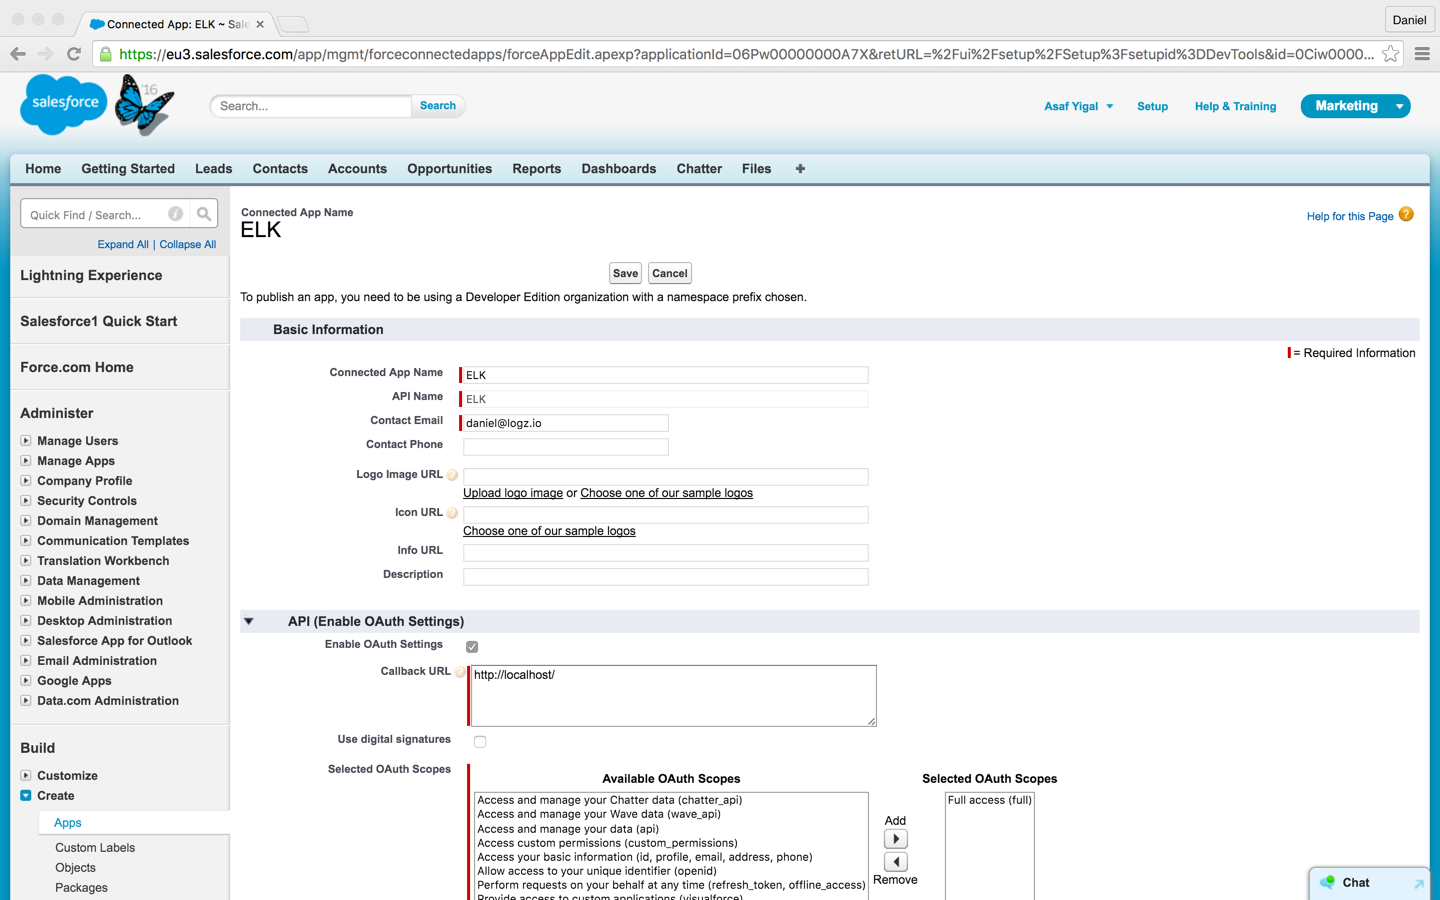
Enter the following information (see the Salesforce documentation for a description of all of the available settings):
- Connected App Name – the name of the new connected app (e.g. ELK)
- API Name – the name of the API to be used by the connecting program (e.g. ELK)
- Contact Email – an email address that Salesforce can use to contact you
Select the Enable OAuth Setting checkbox, and enter the following information:
- Callback URL – You can enter ‘http://localhost/’ since the Logstash plugin will be using password authentication
- Selected OAuth Scopes – Add Full Access (full) to the Selected OAuth Scopes list
When done, click Save. The new app is added and displayed.
Make note of the following fields for use later on when configuring Logstash: Consumer Key and Consumer Secret (click to reveal).
The last piece of the puzzle needed for authentication and for our Logstash configuration is your Salesforce security token. This is given to the administrator of the Salesforce account, but a new token can be created (by the correct user) after resetting it.
Installing Logstash and the Salesforce plugin
We can now begin setting up Logstash.
Logstash, the ‘L’ in the “ELK Stack,” is used at the beginning of the logging pipeline — ingesting and collecting data before sending it to Elasticsearch. Although log files are the most common use case, any other type of event can be forwarded into Logstash and transformed using plugins. We will first install Logstash itself and then the community-maintained plugin for Salesforce.
To install Logstash, first download and install the public signing key:
wget -qO - https://artifacts.elastic.co/GPG-KEY-elasticsearch | sudo apt-key add -
Then, add the repository definition to your /etc/apt/sources.list file:
$ echo "deb http://packages.elastic.co/logstash/2.2/debian stable main" | sudo tee -a /etc/apt/sources.list
Update your system so that the repository will be ready for use and then install Logstash with:
$ sudo apt-get update && sudo apt-get install logstash
Next, install the Logstash plugin for Salesforce:
$ cd /opt/logstash
$ sudo bin/plugin install logstash-input-salesforce
Configuring Logstash
Now that we have the correct packages installed, we need to configure Logstash to receive input from Salesforce and then forward it to Elasticsearch.
Logstash configuration files are written in JSON-format and reside in /etc/logstash/conf.d. The configuration consists of three sections: inputs, filters, and outputs. (This is also discussed in our guide to Logstash plugins.)
Let’s create a configuration file called ‘salesforce.conf’:
$ sudo vi /etc/logstash/conf.d/salesforce.conf
First, enter the input:
input {
   salesforce {
      client_id => 'consumer_key' #Salesforce consumer key
      client_secret => 'consumer_secret' #Salesforce consumer secret
      username => 'email' #the email address used to authenticate
      password => 'password' #the password used to authenticate
      security_token => 'security_token' #Salesforce security token
      sfdc_object_name => 'object' #Salesforce object to track
   }
}
You can track any Salesforce object that you want, but you need to copy the input configuration for each. The most common objects tracked are ‘Opportunity,’ ‘Lead,’ ‘Account,’ ‘Event,’ and ‘Contact.’ Check the list of available Salesforce API objects to see what objects can be ingested by the Logstash plugin.
By default, the input will ingest all of the available fields for the Salesforce object that you had selected. You have the option to define the specific fields that you would like to see with the ‘sfdc_fields’ parameter:
sfdc_fields => ['Id','Name','Type']
For a full list of the available parameters for this Logstash plugin, see Elastic’s documentation.
Next, enter a filter as follows (enter your Logz.io token in the relevant placeholder):
filter {
   mutate {
      add_field => { "token" => "<yourToken>" }
      add_field => { “type” => “SalesForce” }
   }
}
The filter, in this case, is adding two fields to our messages — one is our Logz.io token, and the other a type field called ‘SalesForce.’ This will help to differentiate the data coming from Salesforce from other input sources.
Last but not least, define the output to Logz.io as follows:
output {
   tcp {
      host => "listener.logz.io"
      port => 5050
      codec => json_lines
     }
}
If you were using your own Elasticsearch instance, you would need to define the output accordingly:
output {
   elasticsearch {
      index => "salesforce"
      index_type => "lead"
      host => "localhost"
   }
}
That’s it. Once you’re done, restart Logstash:
$ sudo service logstash restart
Salesforce data should begin to show up in the Kibana interface integrated into Logz.io almost immediately (if not, double-check the credentials that you had used in the Logstash configurations. Those are crucial for connecting to Salesforce).

Analyzing the data
Once the data is indexed in Elasticsearch and displayed in Kibana, you can begin to analyze it.
If you’re pulling data from various input sources, your first step is to isolate the data from Salesforce. Use this simple search query that will isolate all of the messages coming into your system with the ‘SalesForce’ type:
type:SalesForce
Your next step is to figure out what information you’d like to inspect and visualize. Of course, how you analyze the data depends on your objectives and the specific Salesforce object that you’ve decided to track.
In this specific configuration, we’ve ingested existing data for the Salesforce “Lead” object. So, say you’d like to see a visualization that depicts the status of your leads. Cross-reference the above-saved search with the ‘status’ field to create a new pie-chart visualization:


Or, you could create a bar chart that shows the number of conversions over time (cross-reference the search with the ‘ConversionDate’ and ‘IsConverted’ fields):
The sky’s the limit. Once you have a few visualizations lined up in Kibana, combine them into one comprehensive dashboard that you can use to see how your sales and marketing teams are performing.
That wasn’t hard, was it?

You Might Also Like

Announcing Service Performance Monitoring in Early Access