
MySQL Log Analysis with the ELK Stack
No real-world web application can exist without a data storage backend, and most applications today use relational database management systems (RDBMS) for storing and managing data. The most commonly used database is MySQL, which is an open-source RDBMS that is the ‘M’ in the open-source enterprise LAMP Stack (Linux, Apache, MySQL and PHP).
Middle- or large-sized applications send multiple database queries per second, and slow queries are often the cause of slow page loading and even crashes. The task of analyzing query performance is critical to determine the root cause of these bottlenecks, and most databases come with built-in profiling tools to help us.
In the case of MySQL, one useful method is to analyze the logs. Queries that take longer to process than a predefined length of time will be logged in the MySQL slow query log. The error log also contains useful information, reporting when MySQL was started or stopped and when critical errors occurred. But as with any type of log data — log analysis and management are tasks that challenge even the most experienced of teams, especially in enterprise production environments that produce log files containing thousands of entries every day.
More on the subject:
This is the reason why more and more companies are choosing the open source ELK Stack (Elasticsearch, Logstash, and KIbana) as their log analysis platform. It’s fast, it’s free, and it’s simple.
This tutorial will describe how to ship and analyze MySQL logs using Logz.io, our predictive, cloud-based log management platform that’s built on top of the ELK Stack, but you can follow the steps in the tutorial with any on-premise installation of the ELK Stack as well.
Note: The method described for shipping the logs to Logz.io includes the use of rsyslog. There are alternative methods as well, such as using a Docker image or using Filebeat. More on these methods in upcoming articles.
Prerequisites
- A common Linux distribution with TCP traffic allowed to port 5000
- An active Logz.io account. If you don’t have one yet, you can create a free account here
- 5 minutes of free time!
Step 1: Setting up your environment
The first step will help you to install the various prerequisites required to ship logs to Logz.io.
Installing MySQL
If you’ve already got MySQL installed, you can skip to the next step. If not, enter the following command to update your system:
$ sudo apt-get update
And then install MySQL:
$ sudo apt-get install mysql-server
During installation, you’ll need to set the root password. Make note of it, as you’ll be needing it in the following steps.
Installing Rsyslog
Most Unix systems these days come with rsyslog pre-installed, but even so, make sure your installed version complies with Logz.io’s minimal requirement (version 5.8.0 and above):
$ rsyslogd -version
If Rsyslog is not installed or you have an old version, enter the following commands to install version 8:
$ sudo add-apt-repository ppa:adiscon/v8-stable

$ sudo apt-get install rsyslog
Installing cURL
The Logz.io automatic installation script uses cURL, so you will need to install it before continuing:
$ sudo apt-get install curl
Step 2: Shipping logs to Logz.io
Our next step is to set up the shipping pipeline into Logz.io.
Configure MySQL to write log files
First, we need to configure MySQL to write general and slow query log files because those configurations are disabled by default. Then, we need to set the threshold for creating logs.
To do this, first open the ‘my.cnf’ configuration file:
$ sudo vim /etc/mysql/my.cnf
Next, uncomment and edit the following lines:
general_log_file = /var/log/mysql/mysql.log
general_log= 1
log_slow_queries = /var/log/mysql/mysql-slow.log
long_query_time = 1
log-queries-not-using-indexes = 1
Be sure to restart MySQL after making these changes:
$ sudo service mysql restart
Creating some logs
Let’s create some MySQL logs by using sample data. Clone this GitHub repo (you’ll need Git installed), cd into it, and install the database data:
$ git clone https://github.com/datacharmer/test_db.git

$ cd test_db

$ mysql -uroot -p < employees.sql
To create some slow query logs, access MySQL, select the ‘employees’ database, and use the following query:
> SELECT * FROM employees;
Running the installation script
We’re now going to run the Logz.io automatic installation script for MySQL logs:
$ curl -sLO https://github.com/logzio/logzio-shipper/raw/master/dist/logzio-rsyslog.tar.gz && tar xzf logzio-rsyslog.tar.gz && sudo rsyslog/install.sh -t mysql -a "<yourToken>"
Remember to insert your token (which can be found in your settings within the Logz.io user interface).
The script assumes the following locations for the MySQL log files, but they can be overridden:
- General log – /var/log/mysql/mysql.log (use –generallog to override)
- Slow queries log – /var/log/mysql/mysql-slow.log (use –slowlog to override)
- Error log – /var/log/mysql/error.log (use –errorlog to override)
Step 3: Analyzing the logs
Our slow query event will show up in Kibana after a few seconds:
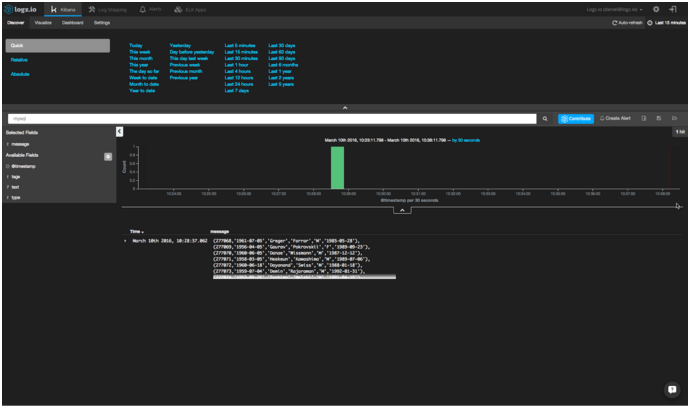
To make sure that the shipping pipeline is working correctly, search for MySQL log file types in Kibana: ‘mysql’, ‘mysql_error’ and ‘mysql_slow_query’.
Once your logs have arrived, you can begin to use Kibana to query Elasticsearch, filter the logs based on your needs, and save your searches to create visualizations.
Creating alerts for slow queries
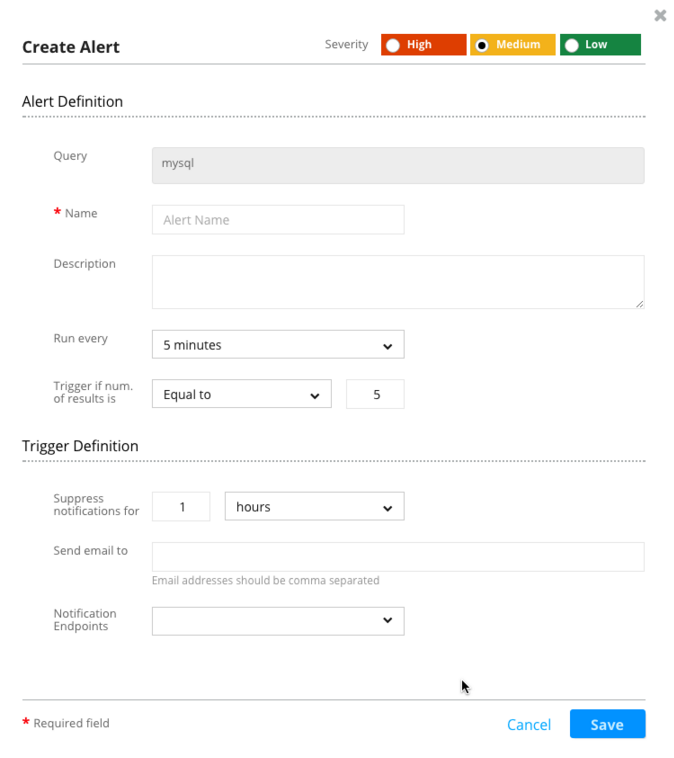
Setting up an alert for slow MySQL queries is a great way to become proactive in analyzing performance. Logz.io allows you to configure an alert that will automatically send you a notification by either email or any application that can use Webhooks (e.g., Slack, JIRA, etc.).
To set an alert for a specific event, use search and filtering to narrow down to the relevant log and click the “Create Alert” button in the top-right corner.
Your Elasticsearch query is already loaded in the alert settings, and all that’s left for you to do is to decide the threshold for when you want to receive a notification and via what method you will receive it. Read more about creating alerts here on our blog.
Installing a MySQL dashboard
Logz.io allows you to install pre-made visualizations and dashboards easily from the ELK Apps tab. There are currently 15 apps for MySQL logs you can use — just search for “MySQL” and select the app that is most relevant for your environment:
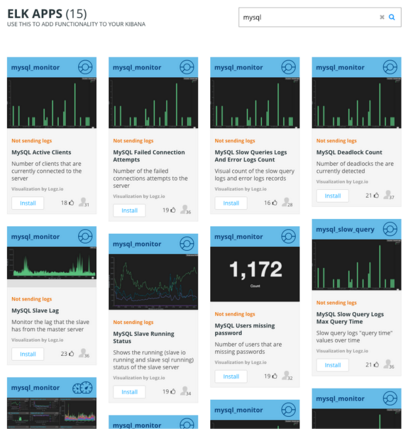
One useful app is the mysql_monitor — it is a dashboard app that will load a complete set of visualizations to help you to monitor your MySQL logs.
Of course, you’ll need to ship a larger amount of logs to really enjoy these visualizations and dashboards. So, what are you waiting for?

You Might Also Like

Auto-Instrumenting Python Apps with OpenTelemetry

Retry Dynamic Imports with “React.lazy”
Get started for free
Completely free for 14 days, no strings attached.
