
Reduce MTTR with Logz.io’s Single-Pane-of-Glass Observability Data Analytics
January 25, 2023

Observability data provides the insights engineers need to make sense of increasingly complex cloud environments so they can improve the health, performance, and user experience of their systems. These insights can quickly answer business-critical questions like, “what is causing this latency in my front end?” Or, “why is my checkout service returning errors?”
Observability is about accessing the right information at the right time to quickly answer these kinds of questions. Engineers can use observability data — including logs, metrics, and traces — to assemble information about the current state of their environment, like assembling pieces of a puzzle.
But this isn’t always trivial. As my colleague Dotan Horovits aptly put it last year, observability is a data analytics problem.
Blockers to observability data analytics can have a direct impact on mean-time-to-resolution (MTTR) for production issues, which can translate to interrupted digital experiences for customers (which is often synonymous with revenue loss in the digital world).
This piece will examine common observability data analytics challenges that prevent engineers from gathering this information — as well as how Logz.io helps overcome these blockers.
A Common Pitfall for Observability Data Analytics
When an alarm sounds off indicating a production incident, every second counts as engineers begin to scan their telemetry data to assemble the puzzle pieces describing the issue. Resolving the problem is largely a question of how fast engineers can narrow down their observability data to complete the puzzle.
At small scales, this can be done relatively easily and cheaply with open source observability tools — like OpenSearch, Prometheus, Grafana, and OpenTelemetry. But as businesses grow, common observability data analytics challenges can impact MTTR.
When more services are added, customer traffic increases. Cloud workloads expand and observability data volumes will only grow larger, burying the critical insights engineers need to reduce MTTR. Plus, growing cloud workloads will often require more engineering teams, who will install different observability tool sets according to their preferences.
As a result, business growth can often lead to enormous observability data volumes distributed across sprawling tool sets, which silo the critical observability insights needed to identify the root cause of production issues.
In this common situation, troubleshooting requires constant switching across different interfaces and contexts to manually query the data — prolonging incident investigations that require quickly connecting the dots across logs, metrics, and traces.
This challenge is exacerbated by microservices architectures, which are made up of many separate, yet interdependent, components. Troubleshooting microservices requires engineers to correlate different information from many components to isolate issues within complex application requests.
Unified data analytics, data correlation, and machine learning-assisted search can help engineers overcome analysis challenges and reduce MTTR for production issues.
Logz.io’s Single-Pane-of-Glass Analysis, Assisted by ML
Logz.io unifies log, metric, and trace data analytics so engineers can paint a full picture of production health and performance in one place — reducing MTTR. It’s the only observability platform that provides a centralized telemetry analytics experience using the most popular open source monitoring tools — including OpenSearch, Prometheus, OpenTelemetry, and Jaeger.
Beyond bringing the data together under the same hood, Logz.io users can correlate their data, which automatically presents the most relevant information needed to troubleshoot a problem. Let’s look at some examples.
Correlating infrastructure performance data
In our first example, we’ll start with an overview of our Kubernetes performance metrics, and quickly correlate to the relevant logs that can explain worrisome trends in the metrics.
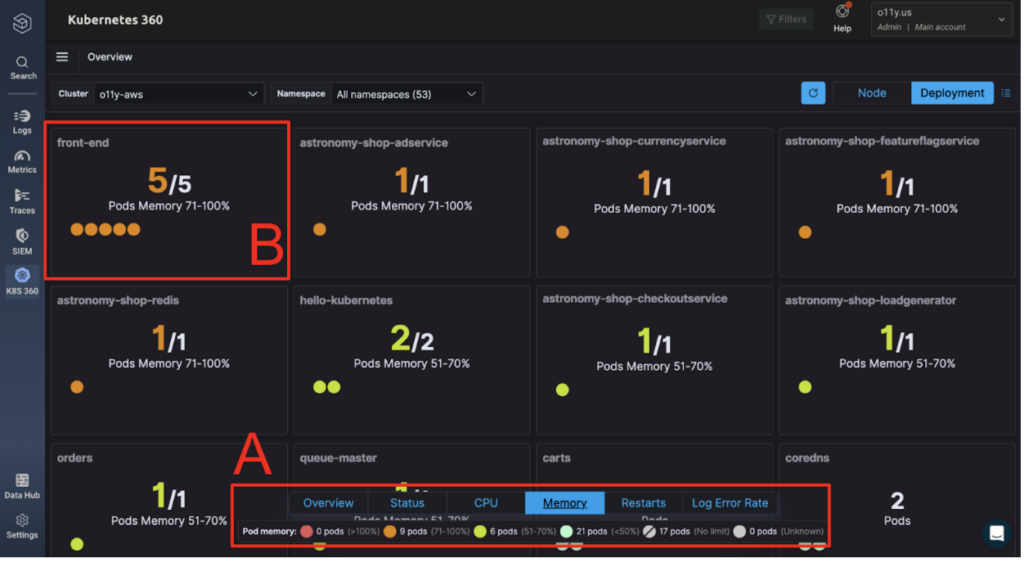
We’ll start with Kubernetes 360, Logz.io’s out-of-the-box dashboard that unifies Kubernetes health and performance data. After sending Kubernetes data to Logz.io, Kubernetes 360 will automatically populate to highlight key performance metrics.
The screenshot below shows a view of pod memory per microservice — with the option to quickly pivot across other critical metrics like CPU, pod restarts, pod failures (status), and error rates (box A). The engineer’s attention is immediately brought to the urgent issues — like the five pods with growing memory usage in box B.
By clicking on a pod, we can see the logs generated by that pod in the same timeframe – shown in box C – which allows us to effectively correlate the information from our metrics (high memory) with the associated logs (which indicate specific errors).
By immediately pulling up the relevant troubleshooting information after spotting an issue, engineers can quickly pinpoint the root cause of issues to reduce their MTTR.

While being able to pull up the relevant logs in seconds can simplify and accelerate troubleshooting, there are other ways we can analyze these logs for deeper analysis.
First, we can hit ‘Live Tail’ (box C), which shows logs coming into Logz.io — so we can monitor the data and observe changes in real time.
Or, if we wanted to query this data, we can also hit ‘See logs’ (box C), which takes us to the log analytics interface. From here, we can add filters to narrow our search (box D), use ML-assisted search to quickly highlight the critical data (box E), or create alerts to trigger notifications if the alert finds specific log data in the future (box F).
My personal favorite application of machine learning is the Exceptions tab, which automatically highlights critical application exceptions that could otherwise get lost in a sea of log data.

Correlating business metrics with back-end performance data
In this next example, we’ll be monitoring our services within an eCommerce application — and quickly isolate the root cause of the problem through data correlation.
In the image below, we’re monitoring our Orders microservice: queries per second on the left and average request latency on the right. We can see troubling trends in both visualizations: 4xx/5xx response codes are jumping while average latency spikes.
These metrics indicate a symptom of the issue, but we need trace data to quickly pinpoint the root cause within our microservices. To do this immediately, we can click ‘Explore related traces’ (box G) to see the relevant trace data that can explain what we’re seeing.

This brings us to all the traces that pinged the Orders service during that same time period. After opening a trace, we can visualize the entire lifecycle of an application request. Distributed tracing shows us which service executed each operation in chronological order (box H) — while showing the latency of each operation within the application request (trace map).

Unsurprisingly, we see the operations executed by the Orders service took five seconds, which is far too long in the world of eCommerce. But the trace also shows the request pinging the Payments service, which is showing even more startling latency at nine seconds per operation.
After opening up the ‘span’ that represents the operation, we can see an exception log tied to the span (box I). It looks like a dev URL was added in production — blocking payments from being executed.

While we originally found the issue in our Orders service, the trace showed us the root cause of the problem was coming from our Payments service. Without data correlation, this would have required time-consuming querying and context-switching across separate tool sets — delaying our response to the problem and prolonging the issue impacting our customers.
This is the power of data correlation.
When we can immediately surface the data with the relevant insights, we can reduce MTTR to minimize revenue-losing incidents, while delivering a better customer experience.
Getting Started with Logz.io’s Observability Data Analytics and Correlation
In addition to unifying log, metric, and trace analytics, Logz.io also unifies the data collection.
Logz.io’s Telemetry Collector is a OpenTelemetry-based agent that collects logs, metrics, and traces in a single deployment — which can be configured within Logz.io and installed in under three minutes. Read the tutorial to collect your data with Telemetry Collector.
After sending your data, Logz.io handles the entire data infrastructure and scaling for you, while providing out-of-the-box data processing, storage, and monitoring dashboards. As a result, getting started takes minutes — start a free trial to start correlating your telemetry data.

You Might Also Like

Logz.io Moves to Embrace OpenSearch at the Core of its Platform

