
Monitoring Magento Visitor Logs with the ELK Stack

Magento is a powerful eCommerce platform written in PHP that provides merchants with an online shopping cart system. According to w3tech, Magento is the fourth most popular PHP-based CMS in use, trailing after general-purpose platforms WordPress, Joomla, and Drupal.
Magento ships with common e-commerce features such as shopping carts and inventory management and allows site administrators to customize their stores completely to support different business needs. Magento also has a powerful logging system that tracks user activity. The generated event logs can be used to analyze customer behavior, but the main challenge is to aggregate the logs in one centralized platform and quickly get actionable insights.
The ELK Stack (Elasticsearch, Logstash, Kibana) can be used to analyze the large volume of logs that are generated by Magento. Once collected by Logstash and stored in Elasticsearch, these logs can be analyzed in real time and monitored using Kibana’s rich visualization features.
This post will introduce you to Magento logging and describe how to establish a pipeline of visitor logs into the Logz.io ELK Stack.
Enabling Magento visitor logs
Magento provides two types of logging systems out-of-the-box, one for development purposes and the other for tracking visitor activity in the its online store.
The Magento development logging framework is used by developers to log Magento system errors and runtime execution exceptions, so it is not the focus of this article. Magento visitor logging enables site admins to track user logs and provides details on a customer’s activity such as login and logout time, the devices used by the customer, and the specific stores visited by the customer.
The first step is to enable visitor logging in your Magento store. Access the Magento admin panel interface, and go to System -> Configuration:
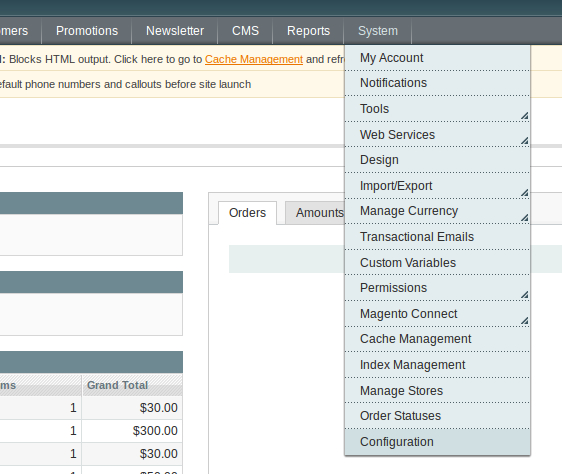
Under the Advanced section, select System from the menu:
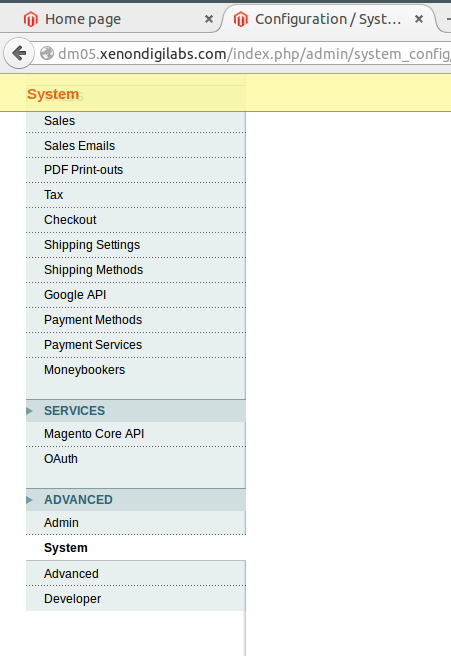
Magento will now display advanced system settings. In the Log section, set the value for “Enable Log” to “Yes.” Save the configuration.
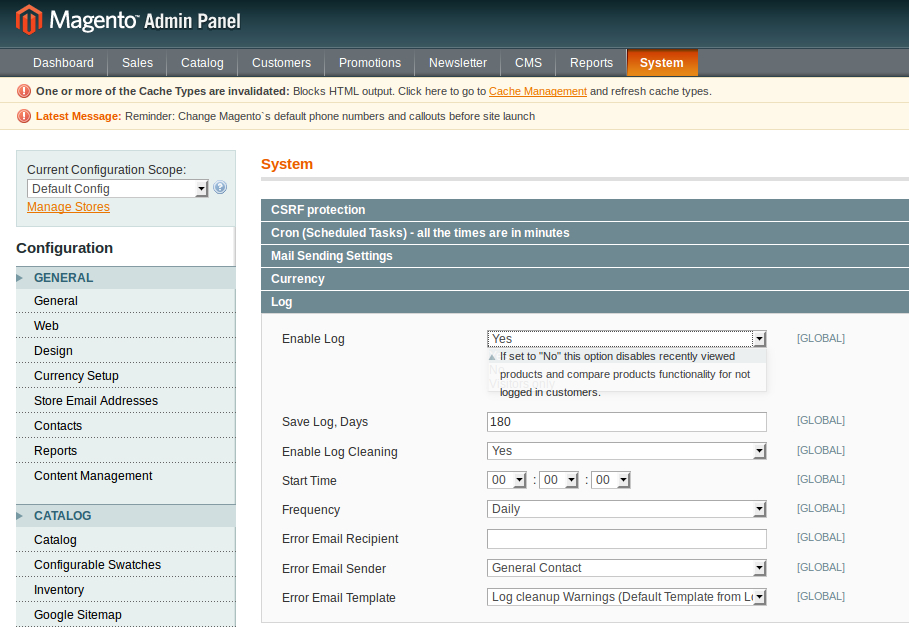
From this point onwards, visitor logs will be generated whenever a user visits the Magento store. As specified above, these logs include information about user login and logout times, customer IDs, the devices used to access the store, store IDs, and more.
These logs are stored in the MySQL database that you had provided when you had set up Magento. If you explore the database, you will find the following tables for logging purposes:
- log_customer – information about customer login/logout times and dates
- log_visitor – information about visitor sessions
- log_visitor_info – visitor location information such as IP addresses and time zones
- log_visitor_online – date and time of the first and last visit as well as the last visited URL
- log_summary – visitor summary report by a date
- log_summary_type – summary types and descriptions
- log_url – visited URLs for each visitor
- log_url_info – information about visited URLs
- log_quote – contains quotes history by visitors
- index_event – events that occurred for products and catalogs
- report_event – history of visitor and customer actions in stores
- report_viewed_product_index – history of viewed products
- report_compared_product_index – history of compared products
- catalog_compare_item – compared products by customer
- dataflow_batch_export – history of batched exports
- dataflow_batch_import – history of batched imports
As an example, access your MySQL database and run the following query:
Select * from log_customer;
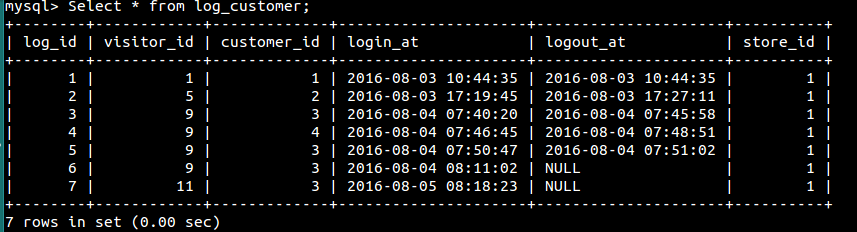
Collecting logs with Fluentd
The next step is to collect the logs using Fluentd, a log collector that aggregates, parses, and forwards logs to an output destination of choice.
There are a number of requirements necessary here before we start.
First, you will need Fluentd running on your system.
Next, you will use a Fluentd MySQL plugin to connect with the database and retrieve visitor logs.
Install the plugin by running the following command:
fluent-gem install fluent-plugin-sql --no-document
We will also need to install the mysql2 adapter because it is a requirement for the Fluentd MySQL plugin. To install use:
fluent-gem install mysql2
Next, we’re going to configure our Fluentd configuration file at /etc/td-agent/td-agent.conf:
<source>
   @type sql

   host <your host>
   adapter mysql2
   database Magento  # your Magento database
   username <mysql username>
   password <mysql password>

   select_interval 4s  # optional
   select_limit 500     # optional

   state_file /tmp/sql_state  # ath to a file to store last rows

   <table>
      table logzio_logs  # table to get data from
      update_column visit_time  # column to track the update
      time_column visit_time
      tag Magento_logs
   </table>
</source>
Enter your MySQL credentials in the file.
Please note that as a table name, we have provided the name of a table that does not exist yet: logzio_logs.
That’s our next step, but instead of creating a table called logzio_logs, we will create a table view with the data from our Magento logs:
create view logzio_logs as select * from log_customer NATURAL JOIN log_url natural join log_visitor natural join log_visitor_info;
Streaming Logs from Fluentd to Logz.io
We’ve collected the logs from MySQL, and the only missing piece is to ship them to ELK.
To stream logs from Fluentd to the Logz.io ELK stack, you will need to install the Fluentd Logz.io output plugin:
gem install fluent-plugin-logzio
We will now update the Fluentd configuration file at /etc/td-agent/td-agent.conf:
<source>
   @type sql

   host <your host>
   adapter mysql2
   database Magento  # your Magento database
   username <mysql username>
   password <mysql password>

   select_interval 4s  # optional
   select_limit 500     # optional

   state_file /tmp/sql_state  # ath to a file to store last rows

   <table>
      table logzio_logs  # table to get data from
      update_column visit_time  # column to track the update
      time_column visit_time
      tag Magento_logs
   </table>
</source>

<match Magento_logs>
      type logzio
      endpoint_url https://listener.logz.io:8090?token=< your Logz.io token >
</match>
After saving the configuration file, restart Fluentd. If all goes as expected, Fluentd will start streaming data from your database into the Logz.io ELK stack.
Open Kibana to view the data:
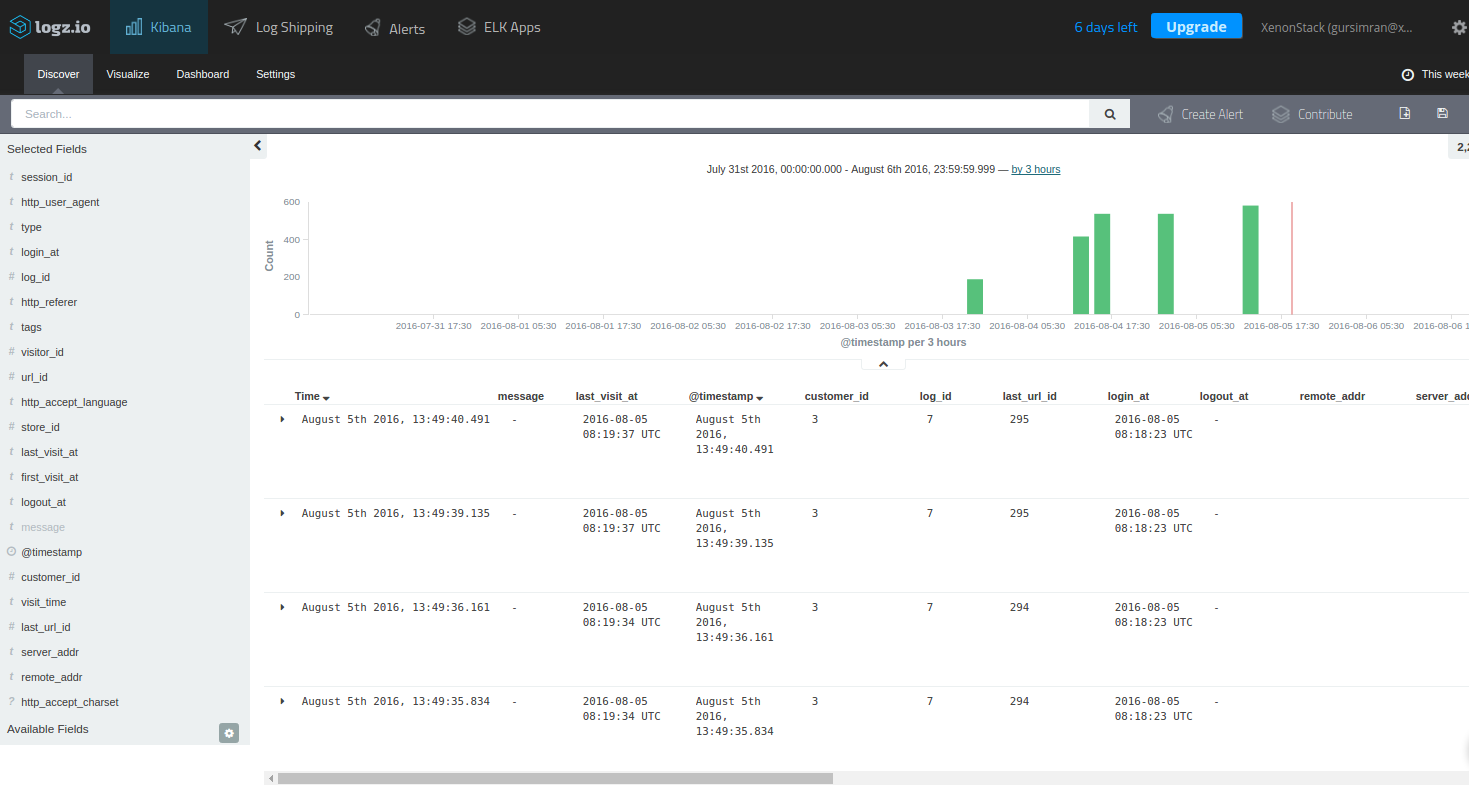
Visualize visitor logs in Kibana
Great! We’ve got the Magento visitor logs stored in ELK. What now?
The next step is to begin to analyze the data. Kibana has extensive querying capabilities including field-level and full-text search, regular expressions, and logical statements. You can use the fields listed on the left to get more insight into the logs and understand how they are indexed in Elasticsearch.
Once you’ve pinpointed the data in which you are interested, the next step is to visualize it. Below are a few examples of how to visualize Magento visitor logs.
Number of visits
The most obvious place to start is to visualize the number of visits made by customers per day.
More on the subject:
In Kibana, select the Visualize tab and then the Line Chart visualization type. Under Buckets for the X-axis, select the Terms aggregation using the last_visit_at field. You can also select the order (Top or Bottom) and size (how many records to visualize). Here is the configuration:
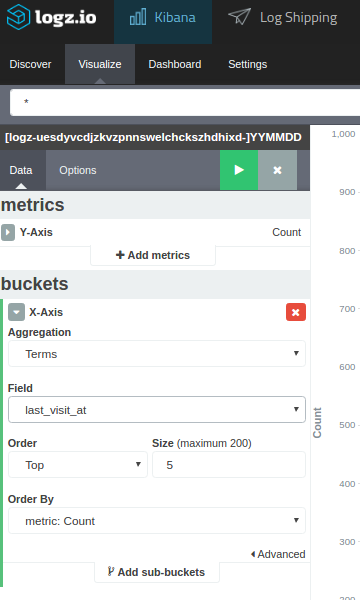
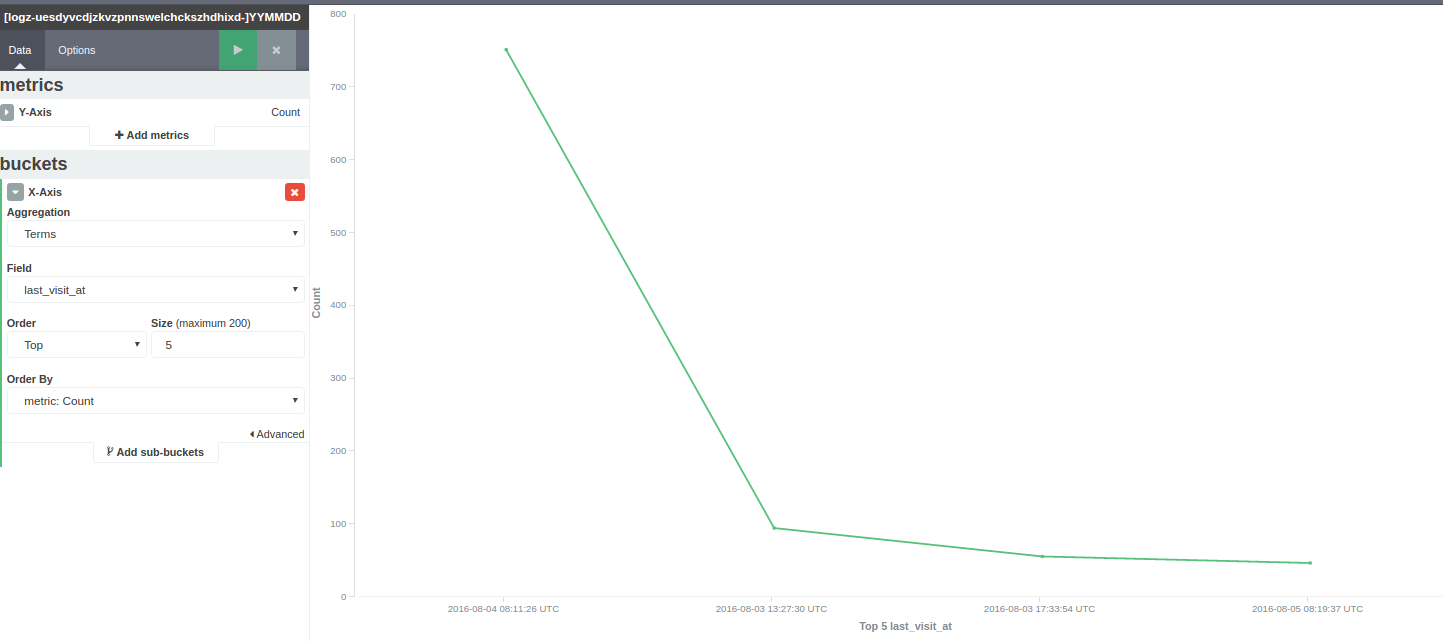
Hit the green play button, and you will see the line chart showing user visits over time:
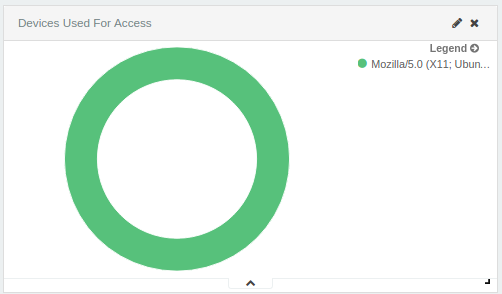
Users by device
Another option is to visualize the devices used by users, this time using the pie chart visualization.
Again, select the Visualize tab and then the pie chart visualization type. This time, we’re going to use the Terms aggregation using the http_user_agent field:
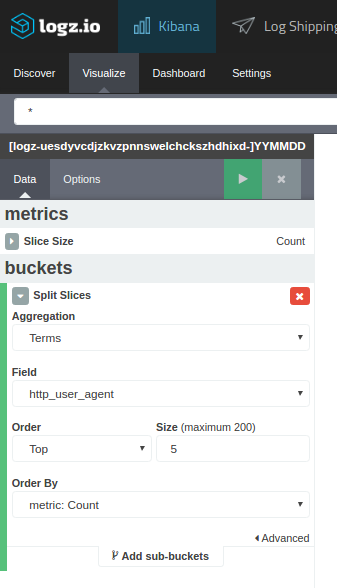
And the visualization:
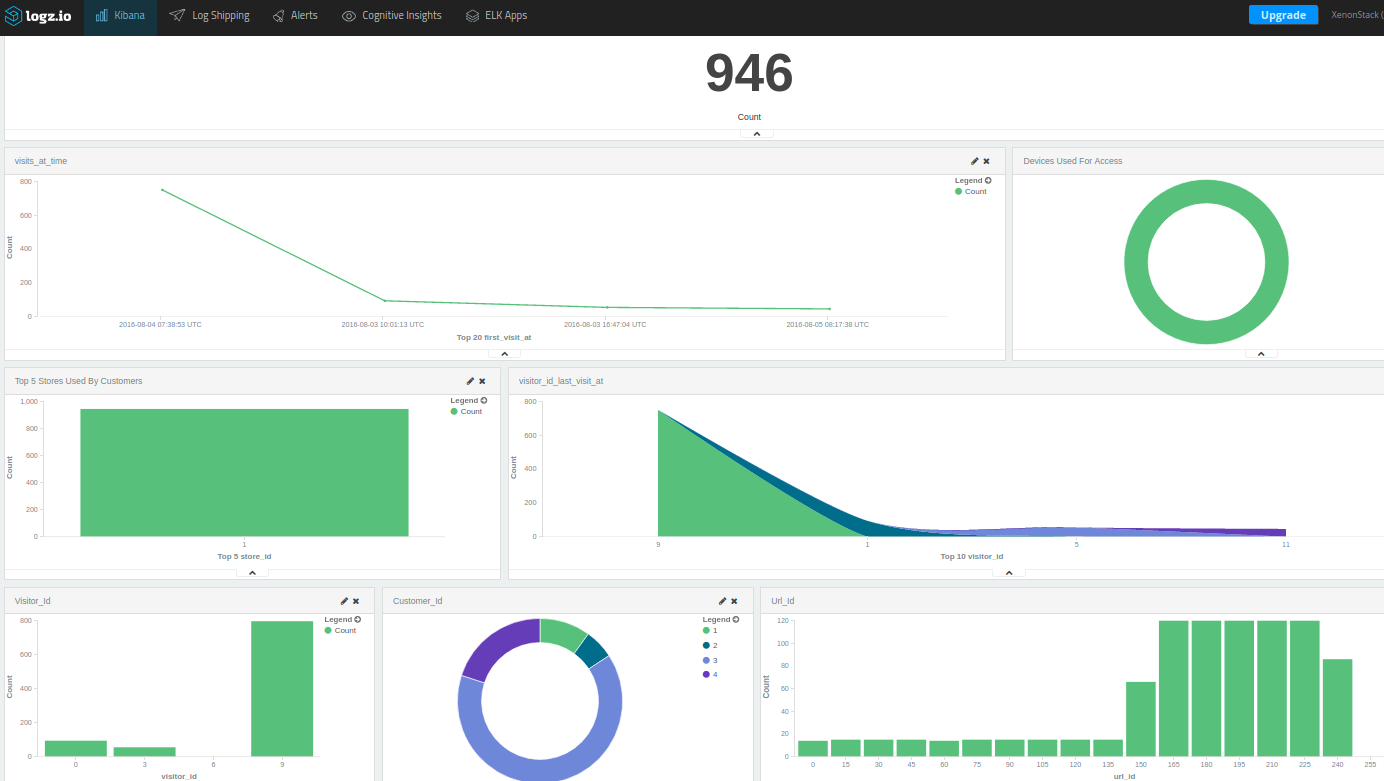
There are plenty of additional visualizations that can be created to see which store is visited the most by the customers, the amount of time spent per visit, a list of usernames, and other information. The sky’s the limit. After creating the visualizations, you can easily consolidate all of them into a single dashboard to monitor visitor activity in your Magento store:
A final note
Magento has some great built-in logging features but as with any streaming of big data, the challenge is how to handle the data and gain actionable insight from it. A centralized logging solution combining Magento with the ELK Stack easily provides the ability to handle a large number of logs being generated by your visitors and then analyze that information.
Our next Magento post will be more developer-oriented and will focus on logging Magento system and execution logs with ELK. Stay tuned!

You Might Also Like

Observability All-Star: Justin Smith, MIM Software

Logz.io Cloud SIEM
Get started for free
Completely free for 14 days, no strings attached.
