
Using Kibana Timelion for Time Series Analysis
December 7, 2016
First introduced by Elastic a year ago, Kibana’s Timelion is another step in closing the gap between Kibana and Grafana. Both these visualization tools have their own strengths and weaknesses (see this comparison), but one aspect that Kibana falls short is in time series analysis and visualization.
This is precisely where Timelion comes in.
Timelion enables you to combine independent data sources within the same visualization. Using a relatively straight-forward syntax, you can execute advanced mathematical calculations, such as dividing and subtracting metrics, calculating derivatives and moving averages, and of course visualizing the results of these calculations.
In total, there are about fifty different functions (some still experimental) you can use to slice and dice the data set you’re analyzing. This article will provide you with the basic of getting started with Timelion and its function syntax.
Installing Timelion
Start with Kibana 5.0. Since Timelion is built into Kibana, there’s no need in taking any additional installation and setup steps. All you need is data!
Since I presume most of the readers are not yet on the latest version of Kibana, here’s how to install Timelion on older versions.
Access the Kibana installation directory:
$ cd /opt/kibana
Execute:
$ sudo ./bin/kibana plugin -i elastic/timelion
Then, restart Kibana and refresh your browser. Kibana should appear as a separate tab.
More on the subject:
Since I’ve already got ELK Stack 5.0 — setup on my dev machine, the remaining sections will be showing off Kibana 5.0. Specifically, I’ll be demonstrating analysis of system and Apache metrics collected by Metricbeat.
Timelion Expressions
Like every querying syntax, Timelion has its own language for defining functions.
For example, each expression needs to start with a dot ‘.’ As you begin experimenting, you will slowly begin to understand the nuances between each expression. Timelion’s helpful auto-completion feature will help you build the expression as you go along (Timelion also has a built-in tutorial and docs to help get you started.)

Opening Timelion for the first time, you’ll see that the function box at the top of the page already includes a default expression:
.es(*)
This expression is basically telling Timelion to show everything in the default Elasticsearch index. If you’d like to restrict Timelion to data within a specific index, you can specify the index within the function:
.es(index=metricbeat-*)

In any case, you must start every Timelion expression with a datasource function.
Performing Basic Calculations
The next function I’m going to show will calculate the total amount of memory usage of my server using the ‘metric’ argument.
.es(metric='sum:system.memory.used.bytes')
On the right, you can select a different time range to change the resolution of the visualization.

To display the average on a numeric value, all I have to do is change the function to:
.es(metric='avg:system.memory.used.bytes')
Other mathematical arguments you can use are: min, max and cardinality, all of which need to be followed by a specific field.
Using a comma in the function, you can analyze a series of metrics together:
.es(metric='avg:system.memory.used.bytes'), .es(metric='avg:system.cpu.system.pct')

Chaining Functions
You can chain functions together, but note that the expression must first contain the data source function somewhere before the chained function.
For example, let’s display the variation (the function’s derivative) for a specific value by using the following formula:
.es(metric='avg:system.memory.used.bytes').derivative()

Data Formatting
You can also label data as well as other types of data formatting (such as setting the position of the legend or changing the color of a series — see below) within the function syntax.
The example below defines the label to use:
.es(metric='avg:system.memory.used.bytes').derivative().label('System memory derivative')

Analyzing Trends
Another useful function to use is trend (). This function can be used to display a trend line using either a log or linear regression algorithm:
.es(metric='avg:system.memory.used.bytes').trend(mode='linear')

Using Offsets
Another useful option in Timelion is using offsets to analyze old data. This is useful for comparing current trends with earlier patterns.
For example, say you’d like to explore the average amount of memory usage yesterday:
.es(metric='avg:system.memory.used.bytes', offset=-1d)
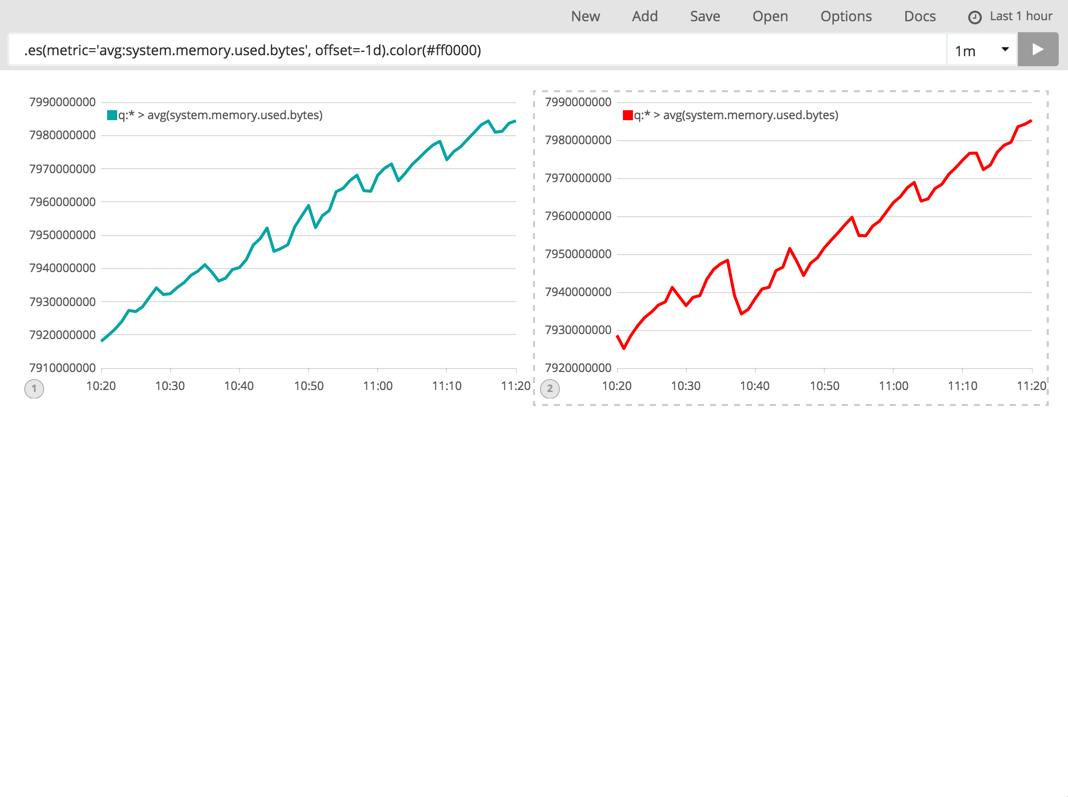
You can then add the graphs side by side to get the dashboard effect (click Add at the top of the page, and enter a new expression).
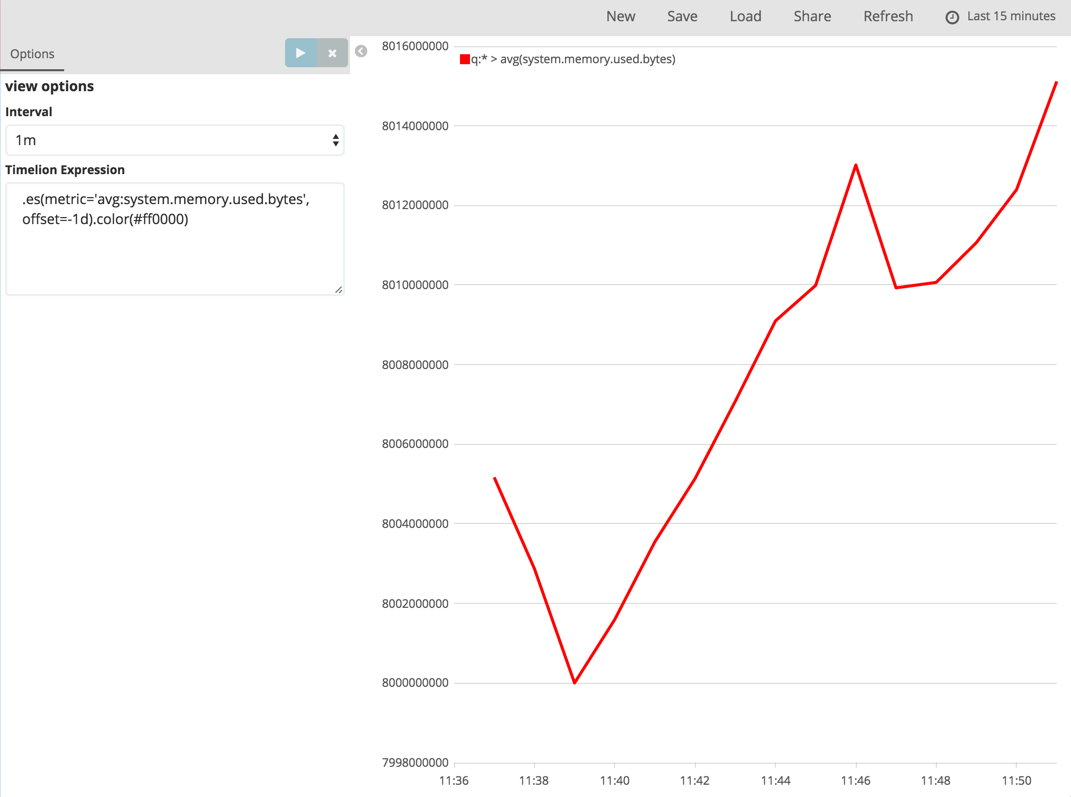
I’d recommend using .color() in the expression for easier analysis:
.es(metric='avg:system.memory.used.bytes', offset=-1d).color(#ff0000)
Of course, just like in regular Kibana visualizations, you can filter events with simple drag and dropping.

Visualizing Timelion Expressions
As with “regular” visualizations in Kibana, you can visualize Timelion expressions from the Visualize tab.
On the Visualize page, select Timeseries as the visualization type and enter the Timelion expression in the designated field.
Another option is to simply save the expression in Timelion itself and then open it in the Visualize tab. In any case, these expression visualizations can then be added to your dashboard together with other visualizations.
Analyzing Other Data Sources
Of course, all of the above relates to analyzing data indexed in Elasticsearch. Things can really get interesting with Timelion when pulling from external data sources using public API. Timelion has native API for pulling data from the World Bank, Quandl and Graphite.
This blog post goes into details on pulling data from Quandl and shows some good examples of the deep analysis that can be done with Timelion. More resources are listed below.
Endnote
Timelion is a pretty powerful tool for analyzing time series data and compliments Kibana’s traditional visualization capabilities. As such, we will be adding it to Logz.io in the next few weeks.
As with any new technology, Timelion is still somewhat “in-development” and the documentation is still a bit sketchy, so you can expect a small learning curve (for example, the function documentation lacks examples).
I highly recommend reading through the built-in Timelion tutorial. It contains some useful definitions and clarifies the differences between expressions.
Here are some additional resources to help you understand Timelion:
- https://www.youtube.com/watch?v=-sgZdW5k7eQ
- https://www.elastic.co/blog/timelion-timeline
- https://rmoff.net/2016/03/29/experiments-with-kibana-timelion/
Enjoy!

You Might Also Like

From Spotify to Open Source: The Backstory of Backstage

