
Cracking Production Performance Issues with Open Source Observability
September 23, 2020

I would like to share our recent case study on our battling a very serious performance issue whose solution turned out to be a small change in code, but with a huge impact on all of our HTTP endpoints in our platform.
Among other topics, I’ll cover:
-
- How we investigated and found the root cause
- Logs, metrics and tracing all together to have better observability
- How Jaeger, as a tracing tool, ease to visualize our potential bottlenecks
- How to correlate logs and traces together
Our Wakeup Call to High Latency
Some may say we are experts in observability and mainly in logging. That’s what we do for a living, once we encounter any performance issue, this might be no brainer for us to fix it in no time.
More on the subject:
That might just be true in certain use cases. Consider whenever there are few slow endpoints and identifying the root cause via logs is easy. But in practice, logs are not enough when the situation is getting more complicated. We’ll see this later on.
Subsequently, performance issues were reported especially during peak usage times — 2:00-7:00 PM local time, overlapping between EU and US customers.
We at Logz.io use our own product, just like any other customer, so our own internal Slack channels saw employees reporting increased latency over the same period of time.
Better Observability of Latency with Logs, Metrics, & Traces
In order to correlate users’ complaints and actual monitoring data, we usually check all three main pillars of observability: logs, metrics, and trace data. Let’s have a closer look at how we used each one of them in this case:
Logs
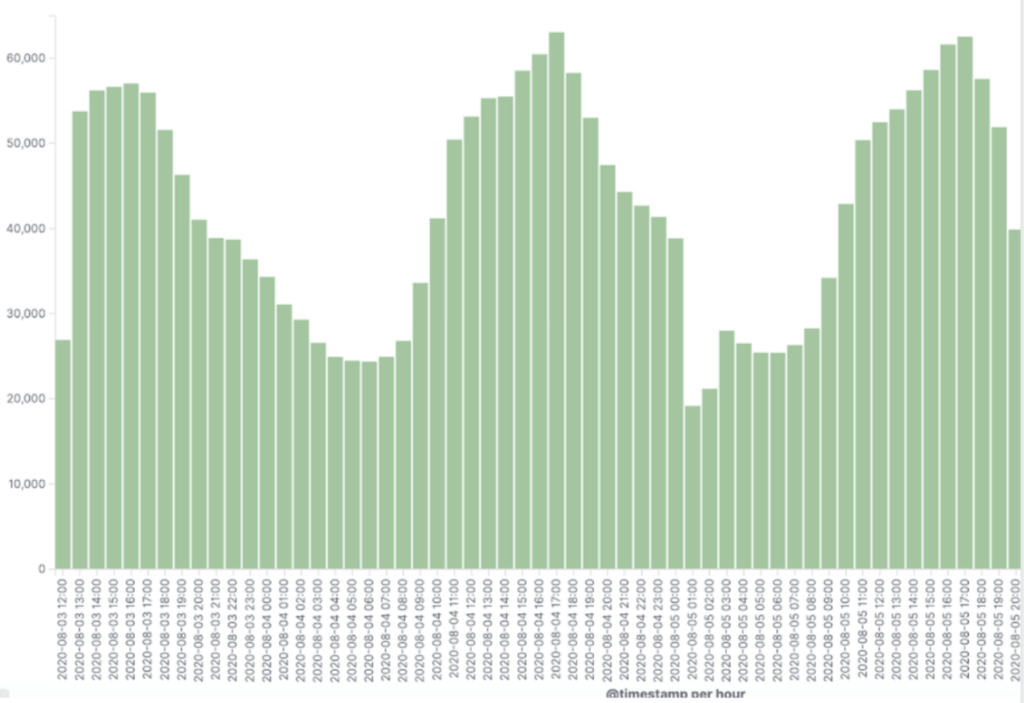
Our log analytics product is built on top of open source ELK stack. We use a custom field processingTime (time which takes for a backend endpoint to be processed) in our access logs and then visualize it over time in Kibana. That better picture can identify suspicious endpoints which take more time than anticipated in peak times. We can see below an example of an endpoint which consistently takes more time (ms) every during the 2:00-7:00 PM window.

Peak hours produce increased or high latency
In addition to the processing time each suspicious request took, we saw growth in the number of requests to the microservice handling our user session tokens. Likewise, we noticed a very high load of requests during those same peak hours.
Metrics
Our metrics product is based on Prometheus. In our backend infrastructure dashboards, we found consistent spikes in transaction commit size written into our distributed database (Galera). Those spikes correlated with the same peak times above between Monday and Thursday. Apparently, this might look pretty valid because these are our customers’ rush hours, but we’ll see later why it made us suspicious.

Additionally, we also faced significant replication latency in our database cluster during the same period:

Distributed Tracing
Last but not least, our tracing product (now in beta) is building on top of open source Jaeger.We checked for patterns of high latency by filtering out requests that took less than 5 seconds. Again, slow requests popped up more during peak hours.

Each type of representation of data has its own benefits, so with using Logz.io it was very easy to correlate all data together and navigate between them to find the performance bottlenecks.
One of the must-have features to correlate logs, metrics, and traces is using the trace-id common tag. Alternatively, in lieu of it, another common tag like request-id matches these requests throughout all of our microservices together.
Performance Investigation Deep Dive with Jaeger
As we already discussed, our goal was to find what made our application slower than usual during peak hours. We needed to trace our application flow to find out where the performance bottlenecks were. More importantly, we can track how we got there, i.e., find the request flows which led us to the suspiciously slow span. As modern microservice-based applications boom it gets harder to trace things manually, by adding dedicated logs of before and after any needed code block. Moreover, it makes the code cluttered and unclear with unwanted log lines.
In our case, Jaeger made our life much easier. Especially for a new developer in the company who was not fully familiar with all of the involved components, it was easier to understand the business flow by identifying long-running spans before changing any code (which takes much more time).
So, if we could point to the exact places in our code where performance bottlenecks, it would be super easy to fix it in no time. However, our case was a bit different. Virtually every endpoint in the backend was suffering at peak times while firing a search request:

Peak hours trace
Normally with slow search queries the suspicion falls on the database, in this case Elasticsearch. So in this case of high latency, we correlated the above span from the POST /services/query request with our logs and realized that the actual Elasticsearch query only took 15ms (hardly a slow query)! So, we were able to rule that out.

It’s important to emphasize that in non-peak hours, these microservices take 10 milliseconds at most:

Off-hours trace
As we can see, that looks way different from the example we showed before! So, why does it behave so dramatically worse in rush hours?
We Found It!
We encountered pretty much the same slow pattern in all related endpoints when performing search requests. As a result, we were pretty confident that the root cause for all of it had to be in one of our core cache components. In other words, too many requests were delivered to our internal microservice (which serves the user session token object from the database) instead of getting it directly from the cache.
This hypothesis also fits the scenario above since more active users implies more SELECT and UPDATE queries for each user session token at precisely the same time we saw these slowness peaks in our graphs.
From there, finding the best solution was pretty straightforward and the fix took us just two lines of code! It was a matter of changing the configuration of our session token cache eviction policy.
Boommmm
The most exciting part of these kinds of fixes is to see how all the graphs change immediately. The writes and reads traffic both to and from the database, plus the high latency in many requests, dropped as soon as we pushed the fix live to production. The impact was absolutely clear in our application dashboards:
We could see the total size of transaction commits dropped right after the deployment.

Also, we saw the total number of requests to the problematic service cut off by more than 80%!

And most importantly, as soon as we deployed the fix, the latency dropped across all the impacted endpoints:

For the coup de grace, we were waiting to hear from our customers any positive feedback. And we didn’t have to wait long. We immediately received high marks.
Summary
We still have a long way to fully instrument our system, but even with what we did so far we see that the efforts have paid off. We got a really cool and meaningful view of our system which makes us better understand our business flows and more importantly in our case to quickly identify any bottlenecks.
We already learned from our ongoing tracing adoption journey a few tips worth sharing:
- Correlation between spans and logs is a must-have. The best practice for doing it is with a unique identifier such as
trace-idor in case it’s missing withrequest-id. It brings a lot of value when you better want to examine a full request end to end by one click which moves you to the respected logs page and vice versa. With Logz.io, you will get the log-trace correlation out of the box, which simplified things for us. - If your application is multi-tenant and you want a better view of traces of a specific customer, I’d recommend adding custom tags like
customerIdoruserId - If you want more finely tuned traces, consider adding custom spans for important pieces of application logic. Don’t just wrap every endpoint, which is the easy thing to do. If we suspect, for example, a slow query in the database, we can easily add in code for a custom span that will measure just this section and then it’ll be visualized under the parent transaction span, so we can see how much time it takes comparing the other spans.
Having Logz.io made our journey much smoother, having logs, metrics and traces in one consolidated platform without the need to install and maintain it ourselves and with built-in correlations. Join the beta program to try out the distributed tracing service, or sign up for a free trial to check out the full platform.

You Might Also Like
The New Open 360 AI Experience

