
The Complete Guide to Capacity Management in Kubernetes
April 10, 2024

In the dynamic world of container orchestration, Kubernetes stands out as the undisputed champion, empowering organizations to scale and deploy applications seamlessly. Yet, as the deployment scope increases, so do the associated Kubernetes workload costs, and the need for effective resource capacity planning becomes more critical than ever.
When dealing with containers and Kubernetes you can find yourself facing multiple challenges that can affect your cluster stability and your business performance. Some of these challenges can be caused by misconfiguration of your pods and containers for example lack of memory limit or wasted resources and more.
In this guide we will go over how to use metrics from your Kubernetes cluster to gain effective observability into your utilization, which will enable you to analyze, recommend and optimize your environments and even potential cost reduction with finding wasted resources.
Kubernetes Metrics in Use
Let’s start by looking at useful metrics Kubernetes offers us. We will use these metrics in the subsequent sections to build our capacity queries and visualizations.
- Node_cpu_seconds_total
- node_memory_MemTotal_bytes
- node_memory_MemAvailable_bytes
- kube_pod_container_resource_requests
- container_cpu_usage_seconds_total
- kube_pod_owner
- container_memory_working_set_bytes
- node_memory_Cached_bytes
- node_memory_Buffers_bytes
- kube_pod_container_resource_limits
- kube_node_status_allocatable
- container_memory_usage_bytes
Now that we have the raw metrics data, in the next sections we will look into analyzing the capacity across Kubernetes’ different entities: containers, workloads, pods, nodes and clusters, and which queries and visualizations we can build for each of them.
Containers
Setting the right resources for your containers is crucial, like giving them enough fuel to run smoothly. Make sure to allocate enough resources to your containers based on what they usually need to work well. While these needs might change a bit, they’re usually not completely unknown. It’s a good idea to be a bit generous with your estimates to handle any unexpected changes.
When configuring your resources, two critical parameters to consider are “requests” and “limits.”
Resource requests specify the amount of CPU and memory that a container initially requests from the Kubernetes scheduler. These requests are used by the scheduler to decide on which node to place the pod.
Resource limits, on the other hand, define the maximum amount of CPU and memory that a container is allowed to consume. These limits are enforced by the Kubernetes kubelet, which monitors resource usage and takes action if a container exceeds its specified limits.
Once we understand those definitions we can now use metrics from the cluster to identify wasted resources. Wasted resources are defined as when you allocate too many resources compared to the actual resources being used.
Useful PromQL Queries
We can use the metrics we listed above and combine them to construct PromQL queries to help us find the memory and CPU utilization:
- Utilized memory:
sum(kube_pod_container_resource_requests {unit="byte"}) by (container)
- (sum(container_memory_working_set_bytes) by (container))- Utilized CPU:
sum(kube_pod_container_resource_requests{unit="core"}) by ( container)
- sum(rate(container_cpu_usage_seconds_total[$__rate_interval])) by (container)
Access this dashboard on Logz.io!
Existing Logz.io users can download the dashboard directly from their account.
New to Logz.io? No problem! Start your free trial today and unlock access to our dashboard.
Useful Visualization
With the above queries in place, together with information enrichment taken from the Kube_pod_container_info metric, we can now visualize it as a table in Grafana to have a list of all containers and their utilized CPU and memory.
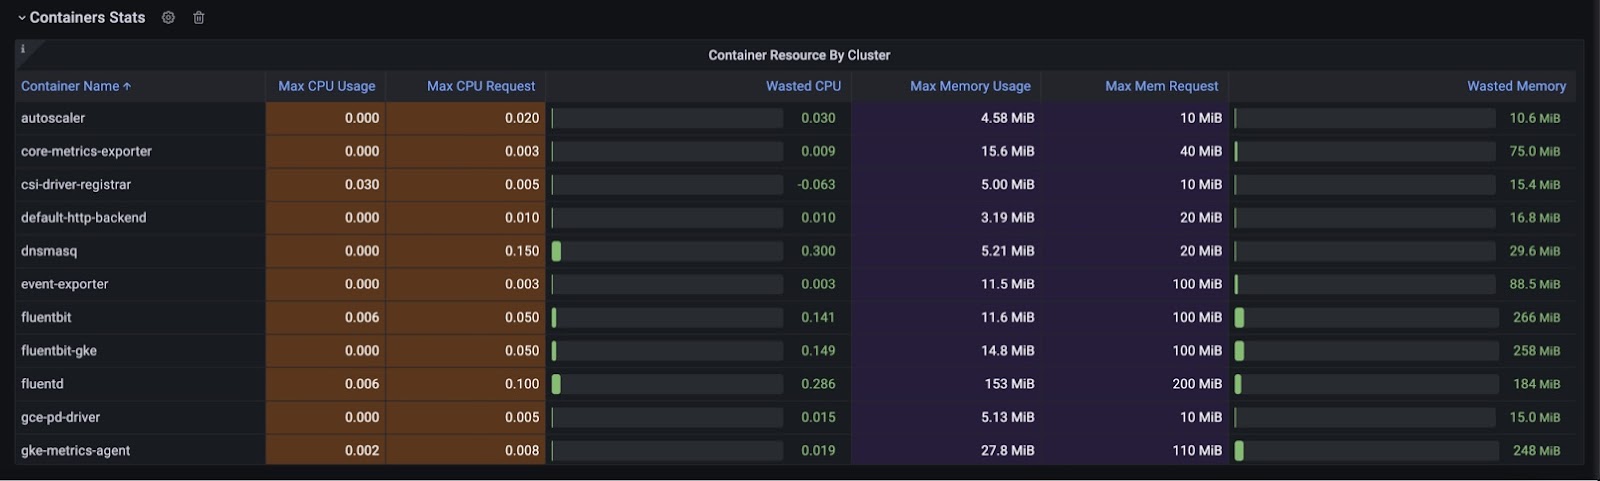
The table format allows us to get a comprehensive overview of resource utilization across clusters, providing detailed information about each container’s resource consumption and highlighting areas that may require attention or optimization.
Workloads
Monitoring Kubernetes workloads allows holistic visibility into application performance and resource utilization. Workloads often consist of multiple pods distributed across different nodes, each contributing to the overall application functionality.
Understanding how these pods work together and communicate with one another provides a deeper understanding of application behavior and performance bottlenecks. Monitoring at the workload level enables operators to detect anomalies or performance issues that may not be apparent when observing individual pods or nodes, facilitating proactive troubleshooting and optimization efforts.
Secondly, monitoring Kubernetes workloads helps in aligning resource allocation with application requirements and business objectives. Workloads may have varying resource demands based on factors such as time of day, user activity, or specific events.
By monitoring workloads, operators can dynamically adjust resource allocation to meet changing demands, ensuring optimal performance and cost efficiency. This proactive approach to resource management enables organizations to effectively scale applications, mitigate performance bottlenecks, and optimize resource utilization, ultimately enhancing the overall reliability and efficiency of Kubernetes deployments.
To better understand different workloads performance and utilization we can look at the following queries and create a visualization in Grafana that shows statistics and recommendations.
Useful PromQL Queries
By this query we recommend the Max memory that you should defend — your usage in the last 90 days + 10%.
max(max_over_time(container_memory_working_set_bytes{pod=~"$owner_name.+",container=~"$container"}[90d])) * 1.1This query taking what the new request should be (90 day max usage * 1.2) — the max existing usage to find a conservative estimate of the amount of GiB this could roughly save.
(max(max(kube_pod_container_resource_requests{resource="memory", container=~"$container", pod=~"$owner_name.+"})
by (container))-(max(max_over_time(container_memory_working_set_bytes{pod=~"$owner_name.+",container=~"$container"}[90d])) * 1.1))
*count(container_memory_working_set_bytes{pod=~"$owner_name.+",container=~"$container"})
The above example is for memory utilization, we do the same for CPU.
Useful Visualization
In this visualization you can see all relevant data regarding the current memory configuration. We queried the avg, max, min and recommended memory request and added the current limit configuration for the pod.

Pods
Setting memory limits in Kubernetes pods is crucial for resource allocation, stability, and efficient resource utilization. It improves scaling, prevents monopolization of resources, and promotes better Quality of Service.
Memory limits act as a safety mechanism, preventing memory consumption issues, facilitates monitoring, and improves troubleshooting. Combined with resource requests, they ensure controlled environments, prevent failures and enhance cluster performance.
These metrics are used to provide insights into the CPU and memory usage, requests, limits, and utilization of pods across different nodes in the Kubernetes cluster.
Useful PromQL Queries
This query will calculate the utilization of each pod by node:
(sum(rate(container_cpu_usage_seconds_total{kubernetes_io_hostname=~"$node",
  cpu="total",container!="",mode!="idle",mode!="iowait"}
[$__rate_interval]))by (pod)/
sum(kube_pod_container_resource_requests{node=~"$node",  resource="cpu"}) by (pod)) * 100
This query tells us which pod has a memory limit, we display it in red.
This example is for memory utilization, and the same can be done for CPU.
Useful Visualization
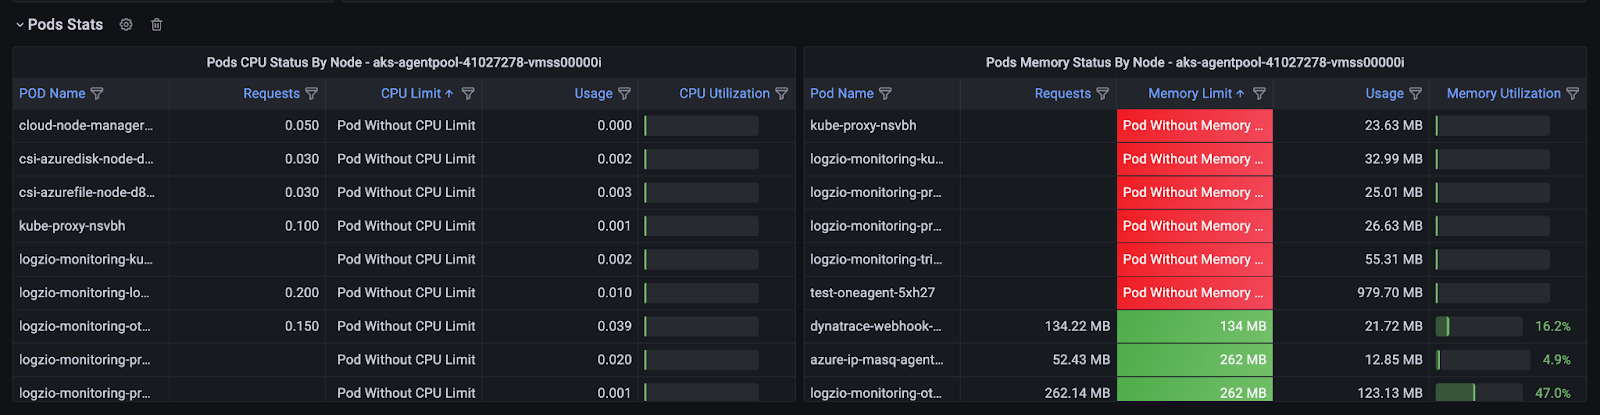
In summary, table visualizations enhance an administrators’ ability to monitor, identify anomalies, plan capacity, and streamline operational tasks in the Kubernetes cluster. It fosters informed decision-making and boosts infrastructure efficiency and stability.
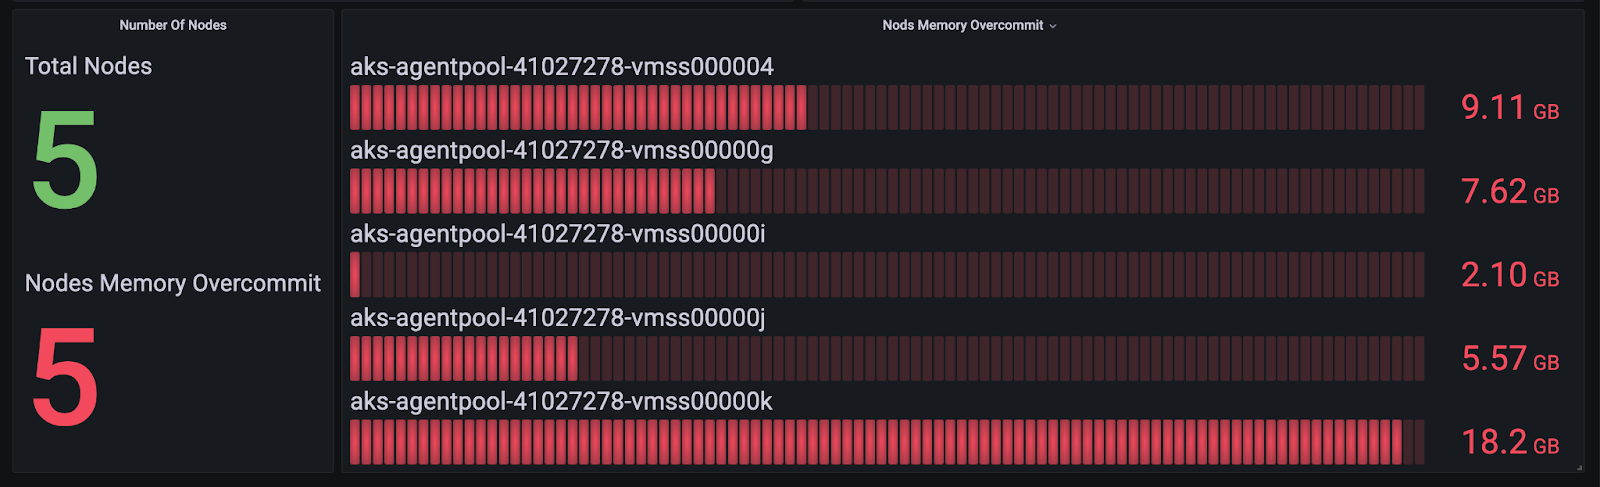
Nodes
In Kubernetes clusters, nodes serve as the infrastructure for running pods. It’s crucial to align resource allocation with expected usage rather than relying on best-case scenarios.
Overcommitting resources on nodes can enhance efficiency but also poses risks, leading to increased resource usage and potential performance issues. Striking a balance by accurately assessing workload requirements and setting appropriate resource requests ensures optimal performance and stability.
Allowing the environment to determine node size and number helps maintain scalability and flexibility while mitigating risks.
In this section we will look at how to observe the node’s CPU and memory utilization, as well as how to easily discern overcommitted nodes.
Overcommitted Nodes
Memory overcommitment occurs when virtual memory allocated exceeds physical memory available on the host system, common in virtualization and operating systems.
Techniques like memory page sharing and swapping optimize memory usage, but sustained overcommitment can degrade performance or cause instability, especially when demand consistently exceeds physical capacity.
Balancing resource utilization and performance is crucial when deciding to overcommit, necessitating careful monitoring and management to mitigate risks. Various systems and platforms offer specific tools or configurations for effective handling of overcommitment.
Useful PromQL Queries
In this query we calculate the sum of limits for all pods by node, to find overcommitted nodes, where the limits are larger than what was allocated.
(sum by (node)(kube_pod_container_resource_limits {resource="memory"}) ) - (sum by (node)(kube_node_status_allocatable{resource=~"memory"})) > 0Useful Visualization
In this panel you are able to see the utilization of each node in your cluster.
These metrics provide insights into the CPU and memory utilization of nodes in the Kubernetes cluster.
Useful PromQL Queries
Node Memory utilization
We calculate the memory utilization of the nodes by cluster.
(sum(node_memory_MemTotal_bytes{}) by (kubernetes_node)-
(sum(node_memory_MemFree_bytes{cluster=~”$cluster”}) by
(kubernetes_node) + sum(node_memory_Cached_bytes{cluster=~”$cluster”}) by
(kubernetes_node) + sum(node_memory_Buffers_bytes{cluster=~”$cluster”}) by
(kubernetes_node)))/sum(node_memory_MemTotal_bytes{cluster=~”$cluster”}) by
(kubernetes_node)
Useful Visualization

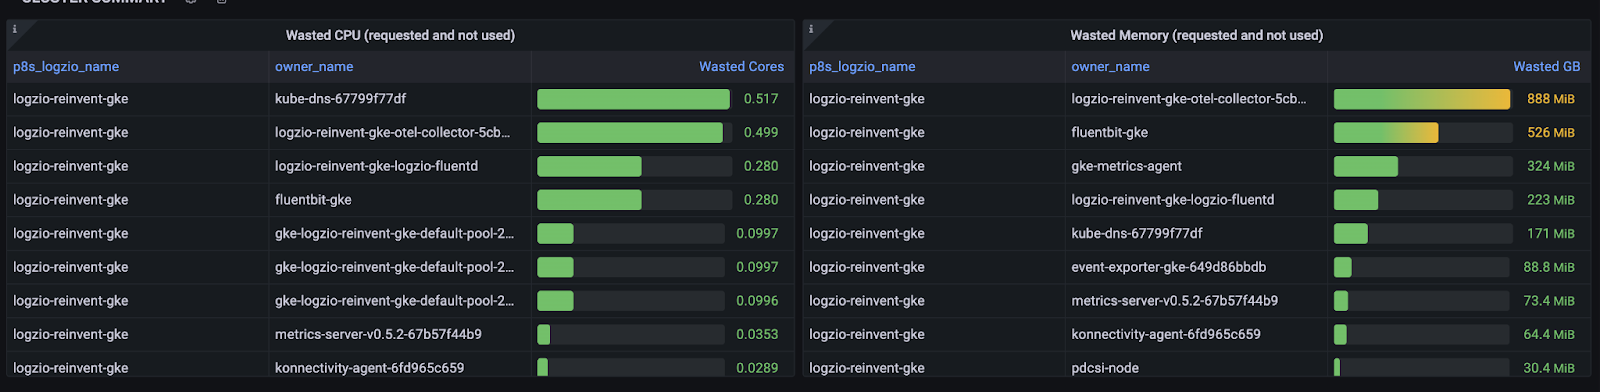
Wasted CPU and memory from a workload perspective
Kubernetes allows defining resource requests and limits for workloads, setting minimum requirements and maximum usage. Tailoring these configurations optimizes resource utilization while ensuring consistent performance.
Strategic limit setting is crucial; too low may terminate applications, while too high leads to unnecessary costs. Benchmarking typical usage and providing a 25% margin accommodates fluctuations. Load tests identify performance issues due to insufficient limits.
Inefficient allocation results in wasted CPU and memory, impacting performance and incurring costs. Accurate configuration of resource allocation ensures efficient resource use, maintains performance, and controls costs.
These metrics provide insights into CPU and memory wastage in Kubernetes pods, helping identify potential areas for optimization and resource allocation improvements.
Useful PromQL Queries
Let’s start by calculating the unutilized CPU, namely that requested and not used. The following query calculates the top 10 pods with unutilized CPU:
topk(10,sum((sum(kube_pod_container_resource_requests{ unit="core"}) by ( p8s_logzio_name, pod, container) - sum(rate(container_cpu_usage_seconds_total{}[10m])) by (p8s_logzio_name, pod, container)) * on(pod) group_left(owner_name)kube_pod_owner{}) by (p8s_logzio_name, owner_name))Similarly, let’s calculate the unutilized memory, namely that requested and not used. The following query calculates the top 10 pods with unutilized memory:
topk(10,sum((sum(kube_pod_container_resource_requests{ unit="byte", resource="memory"}) by (p8s_logzio_name, pod, container) - sum(container_memory_working_set_bytes{}) by (p8s_logzio_name, pod, container)) * on(pod) group_left(owner_name) kube_pod_owner{}) by (p8s_logzio_name, owner_name))Useful Visualization
In this visualization we show the unutilized resources by workloads, which helps manage the resources by workloads and lower costs.
Cluster Overview
After we analyzed and visualized all components we would like to summarize all the statistics and recommendations into one panel. This panel shows the current status of CPU and memory utilization for your clusters.
Useful PromQL Queries
This query calculates the memory utilization of your clusters
sum(node_memory_MemTotal_bytes{} - node_memory_MemAvailable_bytes{}) by (cluster) / sum(node_memory_MemTotal_bytes{}) by (cluster)Now let’s build the visualization to show it.
Useful Visualization
In this visualization we show the utilization of your clusters

Summary
In an era where downtime is unacceptable and operational efficiency is the linchpin of success, understanding the art of resource capacity planning within a Kubernetes ecosystem is pivotal.
We looked into the core principles and best practices that can empower you to not just implement resource capacity planning, but to do it with precision and foresight.
If you would like to learn more about how the Logz.io Open 360™ platform for observability can help you with Kubernetes capacity management, start a free trial today.

You Might Also Like

Completing the Kubernetes Monitoring Puzzle
