
Prometheus is a widely-used open source cloud monitoring tool that collects and stores metrics from various sources, including applications, databases, servers, and more to monitor the health and performance of cloud systems and components.
In this guide, we’ll take you through the steps and best practices for implementing Prometheus to monitor your Microsoft Azure workloads. We’ll demonstrate how Prometheus supports service discovery for Azure, making it easy to find and monitor new services as they are added to your Azure environment.
When monitoring Azure resources with Prometheus, we can employ one or both of the Prometheus deployment options:
- Provisioning the Prometheus server on a VM and configuring service discovery
- Using a managed service for Prometheus (such as Logz.io)
We’ll take you through both options in this guide.
First, we’ll examine how to run your own Prometheus deployment. Next, we’ll examine how Managed Prometheus Services like Logz.io can eliminate the storage constraints of Prometheus, reduce the engineering time needed to maintain Prometheus, and unify metric data with log and trace data for full observability.
Before we get to configuration instructions, let’s first address some of the pros, cons and general info for monitoring Azure with Prometheus.
Overview: Azure Monitoring with Prometheus
Prometheus has become the de facto cloud monitoring solution for many reasons — perhaps the most significant native integrations with popular cloud technologies like Kubernetes, which makes it easy to get up and running with monitoring.
You can also deploy exporters to collect metrics from additional sources that are not natively supported by Prometheus.
The PromQL query language facilitates real-time analysis and visualization of metrics in Prometheus, and lets you develop custom queries and visualizations to understand application and system performance.
PromQL can also be used to configure alerts via Prometheus AlertManager to continuously monitor metrics that could indicate incoming production issues. You can configure Prometheus AlertManager to generate notifications whenever certain conditions are met — it permits a wide variety of alert targets.
While Prometheus can help you visualize your data, it’s not known for its visualization capabilities. Many Prometheus implementations are integrated with Grafana — a popular open source data visualization tool often used for cloud observability.
Prometheus is designed to handle high-scale environments and thousands of metrics per second. That said, it is a single-node solution, so Prometheus servers can eventually run out of space and require additional servers. Learn more about how to build a scalable Prometheus architecture.
Let’s take a look at some of the key Prometheus components and capabilities.
Prometheus Capabilities for Azure Monitoring
Prometheus offers a long list of critical monitoring capabilities for Azure environments including:
- Collection and storage of metrics – Prometheus can gather and store metrics from numerous Azure sources, including servers, databases, applications, and more. It offers a scalable and adaptable framework for gathering and archiving metrics, along with real-time analysis.
- Metrics are collected by Prometheus and saved as time series data. This means the information about the involved metrics is captured, along with the time it was recorded and optional key-value pairs, called labels.
- Exporters – To gather metrics from sources that Prometheus does not inherently support, such as Azure services and applications, Prometheus supports the use of exporters. There are several exporters available that are unique to Azure, including the exporters for Azure Monitor, Azure Health Exporter and Azure Metrics Exporter.
- PromQL query language – You can evaluate and view metrics in real-time using Prometheus’ powerful PromQL query language. You can design unique queries and visualizations with PromQL to learn more about the functionality and operation of your Azure apps and systems.
- Alerting – You can set up alerts based on particular metrics or conditions using Prometheus’ built-in alerting features. When particular thresholds are reached, you can set up alerts to trigger, and you can choose which channels — such as email or Slack — should receive related notifications.
- Service Discovery – It’s simple to dynamically find and monitor new services as they’re added to your Azure environment thanks to Prometheus’ support for service discovery. This can save time and effort because it eliminates the need to explicitly configure Prometheus to monitor new services. Prometheus supports discovery of targets using static setup or service discovery.
- Use of HTTP pull to gather time series, with an intermediary gateway used to support pushing time series
- Integration with other tools – Systems such as Grafana and Logz.io are among the observability tools that can be combined with Prometheus to employ expanded dashboards and visualizations — providing real-time metrics monitoring and analysis.
If these concepts are new to you, check out our Intro to Prometheus metrics article.
Core Prometheus Ecosystem Components
The Prometheus ecosystem consists of multiple components, many of which are optional, including:
- The main Prometheus server which scrapes and stores time series data
- Client libraries for instrumenting application code
- A push gateway for supporting short-lived jobs
- Special-purpose exporters for services like HAProxy, StatsD, Graphite, etc.
- An alert manager to handle alerts
In the diagram below, we can see how some of these components interact:

The Prometheus data storage server by itself is not sufficient to create a useful monitoring solution. Other Prometheus components, such as Service Discovery, Alert Manager and Pushgateway, are needed for a complete cloud monitoring system.
Prometheus gets data from instrumented jobs either directly or through an intermediary push gateway for short-lived jobs. It keeps track of all scraped samples locally and applies rules to either create new time series from the existing data or to notify users. The gathered data can be displayed using Grafana or another API client.
Key Azure Capacity and Utilization Metrics
Before we jump into installing and configuring Prometheus and Grafana on Azure, let’s briefly review some of the key metrics we’ll monitor for our Azure workloads.
Network Availability – Monitoring network metrics including network latency, bandwidth utilization, and packet loss is crucial for ensuring high network availability in Azure. You should also configure your network resources to optimize redundancy and reduce downtime. You can track and troubleshoot network problems with the help of Azure’s built-in network monitoring tools and services, like Azure Network Watcher.
Network Throughput – The amount of data that can be transmitted over a network in a specific length of time is known as network throughput. It’s a crucial metric for determining the efficiency and capacity of a network and is typically expressed in bits per second (bps) or bytes per second (Bps). Network bandwidth, latency, packet loss, and congestion are just a few of the variables that impact network performance.
Network Utilization – The amount of network bandwidth used at any particular moment is known as network utilization. It’s a crucial metric for evaluating network capacity and efficiency, and is typically expressed as a percentage of all available bandwidth. By keeping an eye on network usage, you can spot possible bottlenecks or capacity issues and take action to improve network performance.
Storage Availability – Storage availability is a measure of a storage system’s capacity to make data available whenever required. It is a crucial metric for evaluating the dependability and efficiency of storage systems, and is frequently expressed as a percentage of system responsiveness and availability.
Storage Scalability – A storage system and database’s capacity to grow and change as data storage requirements rise over time is known as storage scalability. It’s a crucial measure for determining the adaptability and effectiveness of storage systems. Azure also offers tools and services for tracking metrics like storage capacity, growth rates, and usage patterns. One such utility is Azure Monitor.
Server Availability – Server availability is a server or group’s ability to provide apps and services when needed. It measures server reliability and efficiency as a percentage of the server’s availability and responsiveness.
Server Utilization – Server utilization is the amount of CPU, memory, and storage a server or set of servers use at a given time. It measures server system efficiency and speed as a percentage of total resources. Azure Monitor tracks CPU, memory, and disk I/O performance to evaluate server utilization. These metrics can detect server bottlenecks, optimize resource allocation, and improve application speed.
Setting Up Prometheus and Grafana on Azure
Prometheus can be installed and configured in a number of ways, depending on the needs of the organization. Container installations and virtual machine deployments are both supported.
Setting Up Prometheus and Grafana on an Azure VM
- Create a Virtual Machine: Create a Virtual Machine (VM) in Azure to get started. Your Prometheus server will be installed on this VM. Pick a suitable operating system, like CentOS or Ubuntu.
- Install Prometheus: Install Prometheus on your VM. The Prometheus binary must be downloaded, extracted, configured, and started as a service.
- Configure Prometheus: Configure Prometheus to scrape metrics from the Azure resources that you want to monitor. This involves creating a configuration file that specifies the endpoints to scrape and the metrics to collect.
- Install Grafana: Install Grafana on the same VM or a separate VM. Grafana is a dashboard and visualization tool used to view and analyze the metrics collected by Prometheus.
- Connect Prometheus and Grafana: Connect Prometheus and Grafana by adding Prometheus as a data source in Grafana. This involves specifying the URL of the Prometheus server and configuring authentication if necessary.
- Create Dashboards: Use Grafana to create dashboards that visualize the metrics collected by Prometheus. This can involve creating charts, graphs, and tables that show resource usage, performance, and other metrics.
Setting Up Prometheus and Grafana in Kubernetes
- Create a Kubernetes Cluster: Start by creating a Kubernetes cluster in your Azure environment. This can be done using tools like Azure Kubernetes Service (AKS) or by setting up your own Kubernetes cluster.
- Install Prometheus: VariousHelm charts are available for Prometheus installation. Use this Helm repository for the deployment of Prometheus Stack (Prometheus, Grafana, Alert Manager, etc.). Prometheus’s essential setup is taken care of by this installation, which also integrates Grafana and provides a pre-built dashboard.
Installation and Configuration of Azure Metrics Exporter
We’ll use the Azure Metrics Exporter to collect and send Azure metrics to our new Prometheus server. Before we can install the exporter, we need to make sure that Golang is available on the server, because the exporter needs Go binaries to operate.
Next, we can run the exporter as a service with parameters from the Azure Metrics Exporter configuration YAML.
An example YAML file might look like this:
active_directory_authority_url: "https://login.microsoftonline.com/"
resource_manager_url: "https://management.azure.com/"
credentials:
  subscription_id: ""
  client_id: ""
  client_secret: ""
  tenant_id: ""
targets:
resource_groups:
  - resource_group: "group-name"
    resource_types:
      - "Microsoft.Compute/virtualMachines"
    metrics:
      - name: "CPU Credits consumed"
      - name: "Percentage CPU"
      - name: "Network In Total"
      - name: "Network Out Total"
      - name: "Disk Read Bytes"
      - name: "Disk Write Bytes"
      - name: "Disk Read Operations/Sec"
      - name: "Disk Write Operations/Sec"
      - name: "CPU Credits Remaining"
In the credentials parameters, we need to specify the Azure Active Directory service principal name (SPN) details. To learn how to create an SPN, refer to this document. Under “Targets,” we can list multiple Azure resource targets, such as Azure Virtual Machines, Azure SQL DBs, and other Azure services.
After the configs, we need to add a target in the Prometheus config to add Azure Monitoring Exporter as a target. An example prometheus.yaml file can be found below.
global:
  scrape_interval: 1m # By default, scrape targets every 15 seconds.
  scrape_configs:
    # The job name is added as a label `job=<job_name>` to any timeseries scraped from this config.
    - job_name: 'azure'
      # Override the global default and scrape targets from this job every 5 seconds.
Visualizing Metrics with Grafana
Grafana is an open source platform for monitoring data and visualization that enables users to design dashboards providing real-time data from numerous sources, including databases, online services, and cloud-based platforms. Graphite, Prometheus, Elasticsearch, and a number of other data streams are supported by Grafana.
The platform offers a web-based interface for building and editing dashboards, which can be shared with others. Additionally, a variety of plugins and extensions are available through Grafana, enabling users to enhance the usefulness of their dashboards.
Grafana has gained popularity in the DevOps community for monitoring and alerting. Teams can use it to visualize performance metrics, track them in real time, and rapidly find and fix problems. Team members can also communicate and work together on dashboards, which promotes collaboration.
Grafana has extensible support for different data sources, and it’s easy to configure Prometheus with Grafana. We can add Prometheus as a data source in Grafana as below:

See our Grafana guide for more information on getting started with Grafana.
Creating custom dashboards
Grafana Custom Dashboards are user-created dashboards that are highly customizable and flexible. They can display data from a variety of sources, including databases, cloud-based services, and APIs, and can be customized to suit specific data visualization and monitoring needs.
Grafana’s custom dashboards let users make visualizations like charts, graphs, tables, and maps that can be set up and arranged to meet their requirements. This enables the creation of a highly-customized interface offering instantaneous insights into large, complicated data sets.
Custom dashboards can be distributed to additional users or members of a team to facilitate collaboration and information sharing. A variety of plugins and extensions are also available from Grafana that can be used to further customize dashboards and include new features.

In addition to building our own Grafana dashboards to monitor and visualize metrics, Grafana provides you with the flexibility of importing existing dashboards. We can explore the dashboard gallery and select a suitable dashboard for your needs. We can use those dashboards as a template and customize them as desired.


Setting Up Azure Alerts with Alert Manager
Prometheus’s open source Alert Manager is a tool for managing and processing alerts from different sources using metric data stored in the Prometheus time series database. It serves as a central hub for gathering notifications from various monitoring systems and forwarding them to the right people.
Users of Alert Manager can specify processing rules and routes for inbound alerts based on factors like severity, source, and destination. To avoid sending out pointless notifications and guarantee the right people receive the right alerts at the right moment, Alert Manager can group, filter, and de-duplicate alerts.
Email, Slack, PagerDuty, and a variety of other alerting endpoints are supported by Alert Manager. A web-based user interface is also available for managing notifications, visualizing alert history, and creating or changing alerting rules.

Configuring Alert Rules for Key Azure Metrics
Alert rules are predefined conditions or thresholds that cause a notice to be generated when specific metric thresholds are breached. When problems emerge that need attention, these rules are used in monitoring and alerting systems to inform operators or system administrators.
Setting thresholds for particular metrics, such as CPU or memory utilization, and defining conditions that result in alerts are typical components of alert rules. For instance, a rule for alerts might be constructed to trigger when the CPU is used more than 80% of the time for more than five minutes.
More complicated alert rules that incorporate numerous metrics and circumstances are also available. For instance, a rule can be designed to send an alert whenever the CPU or memory utilization reaches 80% or higher for more than five minutes, or 90% or higher for more than two minutes.
Example alert rule as below

Setting Up Notifications for Prometheus Alert Manager
Alert Manager supports an extensive list of notification receivers. Based on the requirement, we can configure email, Slack, or other notification channels. The following shows an example of alert manager configuration.

Common Prometheus Challenges and Solutions
Getting started with cloud monitoring on Prometheus is usually no problem — it’s easy to set up and provides powerful monitoring solutions.
However, Prometheus is purpose-built for metrics collection. This means you’ll need completely separate technologies for log and trace collection, which can create a sense of tool sprawl and delay troubleshooting.
Additionally, Prometheus is a single-node solution, so when it runs out of computing capacity, you’ll need to set up a completely new Prometheus server to collect more metrics. In instances where you have tens or even hundreds of Prometheus servers, federation is useful for gathering metrics from various Prometheus servers and combining them into a singular view.
You can use federation to roll up metrics from multiple servers into a single Prometheus server, or centralize your Prometheus metrics in a time series database like M3DB, Thanos, or Cortex. This provides a single place for horizontal scalability — making it easier to query and visualize all your metrics in one place. Learn more about this architecture in this guide.
The result can be a sprawl of Prometheus servers and other observability components that can be difficult and time consuming to manage.
Plus, since the observability data lives in so many different places in this scenario, it can be difficult to correlate the different signals to quickly dive into the root cause of production issues.
This is why Logz.io uses Prometheus-as-a-service to centralize Prometheus metrics from any deployment at any scale, while unifying metric data with logs and traces.
This eliminates the time needed to manage a scalable and HA Prometheus architecture, while providing a single place to analyze logs, metric, and trace data for unified visibility into production health and performance.
Let’s see how to configure Logz.io’s Prometheus-as-a-service to simplify Prometheus scaling and observability.
Setting up Prometheus As a Logz.io target
To connect Logz.io to Prometheus, we can simply add a remote write in the prometheus.yaml configuration file, as shown below. This setting includes the Logz.io URL and the token needed for authentication. These tokens and urls can be found when we create a Logz.io account.
global:
  external_labels:
    p8s_logzio_name: <labelvalue>
remote_write:
  - url: https://<url>:8053
    bearer_token: <token>
    remote_timeout: 30s
    queue_config:
      batch_send_deadline: 5s  #default = 5s
      max_shards: 10  #default = 1000
      min_shards: 1
      max_samples_per_send: 500 #default = 100
      capacity: 10000  #default = 500
Configuring Logz.io to Receive Prometheus Metrics
When Prometheus is configured for remote writes, we can monitor the incoming metrics that are being forwarded to Logz.io within the Logz.io homepage. We can verify these metrics from the Logz.io Explore dashboard, as shown below.

In exploring the metrics dashboards, we can see metrics that are forwarded from Prometheus.

Visualizing Prometheus Metrics in Logz.io
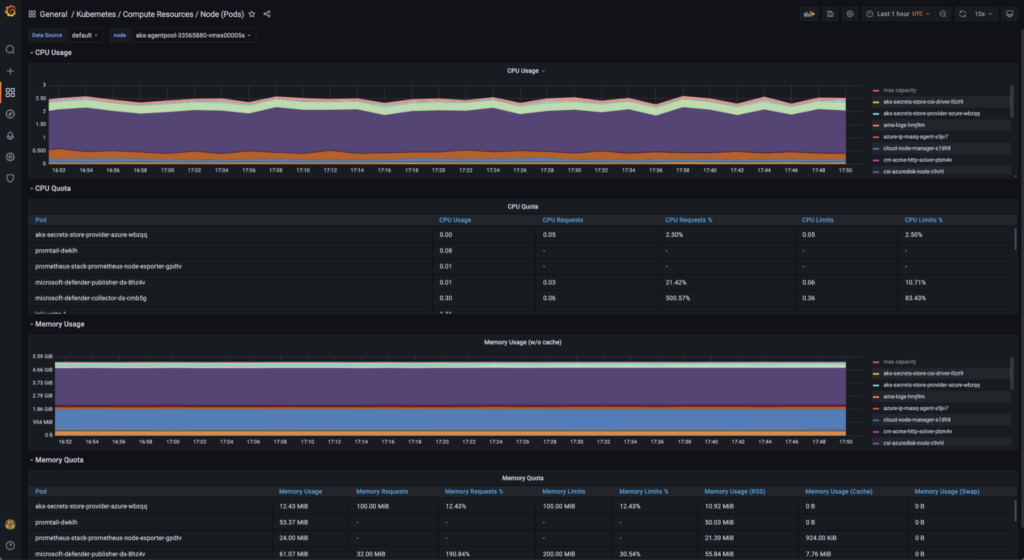
For Prometheus metrics, Logz.io offers a range of pre-built dashboards and visualizations, including dashboards for Kubernetes and other well-known technologies. These dashboards can save you time and effort by serving as a fantastic place to start when it comes to visualizing your metrics.
Check out our tutorial for building infrastructure monitoring visualizations with Logz.io, or listen to a webinar on building the ultimate cloud monitoring dashboard. See an example of a Logz.io infrastructure monitoring dashboard below:
After identifying trends in the data that could indicate oncoming production issues, Logz.io users who also send other telemetry data types can correlate metrics with the relevant logs or traces to troubleshoot issues.
In the visualization below, for example, we can investigate the sudden drop in 2xx response codes by correlating the metrics with the associated logs to understand the root cause of the issue.


Your Strategy for Monitoring Azure with Prometheus
Prometheus is a powerful and easy-to-use solution for Azure infrastructure monitoring — at least at small scale. But as cloud environments grow and become more complex, two things can happen.
First, as data volumes grow and Prometheus servers fill up, you’ll need to set up additional servers and consider rolling them up into a time series database like Thanos, Cortex, or M3DB for horizontal scaling, long-term data storage, and metric centralization.
Second, as your customers get bigger and demand more from you, your team may be on the hook to deliver higher SLAs and better performance. This could require more advanced observability to reduce mean-time-to-resolution (MTTR) for production issues. This could push your team to unify telemetry data analysis — including logs, metrics, and traces — under one hood to enable data correlation and faster analysis.
If you’re just monitoring a few Azure resources, running your own Prometheus is not a problem — and you can follow the steps in this guide to achieve positive monitoring outcomes. But as Azure environments grow and become more complex, managed Prometheus services like Logz.io can offer a simplified and scalable solution that reduces MTTR.
The best option for you depends on the time and resources at your disposal, as well as MTTR requirements in your organization.
Happy monitoring!