Cloud is driving the way modern software is being built and deployed. At the forefront of this revolution is AWS, holding a whopping 33% of the cloud services market in Q1 2019. Considering AWS had a seven-year head start before its main competitors, Microsoft and Google, this dominance is not surprising. AWS offers, by far, the widest array of fully evolved cloud services, helping engineers to develop, deploy and run applications at cloud scale.
Applications running on AWS depend on multiple services and components, all comprising what is a highly distributed and complex IT environment. To ensure these applications are up and running at all times, performant and secure, the engineering teams responsible for monitoring these applications rely on the machine data generated by various AWS building blocks they run and depend upon.
Needless to say, this introduces a myriad of challenges — multiple and distributed data sources, various data types and formats, large and ever-growing amounts of data — to name a few.
Enter centralized logging
To effectively monitor their AWS environment, users rely on a centralized logging approach. Centralized logging entails the use of a single platform for data aggregation, processing, storage, and analysis.
- Aggregation – the collection of data from multiple sources and outputting them to a defined endpoint for processing, storage, and analysis.
- Processing – the transformation or enhancement of messages into data that can be more easily used for analysis.
- Storage – the storage of the data in a storage backend that can scale in a cost-efficient way.
- Analysis – the ability to monitor and troubleshoot with the help of search and visualization capabilities.
ELK to the rescue
The ELK Stack is the world’s most popular open source log analytics platform. An acronym for Elasticsearch, Logstash and Kibana, the different components in the stack have been downloaded over 100M times and used by companies like Netflix, LinkedIn, and Twitter.
Elasticsearch is an open source, full-text search and analysis engine, based on the Apache Lucene search engine. Logstash is a log aggregator that collects data from various input sources, executes different transformations and enhancements and then ships the data to various supported output destinations. Kibana is a visualization layer that works on top of Elasticsearch, providing users with the ability to analyze and visualize the data. And last but not least — Beats are lightweight agents that are installed on edge hosts to collect different types of data for forwarding into the stack.
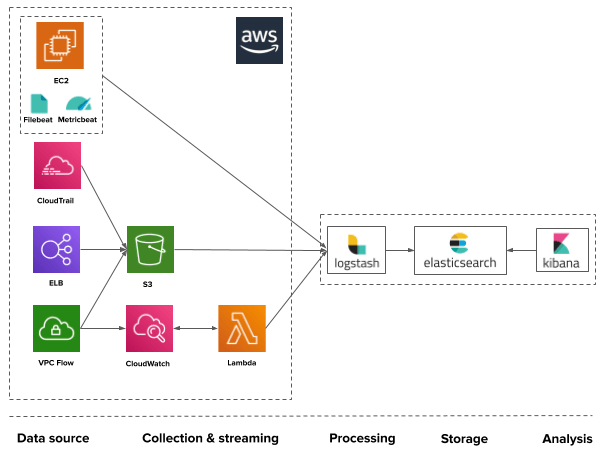
Together, these different components are used by AWS users for monitoring, troubleshooting and securing their cloud applications and the infrastructure they are deployed on. Often enough, the stack itself is deployed on AWS as well. Beats and Logstash take care of data collection and processing, Elasticsearch indexes and stores the data, and Kibana provides a user interface for querying the data and visualizing it.
Using ELK for analyzing AWS environments
How ELK is used to monitor an AWS environment will vary on how the application is designed and deployed.
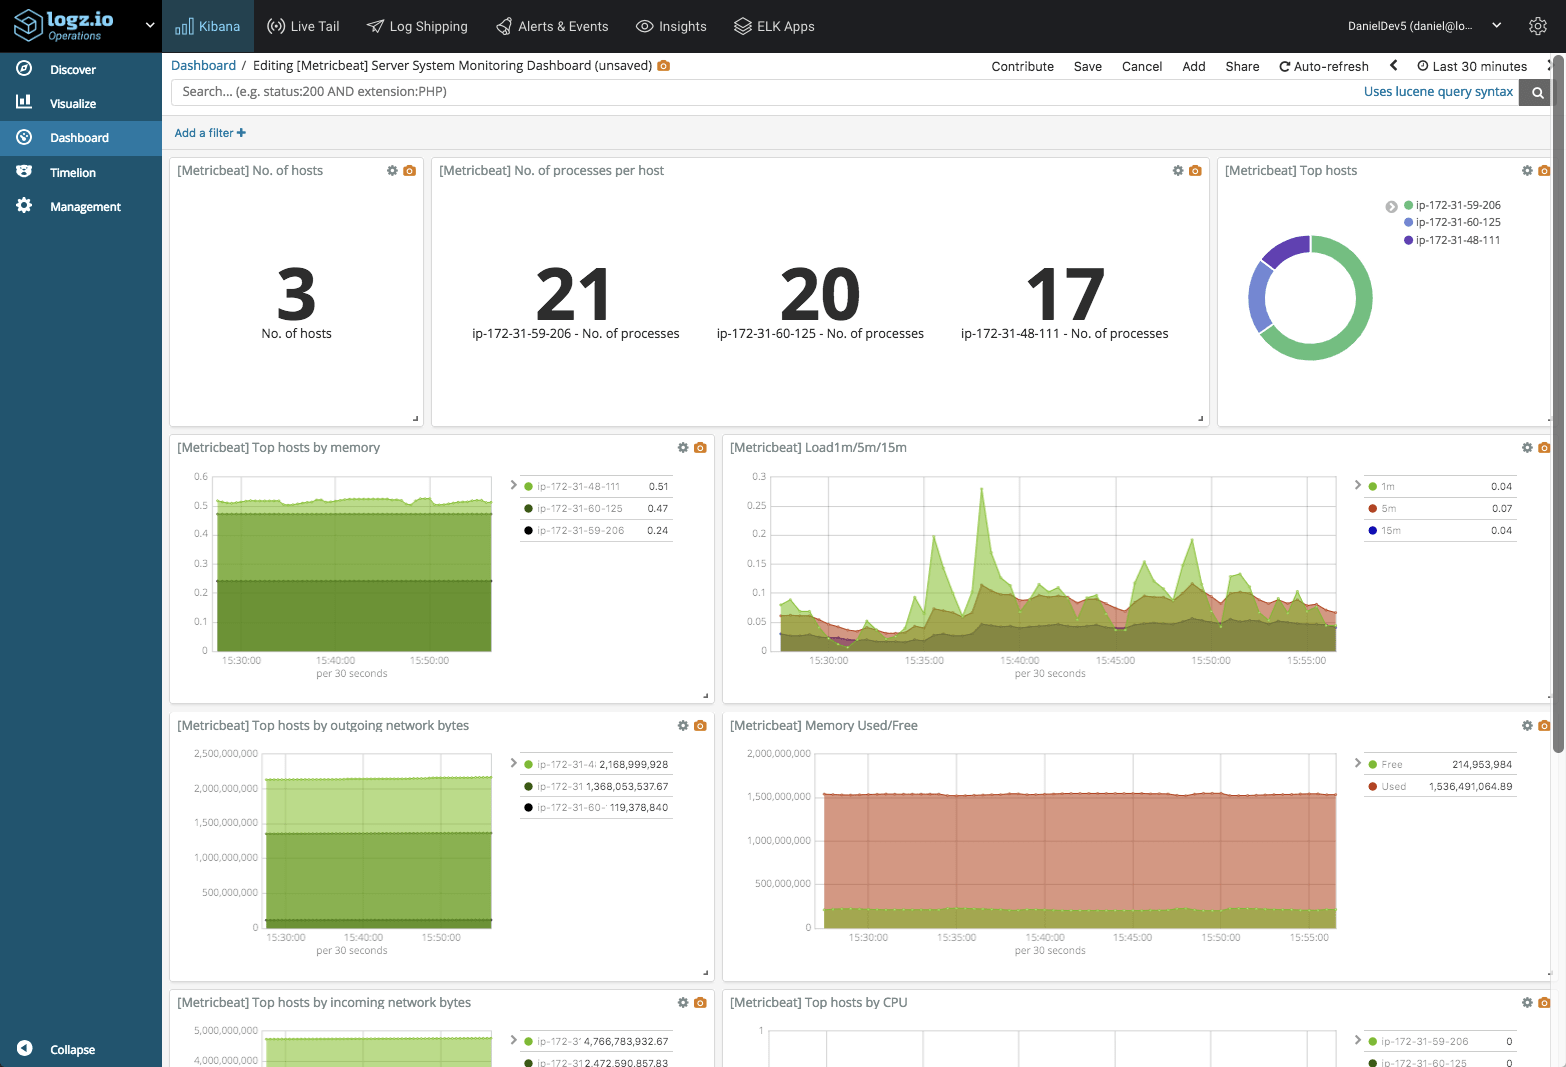
For example, if your applications are running on EC2 instances, you might be using Filebeat for tracking and forwarding application logs into ELK. You might be using Mericbeat to track host metrics as well. Or, you might be deploying your applications on EKS (Elastic Kubernetes Service) and as such can use fluentd to ship Kubernetes logs into ELK. Your application might be completely serverless, meaning you might be shipping Lambda invocation data available in CloudWatch to ELK via Kinesis.
Each AWS service makes different data available via different mediums. Each of these data sources can be tapped into using various methods. Here are some of the most common methods:
- S3 – most AWS services allow forwarding data to an S3 bucket. Logstash can then be used to pull the data from the S3 bucket in question.
- CloudWatch – CloudWatch is another AWS service that stores a lot of operational data. It allows sending data to S3 (see above) or streaming the data to a Lambda function or AWS Elasticsearch.
- Lambda – Lambda functions are being increasingly used as part of ELK pipelines. One usage example is using a Lambda to stream logs from CloudWatch into ELK via Kinesis.
- ELK-native shippers – Logstash and beats can be used to ship logs from EC2 machines into Elasticsearch. Fluentd is another common log aggregator used.
Application logs
Application logs are fundamental to any troubleshooting process. This has always been true — even for mainframe applications and those that are not cloud-based. With the pace at which instances are spawned and decommissioned, the only way to troubleshoot an issue is to first aggregate all of the application logs from all of the layers of an application. This enables you to follow transactions across all layers within an application’s code.
There are dozens of ways to ship application logs. Again, what method you end up using greatly depends on the application itself and how it is deployed on AWS.
For example, Java applications running on Linux-based EC2 instances can use Logstash or Filebeat or ship it directly from the application layer using a log4j appender via HTTPs/HTTP. Containerized applications will use a logging container or a logging driver to collect the stdout and stderrr output of containers and ship it to ELK. Applications orchestrated with Kubernetes will most likely use a fluentd dameonset for collecting logs from each node in the cluster.
Infrastructure logs
Everything that is not the proprietary application code itself can be considered as infrastructure logs. These include system logs, database logs, web server logs, network device logs, security device logs, and countless others.
Infrastructure logs can shed light on problems in the code that is running or supporting your application. Performance issues can be caused by overutilized or broken databases or web servers, so it is crucial to analyze these log files especially when correlated with the application logs.
For example, when troubleshooting performance issues ourselves, we’ve seen many cases in which the root cause was a Linux kernel issue. Overlooking such low-level logs can make forensics processes long and fruitless.
Shipping infrastructure logs is usually done with open source agents such as rsyslog, Logstash and Filebeat that read the relevant operating system files such as access logs, kern.log, and database events. You can read here about more methods to ship logs here. The same goes for metrics, with Metricbeat being the ELK-native metric collector to use.
AWS Service logs
As mentioned above, many AWS services generate useful data that can be used for monitoring and troubleshooting. Below are some examples, including ELB, CloudTrail, VPC, CloudFront, S3, Lambda, Route53 and GuardDuty.
ELB Logs
Elastic Load Balancers (ELB) allows AWS users to distribute traffic across EC2 instances. ELB access logs are one of the options users have to monitor and troubleshoot this traffic.
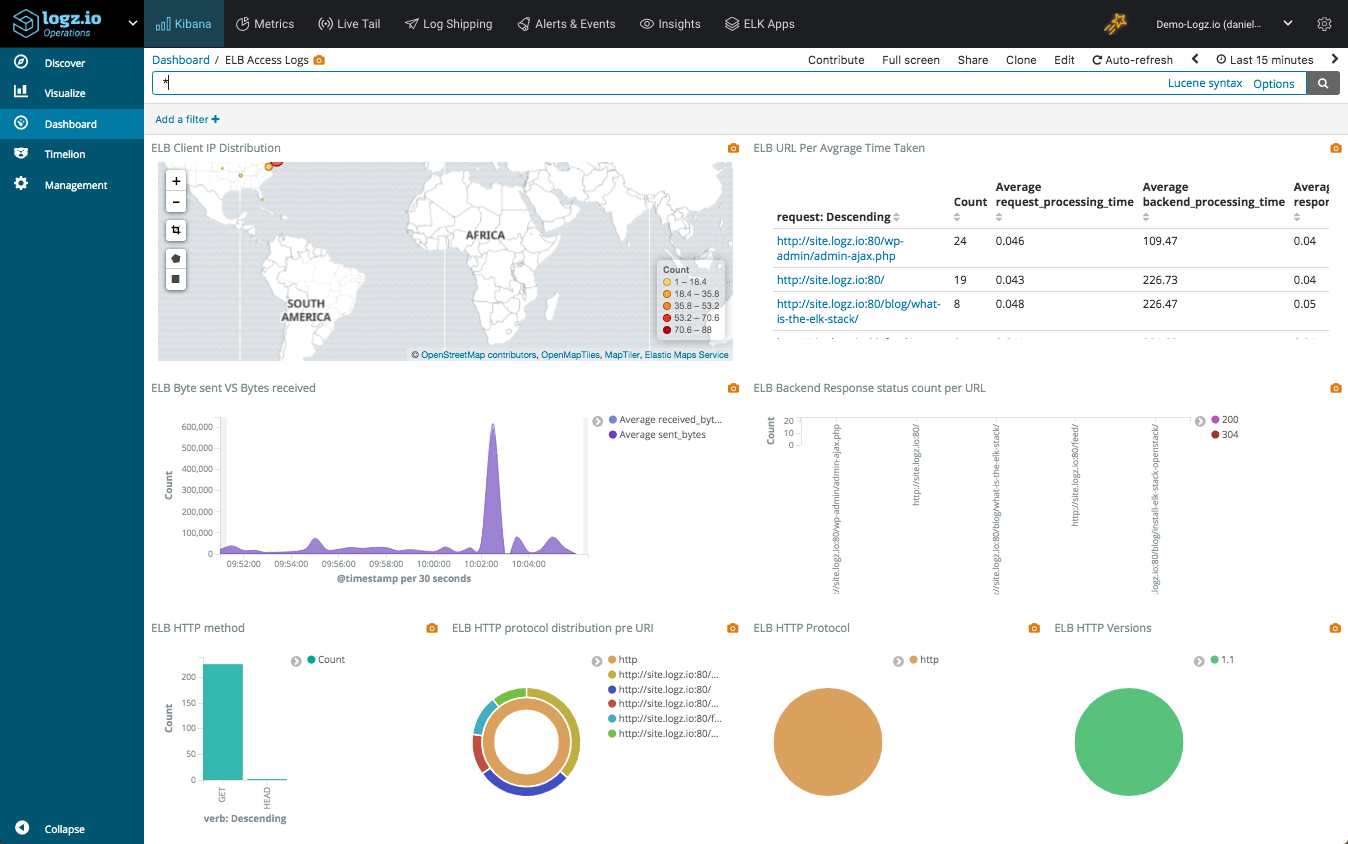
ELB access logs are collections of information on all the traffic running through the load balancers. This data includes from where the ELB was accessed, which internal machines were accessed, the identity of the requester (such as the operating system and browser), and additional metrics such as processing time and traffic volume.
ELB logs can be used for a variety of use cases — monitoring access logs, checking the operational health of the ELBs, and measuring their efficient operation, to name a few. In the context of operational health, you might want to determine if your traffic is being equally distributed amongst all internal servers. For operational efficiency, you might want to identify the volumes of access that you are getting from different locations in the world.
AWS allows you to ship ELB logs into an S3 bucket, and from there you can ingest them using any platform you choose. Read more about how to do this here.
CloudTrail logs
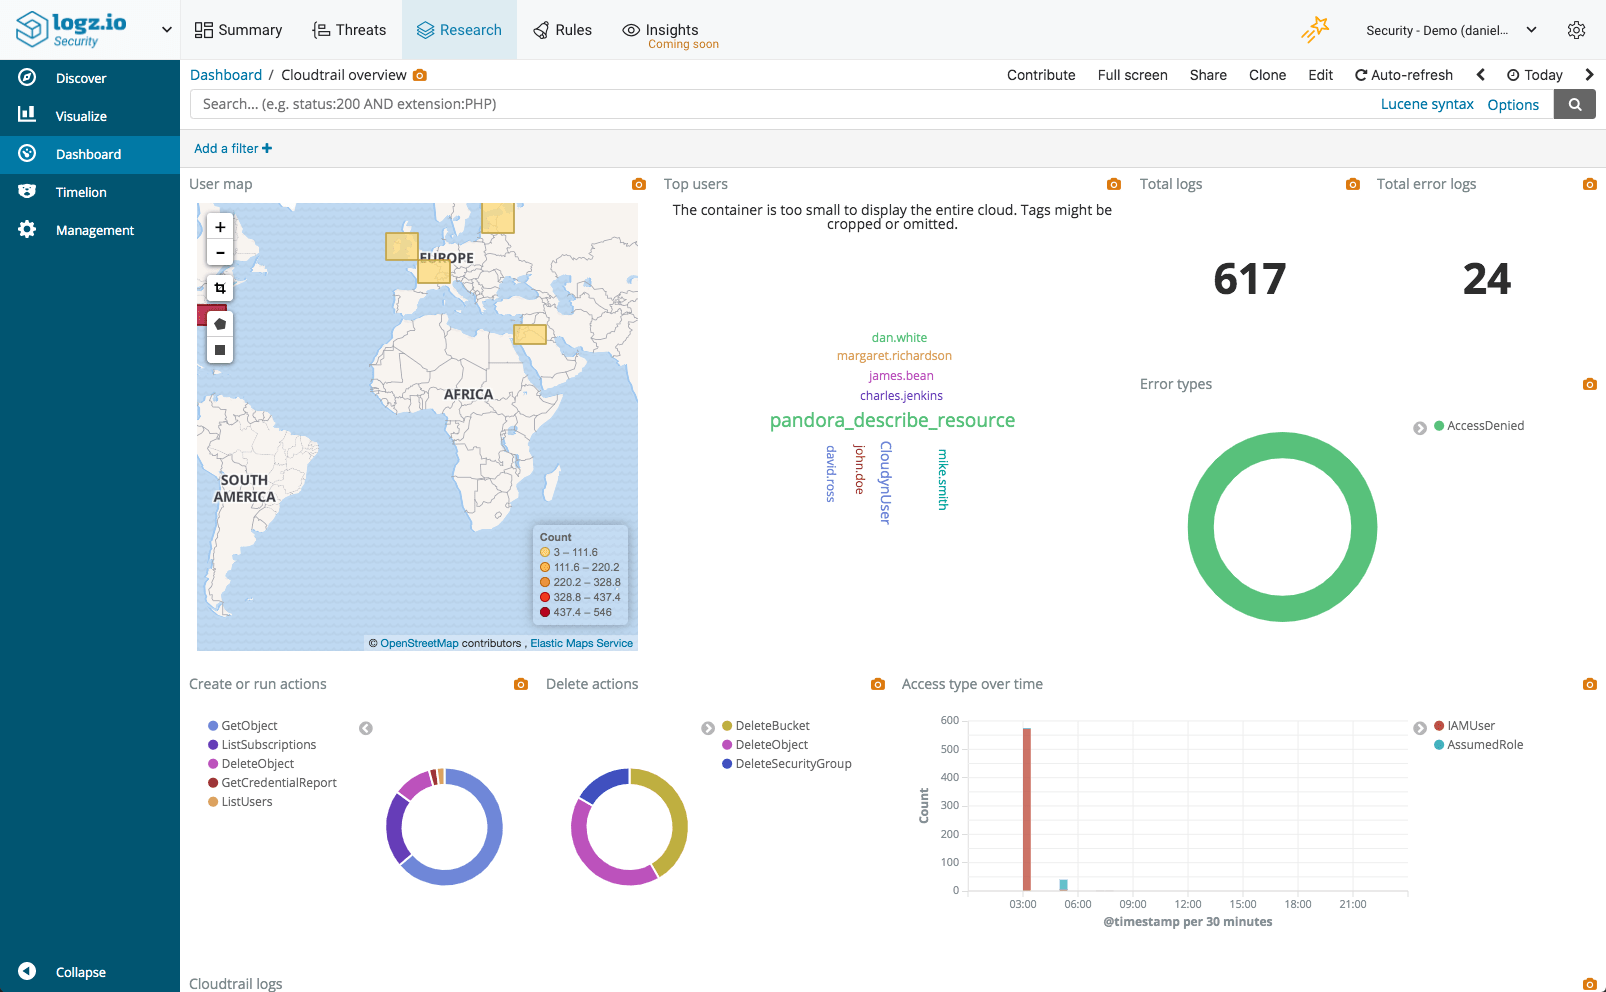
CloudTrail records all the activity in your AWS environment, allowing you to monitor who is doing what, when, and where. Every API call to an AWS account is logged by CloudTrail in real time. The information recorded includes the identity of the user, the time of the call, the source, the request parameters, and the returned components.
CloudTrail logs are very useful for a number of use cases. One of the main uses revolves around auditing and security. For example, we monitor access and receive internal alerts on suspicious activity in our environment. Two important things to remember: Keep track of any changes being done to security groups and VPC access levels, and monitor your machines and services to ensure that they are being used properly by the proper people.
By default, CloudTrail logs are aggregated per region and then redirected to an S3 bucket (compressed JSON files). You can then use the recorded logs to analyze calls and take action accordingly. Of course, you can access these logs on S3 directly but even a small AWS environment will generate hundreds of compressed log files every day which makes analyzing this data a real challenge.
You can read more about analyzing CloudTrail logs with the ELK Stack here.
AWS VPC Flow Logs
VPC flow logs provide the ability to log all of the traffic that happens within an AWS VPC (Virtual Private Cloud). The information captured includes information about allowed and denied traffic (based on security group and network ACL rules). It also includes source and destination IP addresses, ports, IANA protocol numbers, packet and byte counts, time intervals during which flows were observed, and actions (ACCEPT or REJECT).
VPC flow logs can be turned on for a specific VPC, VPC subnet, or an Elastic Network Interface (ENI). Most common uses are around the operability of the VPC. You can visualize rejection rates to identify configuration issues or system misuses, correlate flow increases in traffic to load in other parts of systems, and verify that only specific sets of servers are being accessed and belong to the VPC. You can also make sure the right ports are being accessed from the right servers and receive alerts whenever certain ports are being accessed.
Once enabled, VPC flow logs are stored in CloudWatch logs, and you can extract them to a third-party log analytics service via several methods. The two most common methods are to direct them to a Kinesis stream and dump them to S3 using a Lambda function.
You can read more about analyzing VPC flow logs with the ELK Stack here.
CloudFront Logs
CloudFront is AWS’s CDN, and CloundFront logs include information in W3C Extended Format and report all access to all objects by the CDN.
CloudFront logs are used mainly for analysis and verification of the operational efficiency of the CDN. You can see error rates through the CDN, from where is the CDN being accessed, and what percentage of traffic is being served by the CDN. These logs, though very verbose, can reveal a lot about the responsiveness of your website as customers navigate it.
Once enabled, CloudFront will write data to your S3 bucket every hour or so. You can then pull the CloudFront logs to ELK by pointing to the relevant S3 Bucket.
You can read more about analyzing CloudFront logs with the ELK Stack here.
S3 access logs
S3 access logs record events for every access of an S3 Bucket. Access data includes the identities of the entities accessing the bucket, the identities of buckets and their owners, and metrics on access time and turnaround time as well as the response codes that are returned.
Monitoring S3 access logs is a key part of securing AWS environments. You can determine from where and how buckets are being accessed and receive alerts on illegal access of your buckets. You can also leverage the information to receive performance metrics and analyses on such access to ensure that overall application response times are being properly monitored.
Once enabled, S3 access logs are written to an S3 bucket of your choice. Similar to the other AWS service logs described above, you can then pull the S3 access logs to the ELK Stack by pointing to the relevant S3 Bucket.
Lambda logs and metrics
Lambda is a serverless computing service provided by AWS that runs code in response to events and automatically manages the computing resources required by that code for the developer.
Lambda functions automatically export a series of metrics to CloudWatch and can be configured to log as well to the same destination. Together, this data can help in gaining insight into the individual invocations of the functions.
Shipping the data from the relevant CloudWatch log group into the ELK Stack can be done with either of the methods already explained here — either via S3 or another Lambda function.
Route 53 logs
Route 53 is Amazon’s Domain Name System (DNS) service. Route 53 allows users to not only route traffic to application resources or AWS services, but also register domain names and perform health checks.
Route 53 allows users to log DNS queries routed by Route 53. Once enabled, this feature will forward Route 53 query logs to CloudWatch, where users can search, export or archive the data. This is useful for a number of use cases, primarily troubleshooting but also security and business intelligence.
Once in CloudWatch, Route 53 query logs can be exported to an AWS storage or streaming service such as S3 or Kinesis. Another option is to use a 3rd party platform, and this article will explore the option of exporting the logs into the ELK Stack.
You can read more about analyzing Route 53 logs with the ELK Stack here.
GuardDuty logs
AWS GuardDuty is a security service that monitors your AWS environment and identifies malicious or unauthorized activity. It does this by analyzing the data generated by various AWS data sources, such as VPC Flow Logs or CloudTrail events, and correlating it with thread feeds. The results of this analysis are security findings such as bitcoin mining or unauthorized instance deployments.
Your AWS account is only one component you have to watch in order to secure a modern IT environment and so GuardDuty is only one part of a more complicated security puzzle that we need to decipher. That’s where security analytics solutions come into the picture, helping to connect the dots and provide a more holistic view.
GuardDuty ships data automatically into CloudWatch. To ship this data into the ELK Stack, you can use any of the same methods already outlined here — either via S3 and then Logstash, or using a Lambda function via Kinesis or directly into ELK. This article explains how to ship GuardDuty data into Logz.io’s ELK Stack using the latter.
Summing it up
ELK is an extremely powerful platform and can provide tremendous value when you invest the effort to generate a holistic view of your environment. When running your applications on AWS, the majority of infrastructure and application logs can be shipped into the ELK Stack using ELK-native shippers such as Filebeat and Logstash whereas AWS service logs can be shipped into the ELK Stack using either S3 or a Lambda shipper.
Of course, collecting the data and shipping it into the ELK Stack is only one piece of the puzzle. Some logs are JSON formatted and require little if no extra processing, but some will require extra parsing with Logstash. You can even handle processing with Lambda. Either way, parsing is a crucial element in centralized logging and one that should not be overlooked.
In addition to parsing, logging AWS with the ELK Stack involves storing a large amount of data. This introduces a whole new set of challenges — scaling Elasticsearch, ensuring pipelines are resilient, providing high availability, and so forth. To understand what it takes to run an ELK Stack at scale, I recommend you take a look at our ELK guide.
Logz.io provides a fully managed ELK service, with full support for AWS monitoring, troubleshooting and security use cases. The service includes built-in integrations for AWS services, canned monitoring dashboards, alerting, and advanced analytics tools based on machine learning.

