Running Telegraf as Serverless on AWS Lambda for Monitoring Your Cloud
August 9, 2021

Telegraf is one of the coolest open source agents for collecting metrics. It’s part of the TICK Stack (Telegraf, Influx, Chronograf and Kapacitor) and with Telegraf you can collect metrics from a wide array of inputs and write them into a wide array of outputs. It is plugin-driven for both collection and output of data so it is easily extendable. By using its over 200 plugins written by subject matter experts on the data in the community, you can easily start collecting metrics from your endpoints and send them to almost any observability platform
As many companies are moving towards serverless architecture there is a need to also run a Telegraf agent as a serverless solution to collect metrics from different SaaS applications and send them to your preferred observability platform.
From August 2020 Amazon Lambda supports custom runtimes, which enables users to run their code in any programming language they choose. In this article, we will use it to easily write bash code to run our Telegraf on a Lambda function.
Let’s see how we can do it.
1. Creating a Telegraf Lambda Layer
Since the Telegraf agent is a binary, the best practice is to save it as a different layer.
First, we need to download the Telegraf agent and extract the TAR file into a folder of our choice.
We start by creating our own ZIP file, which we upload to AWS as a layer. To comply with AWS requirements, we need to move the Telegraf binary into a dedicated “bin” directory and then zip this folder. As Lambda is running on Amazon Linux 2, we will need to download the Linux amd64 version.
At the time of the writing of this post, there is a bug in Telegraf version 19, which limits its running on serverless architecture. Therefore on this post we’ll use version 18.
wget https://dl.influxdata.com/telegraf/releases/telegraf-1.18.3_linux_amd64.tar.gz
tar xf telegraf-1.18.3_linux_amd64.tar.gz
mkdir bin
cp ./telegraf-1.18.3/usr/bin/telegraf ./bin
zip telegraf ./bin/*
Now, let’s create a new layer and call it “telegraf.” On the AWS portal, go to AWS Lambda –> Layers and create a new layer.

Set the Name to “telegraf”, upload the telegraf.zip we created in the previous step, and finally choose Custom runtime. This may take some time to upload as the ZIP file is almost 30 MB.

Save the ARN value, as we will need it later in the setup process.

2. Create a Custom Runtime Function
We will follow the AWS tutorial on Lambda custom runtimes and need two files:
bootstrap
#!/bin/sh

set -euo pipefail

# Initialization - load function handler
source $LAMBDA_TASK_ROOT/"$(echo $_HANDLER | cut -d. -f1).sh"

# Processing
while true
do
  HEADERS="$(mktemp)"
  # Get an event. The HTTP request will block until one is received
  EVENT_DATA=$(curl -sS -LD "$HEADERS" -X GET "http://${AWS_LAMBDA_RUNTIME_API}/2018-06-01/runtime/invocation/next")

  # Extract request ID by scraping response headers received above
  REQUEST_ID=$(grep -Fi Lambda-Runtime-Aws-Request-Id "$HEADERS" | tr -d '[:space:]' | cut -d: -f2)

  # Run the handler function from the script
  RESPONSE=$($(echo "$_HANDLER" | cut -d. -f2) "$EVENT_DATA")

  # Send the response
  curl -X POST "http://${AWS_LAMBDA_RUNTIME_API}/2018-06-01/runtime/invocation/$REQUEST_ID/response"  -d "$RESPONSE"
done
Function.sh
function handler () {
  set -e

  EVENT_DATA=$1

  COPY_TELEGRAF=$(cp /opt/bin/telegraf /tmp/telegraf)

  SET_PERMISSIONS=$(chmod 755 /tmp/telegraf)

  RUN_TELEGRAF=$(/tmp/telegraf  --config telegraf.conf --once)

}
A nice feature released in Telegraf version 1.15 is the “once” flag, which enables Telegraf to run the entire pipeline only once and then exit.
3. Setting Telegraf Configuration
The last piece of the puzzle is the Telegraf config. For this demonstration, we will use outputs.http to send the metrics to Logz.io’s Infrastructure Monitoring SaaS, but you can use any output you like (if you don’t have a Logz.io account, you can start for free here). For simplicity, we will also only set one input – memory.
telegraf.conf
[agent]
  ## Default data collection interval for all inputs
  interval = "10s"
  ## Rounds collection interval to 'interval'
  ## ie, if interval="10s" then always collect on :00, :10, :20, etc.
  round_interval = true

  ## Telegraf will send metrics to outputs in batches of at most
  ## metric_batch_size metrics.
  ## This controls the size of writes that Telegraf sends to output plugins.
  metric_batch_size = 1000

  ## Maximum number of unwritten metrics per output.  Increasing this value
  ## allows for longer periods of output downtime without dropping metrics at the
  ## cost of higher maximum memory usage.
  metric_buffer_limit = 10000

  ## Collection jitter is used to jitter the collection by a random amount.
  ## Each plugin will sleep for a random time within jitter before collecting.
  ## This can be used to avoid many plugins querying things like sysfs at the
  ## same time, which can have a measurable effect on the system.
  collection_jitter = "0s"

  ## Default flushing interval for all outputs. Maximum flush_interval will be
  ## flush_interval + flush_jitter
  flush_interval = "10s"
  ## Jitter the flush interval by a random amount. This is primarily to avoid
  ## large write spikes for users running a large number of telegraf instances.
  ## ie, a jitter of 5s and interval 10s means flushes will happen every 10-15s
  flush_jitter = "0s"

  ## By default or when set to "0s", precision will be set to the same
  ## timestamp order as the collection interval, with the maximum being 1s.
  ##   ie, when interval = "10s", precision will be "1s"
  ##       when interval = "250ms", precision will be "1ms"
  ## Precision will NOT be used for service inputs. It is up to each individual
  ## service input to set the timestamp at the appropriate precision.
  ## Valid time units are "ns", "us" (or "µs"), "ms", "s".
  precision = ""

  ## Log at debug level.
  debug = true
  ## Log only error level messages.
  # quiet = false

  ## Log target controls the destination for logs and can be one of "file",
  ## "stderr" or, on Windows, "eventlog".  When set to "file", the output file
  ## is determined by the "logfile" setting.
  # logtarget = "file"

  ## Name of the file to be logged to when using the "file" logtarget.  If set to
  ## the empty string then logs are written to stderr.
  # logfile = ""

  ## The logfile will be rotated after the time interval specified.  When set
  ## to 0 no time based rotation is performed.  Logs are rotated only when
  ## written to, if there is no log activity rotation may be delayed.
  # logfile_rotation_interval = "0d"

  ## The logfile will be rotated when it becomes larger than the specified
  ## size.  When set to 0 no size based rotation is performed.
  # logfile_rotation_max_size = "0MB"

  ## Override default hostname, if empty use os.Hostname()
  hostname = "Lambda"

# Read metrics about memory usage
[[inputs.mem]]
  # no configuration

[[outputs.http]]
  url = "https://listener.logz.io:8053"
  data_format = "prometheusremotewrite"
  [outputs.http.headers]
     Content-Type = "application/x-protobuf"
     Content-Encoding = "snappy"
     X-Prometheus-Remote-Write-Version = "0.1.0"
     Authorization = "Bearer <<LOGZIO TOKEN>>"
Since we are running on Lambda and we don’t really have a host name, I set the host name to “Lambda” to easily query the metrics.
Now that we have all the ingredients, let’s start baking the cake.
4. Running our Serverless Telegraf
First, create a ZIP file containing all the files we have prepared previously:
bootstrapfunction.shtelegraf.conf
Zip function bootstrap function.sh telegraf.confNext, create a new Lambda:

After that, set the function name to “serverless_telegraf” and choose “Provide your own bootstrap on Amazon Linux 2”.
Now, upload the function.zip we created in the previous step.
After you’ve uploaded function.zip, go to Runtime settings. Direct the Hander to our handler (function.handler). By default, the function handler will be pointing to hello.handler.

Then, add the Telegraf layer we created in the previous step.

Under configuration, set the timeout to 2 min and the memory to 512 MB.

And that’s it.

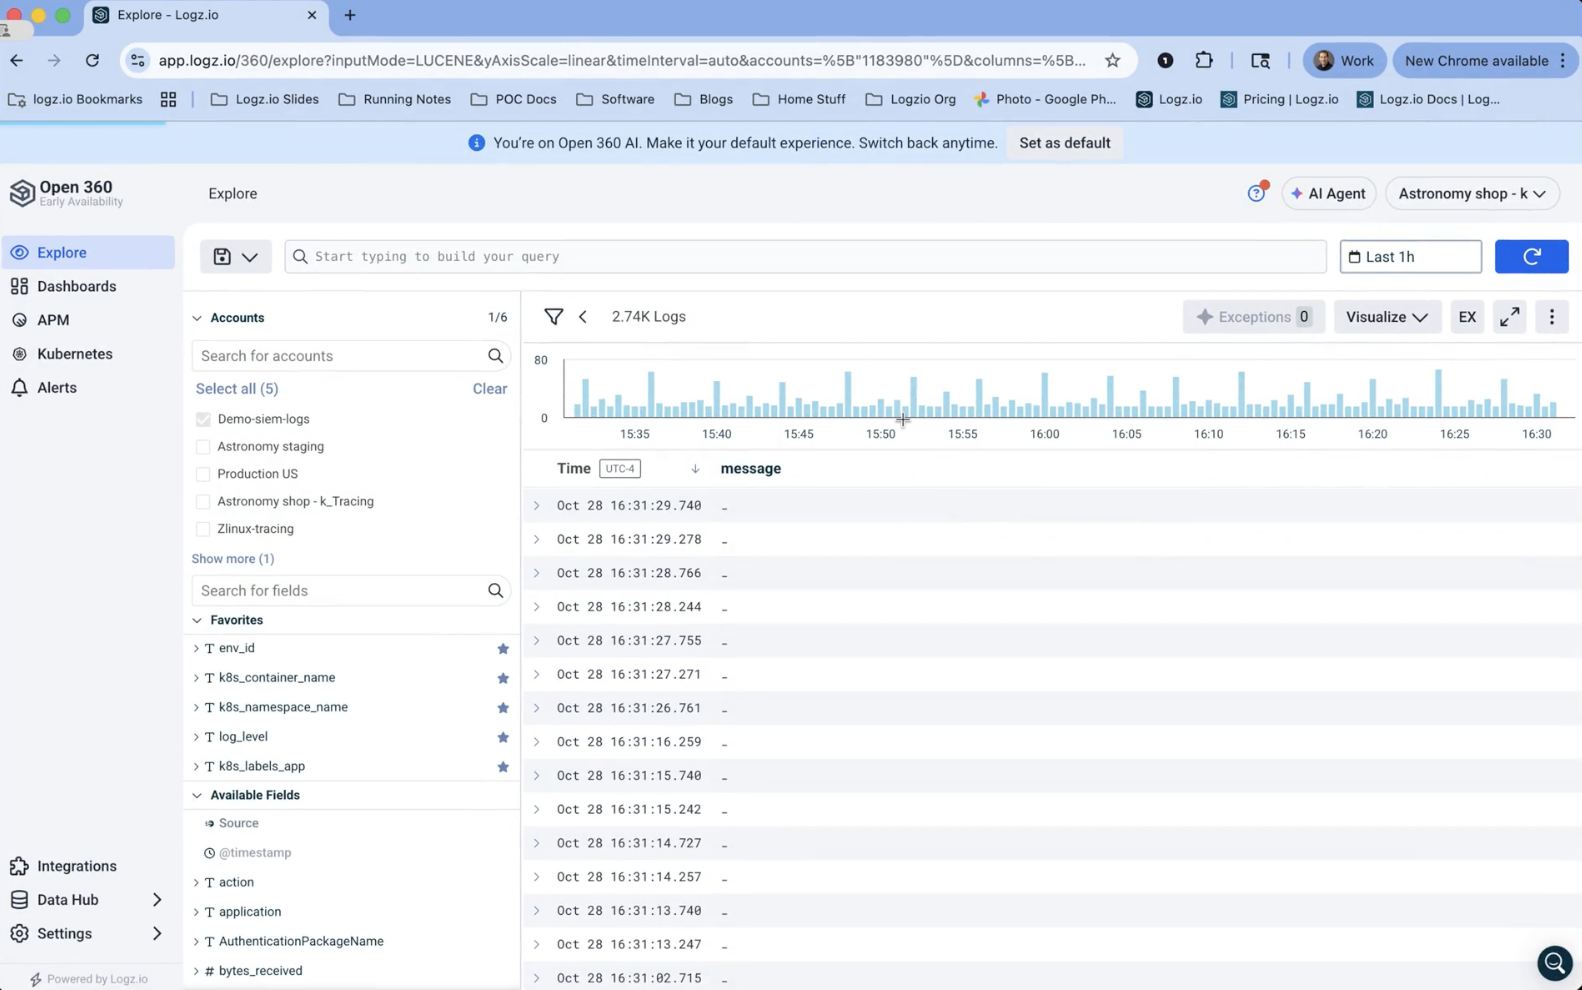
5. Visualizing the Metrics
Once we have successfully started sending the metrics, we can go to our monitoring tool and visualize them; in our case, on Logz.io.


Going Forward
As you can see, running Telegraf as a serverless job on AWS Lambda is an easy thing to do. It allows you to monitor your cloud workload without having to deploy a dedicated instance for running Telegraf itself. If you’re looking to monitor your Lambda workloads themselves, such as your functions’ invocation, performance and concurrence metrics, then check out this post.
Now that we can run Telegaf on Lambda the possibilities are endless. In the next blog, we will demonstrate how to leverage this capability to easily build your own Synthetic Monitoring solution.

You Might Also Like

Tips and Tricks for the Small SOC:
Part I