Top 10 Mistakes People Make When Building Observability Dashboards
September 19, 2023
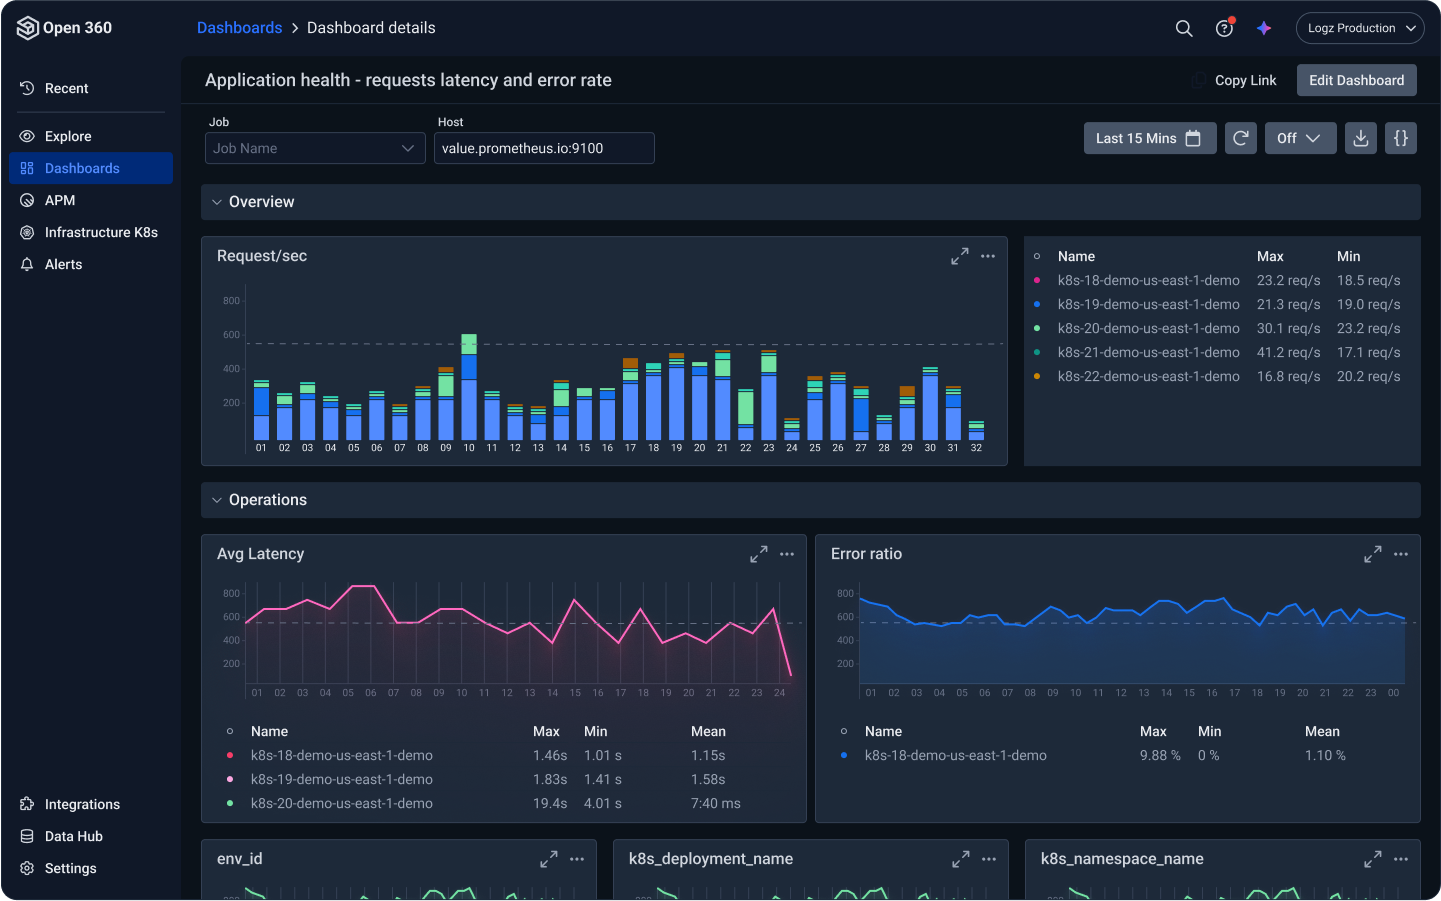
Observability dashboards are powerful tools that enable teams to visualize and monitor the performance, health, and behavior of their applications and infrastructure.
However, building observability dashboards is not a straightforward task, and many organizations make common mistakes hindering their ability to gain meaningful insights and respond to issues effectively.
As the provider of the Logz.io Open 360™ platform for essential observability, we’ve seen the good, the bad and the ugly of dashboard setups, so we’re happy to impart some wisdom on this topic so you don’t repeat the mistakes of others.
Let’s explore the top mistakes people make when building observability dashboards and offer guidance on how to avoid them.
Lack of Clear Objectives for Dashboards
One of the most common mistakes organizations make when building observability dashboards is not defining clear objectives. Without a clear understanding of what you want to achieve with your dashboards, you risk creating a cluttered and unfocused monitoring environment.
Before you start designing your dashboards, ask yourself what questions you need to answer and what metrics are essential for your specific use case. Define your objectives and use them as a guiding principle throughout the dashboard creation process.
Overloading Dashboards with Metrics
More is not always better when it comes to observability dashboards. Overloading them with too many visualizations can lead to information overload, making it challenging to identify critical issues quickly.
Instead, focus on displaying the most relevant and actionable data that aligns with your defined objectives. Be selective about the metrics you include and use thoughtful design to ensure clarity and simplicity.
Google writes about the four golden signals of monitoring here: latency, traffic, errors and saturation. You may be in a situation where you can only keep tabs on a select number of metrics for your system—metrics measuring these signals are where you should consider focusing.
Neglecting User Experience
User experience (UX) is often overlooked when building observability dashboards. They can be difficult to navigate or understand, can frustrate users and hinder their ability to make informed decisions.
Be sure to choose the right type of visualization for the specific data you’re monitoring. This is critical for deriving the right kind of insights from the data so you can take action when needed.
Pay attention to the design and layout of your dashboards, ensuring they are intuitive and user-friendly. Put yourself in the shoes of the end user and think about what they would want to see. Consider user feedback and iterate on your dashboard designs to improve the overall UX continually.
Lack of Contextual Information
A common mistake is presenting metrics without sufficient contextual information. Metrics alone may not provide a complete picture of the situation.
It’s essential to include additional context, such as event logs, error messages, or adding deployments to dashboards in the form of annotations, to help users understand the significance of a particular data point or trend. Providing context makes it easier to diagnose and troubleshoot issues effectively and gives the end user the fullest picture possible of the data.
Practitioners should also consider the importance of correlating logs and traces for providing contextual information. Doing this gives you access to details of anomalies like error messages or stack traces.
Failure to Set the Correct Alerts and Thresholds
Observability dashboards should not be passive tools; they should actively notify you of issues and anomalies. Many organizations make the mistake of not setting up the correct alerts and thresholds here.
Google defines the following attributes as being critical to follow when evaluating an alerting strategy: precision, recall, detection time and reset time.
Without proper alerting, you risk missing critical incidents or reacting too late, causing service disruptions and potentially a loss of revenue for your business. Define alerting rules based on your objectives and set appropriate thresholds to trigger notifications when something goes wrong.
Neglecting Data Aggregation and Retention
Data aggregation and retention policies are often overlooked but are essential for effective observability. Storing and aggregating data at the right granularity is crucial to avoid overwhelming your monitoring system with unnecessary details and driving up your costs, potentially.
Define data retention policies that align with your objectives and use appropriate data aggregation techniques to ensure your dashboards remain performant and relevant.
Lack of Collaboration
Observability is a team effort, and collaboration is key to success. Building dashboards in isolation without input from other teams or stakeholders can lead to blind spots and missed opportunities for improvement.
Engage with various teams, including developers, operations, and business stakeholders, to gather their input and requirements when designing observability dashboards. Collaboration ensures that your dashboards address the needs of all relevant parties.
Ignoring Historical Data
Observability is not just about real-time monitoring; historical data can provide valuable insights into long-term trends and patterns. Many organizations make the mistake of focusing solely on current data and neglecting historical data storage and analysis.
Incorporate historical data into your observability dashboards to identify trends, forecast future issues, and make data-driven decisions based on past performance.
Not Utilizing Data Rollups as Part of Your Strategy Scalability
As your applications and infrastructure grow, so does the volume of observability data generated. Failing to consider scalability, and the data you monitor in dashboards that are actually important as you scale, can lead to performance issues and increased operational costs.
You can compact and discard some of your metrics as it ages to focus on the data that matters. Rollups let you aggregate many time series by excluding labels, optimizing your costs and performance. You can reduce costs and improve performance on queries you run often.
Skipping Regular Maintenance
Observability dashboards are not a set-and-forget solution. Many organizations make the mistake of neglecting regular maintenance and updates. Over time, data sources, objectives, and user requirements may change, making it necessary to adapt and refine your dashboards.
Establish a maintenance schedule to review and update your dashboards to ensure they remain relevant and effective.
Avoiding these common mistakes can help your organization harness the power of observability to detect and respond to issues more effectively. To learn more about how the right dashboards can help you in your observability journey, sign up for a free trial of Logz.io Open 360 today.


