
How to Build a SIEM Dashboard for AWS Using the ELK Stack
April 26, 2016
In 2016, it’s crucial that you keep your services secure and prevent unauthorized access to your systems and data. In 2011, Sony was hacked and had its PlayStation network completely shut down, resulting in a loss of $171 million for the company. In 2015, Anthem had 80 million patient and employee records exposed, and in the process, the company learned the valuable lesson of not relying solely on perimeter security. So, what could have prevented these malicious attacks?
In this article, I’ll introduce Security Information and Event Management (SIEM) and guide you the step-by-step process of using Elasticsearch, Logstash, and Kibana (the ELK Stack) and the Amazon cloud to build your own SIEM solution.
The SIEM Approach to Security
SIEM is an approach to enterprise security management that seeks to provide a holistic view of an organization’s IT security. The main purpose of SIEM is to provide a simultaneous and comprehensive view of your IT security. The SIEM approach includes a consolidated dashboard that allows you to identify activity, trends, and patterns easily. If implemented correctly, SIEM can prevent legitimate threats by identifying them early, monitor online activity, provide compliance reports, and support incident-response teams.
More on the subject:
Although I’ll mostly be specifically discussing SEM (Security Event Management) within this article, it’s important to know that SIEM is the combination of SEM and SIM (Security Information Management) functions into one concise security management system. SEM features enable your security to detect and protect threats quickly with its real-time analysis and ability to centralize the storage and interpretation of logs. SIM is capable of providing automatic reporting and collecting information into one concise location.
Advanced Threat Protection
Advanced malware can easily bypass traditional protection solutions and infect hosts. When malware begins its malicious activity, the behavior analytics inside SIEM will detect these activities and raise an alert.
One particularly dangerous threat is a “denial of service” (DoS) attack, which is designed to bring your services down. By aggregating metrics and visualizing critical data, SIEM dashboards can help to detect any traffic deviation on hosts that are under-monitored. Other SIEM capabilities include additional threat protection against threats such as unauthorized access to sensitive data and user accounts performing actions for which they do not have the required level of permissions.
SIEM Dashboard for AWS Monitoring
With AWS CloudTrail, you can monitor AWS API calls of your account. The received logs contain the identities of API callers, the times of the API calls, the source IP addresses, and other information related to the request. The information that CloudTrail provides is good for monitoring your accounts and receiving alerts of suspicious activity (such as a high number of incomplete logins).
In the following sections, we will build an example SIEM dashboard for an AWS cloud environment with CloudTrail and VPC Flow logs.
To build the dashboard, we will use Logz.io, our enterprise-grade ELK-as-a-Service cloud platform, and leverage its native integration with the AWS platform. If you do not have a Logz.io account, you can start a free trial here.
Shipping the Logs
Once you’ve enabled logs for ELB and VPC using CloudTrail and VPC Flow logs — enabling logs for these services can be found in the AWS VPC guide, AWS CloudTrail guide and AWS ELB guide — the generated log data is stored within dedicated AWS S3 buckets and will then be transferred into the Logz.io platform. To do this, log into your Logz.io account and select the Log Shipping tab. From the menu on the left, open the AWS section and select the CloudTrail and ELB options.
Shipping The CloudTrail Logs
As shown below, configuring Logz.io to read CloudTrail/ELB logs is pretty straightforward.
First, you have to add the CloudTrail bucket from which Logz.io will read the logs and ship them to Elasticsearch. Adding the CloudTrail bucket can be done by clicking Add CloudTrail bucket. After you fill in the required fields, click Save, and the logs will be shipped from the S3 Bucket:

In our case, the CloudTrail S3 bucket name is cloudtraillogs. The prefix field is not required, so you can leave it empty (Logz.io will fill it in for you). Shipping other types of AWS logs from this section is identical to any other AWS service, except for the VPC flow logs which we describe in detail in the section below.
Shipping the VPC flow logs
Shipping the VPC flow graph does not follow the same steps as other services because AWS does not ship the logs to an S3 bucket by default. There are several ways to export the VPC flow logs to S3. This can be done using the AWS CloudWatch service.
Note that before exporting VPC logs into a dedicated S3 bucket, you have to configure the required permissions that will allow CloudWatch to use that bucket. The permissions for the bucket can be configured within the Amazon S3 dashboard. Under the Permissions section, there is an Add bucket policy button that will allow you to enter the policy JSON for the exported logs from VPC (learn how to set an S3 bucket permissions):
{"Version":"2012-10-17","Statement":[{"Action":"s3:GetBucketAcl","Effect":"Allow","Resource":"arn:aws:s3:::<bucket name>","Principal":{"Service":"logs.<region>.amazonaws.com"}},{"Action":"s3:PutObject","Effect":"Allow","Resource":"arn:aws:s3:::<bucket name>\/*","Condition":{"StringEquals":{"s3:x-amz-acl":"bucket-owner-full-control"}},"Principal":{"Service":"logs.<region>.amazonaws.com"}}]}
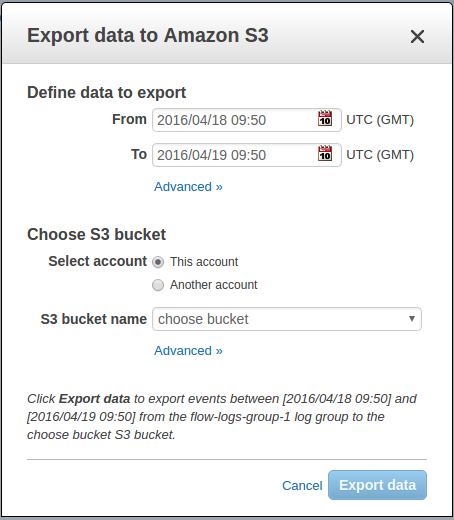
Once you are granted permission, go to your CloudWatch settings and execute the Export data to Amazon S3 action:

As shown below, the modal window — which appears after you click on an action item for exporting the logs to Amazon S3 — allows you to select the time range for the S3 bucket export:
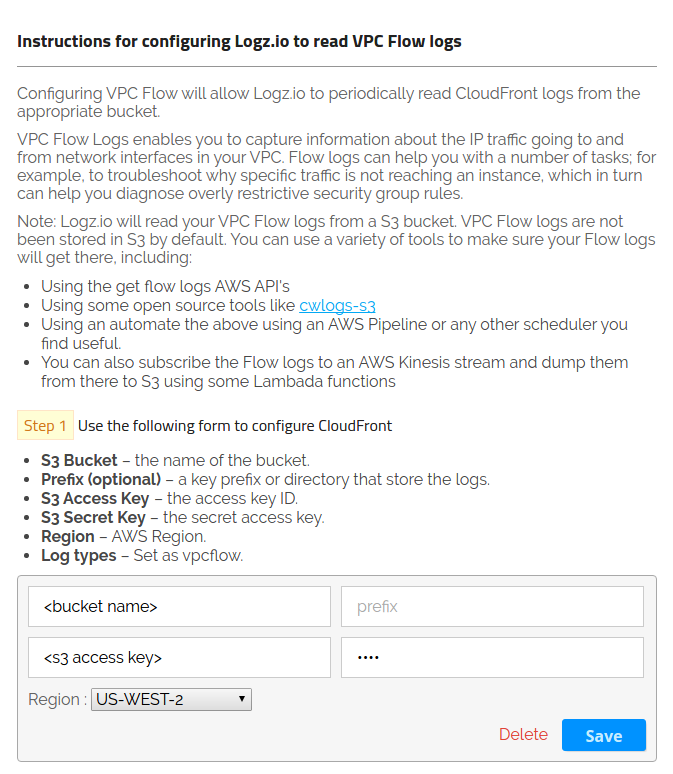
The VPC flow logs are now stored and can be shipped to Elasticsearch. The configuration method of log shipping in the Logz.io portal is identical to what we did for CloudTrail. Under the AWS section on the left side, select VPC, click on Add S3 Bucket, and then enter the required S3 parameters:
In addition to importing logs from ELB and CloudTrail, Logz.io also supports the shipping of logs from S3 Bucket logs and the monitoring of S3 access, the settings of which are located in the same section as the CloudTrail and the ELB.
Building the dashboard
The first item in any SIEM dashboard is a general overview of the entire environment that can include aggregated information such as the number of events and their distribution over time.
But what else should you add to your dashboard? Ask yourself: “What exactly do we consider necessary for security monitoring within our system?” CloudTrail, VPC flow logs, S3 access logs, and ELB logs are just a few of the things that can be added so that you can monitor for many different types of threats that can endanger your systems.
Of course, we can assume that each line of log generated by the data sources is an event such as a failed login, a mechanical connection, or a GET HTTP request.
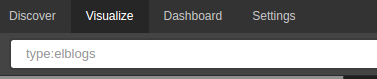
The first step within Logz.io is to show the number of events within a specified date range. Creating this type of chart is easy and can be done if you go to the Logz.io Visualize tab, choose the Metric chart and type in the Search field:
type:elblogs
This will show you the number of events within the specified date range:
The metric chart for other trackable logs is straightforward, and the search field only differs in the term entered after “:”, so for CloudTrail it will look like type:cloudtrail.
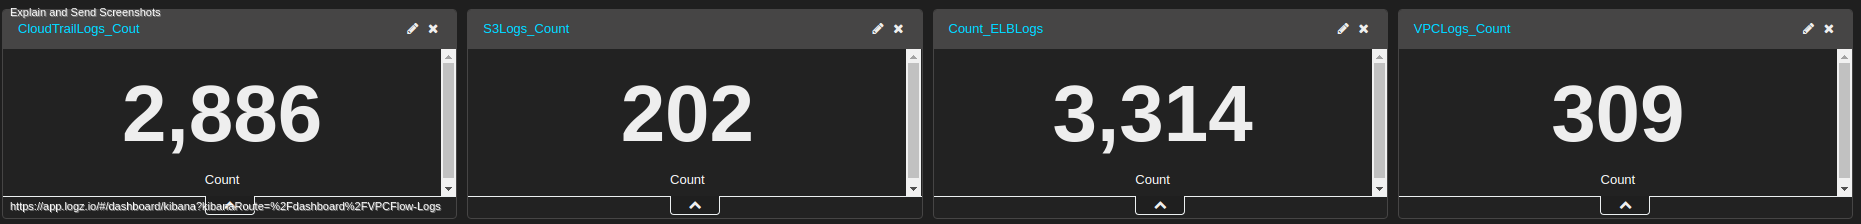
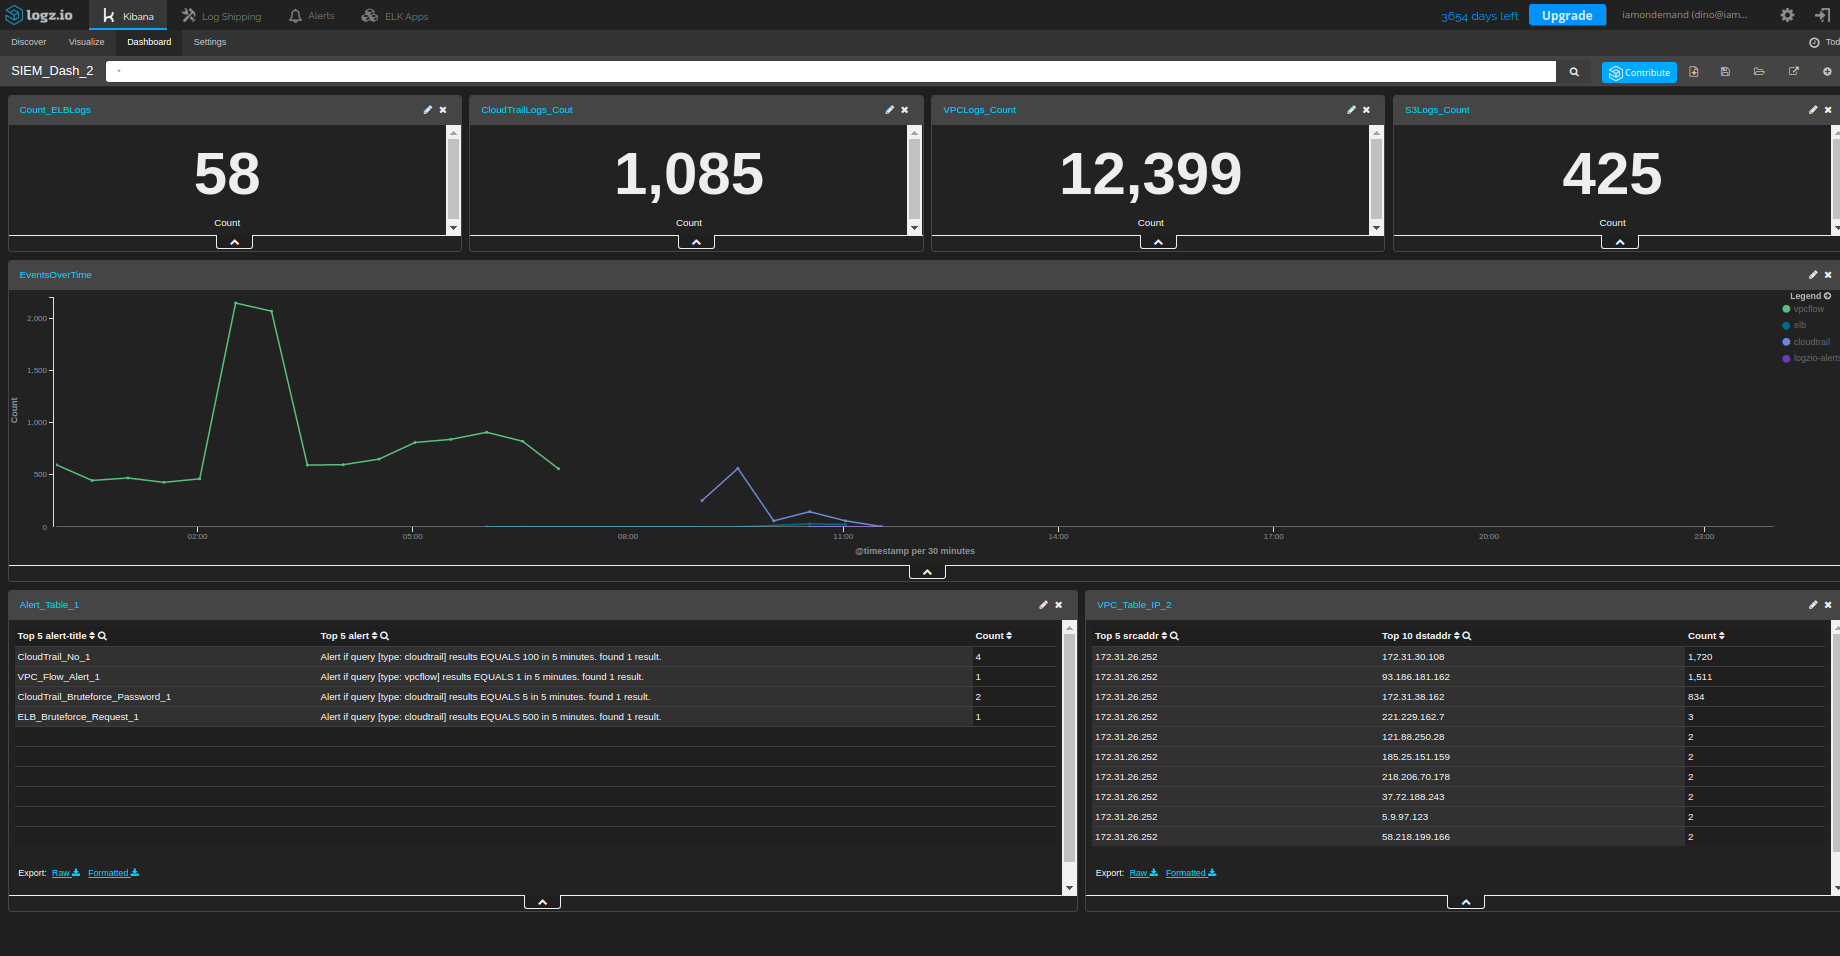
The final dashboard of the aggregated metrics of all of the logs will look like this:

In addition, we have VPC flow logs, which contain information on the traffic source IPs. This valuable information will help you to monitor external threats. Adding an IP log table to your dashboard can be done with Visualize and using aggregation against the source and destination address:
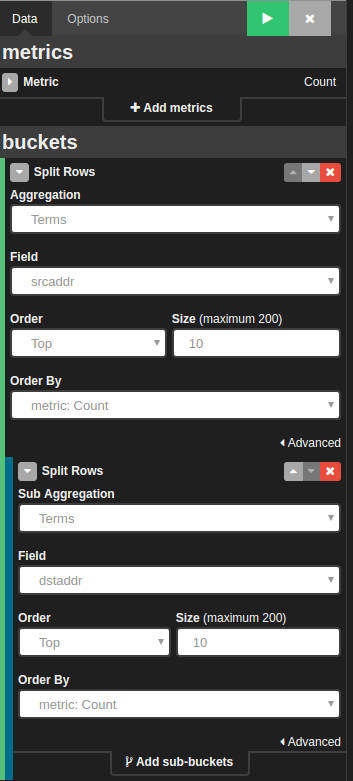
The result:

Creating Rule-Based Alerts
To build a SIEM system, you need to be able to define the baseline normal behavior of a system to be able to detect and alert on abnormal activities. Logz.io allows you to define rule-based alerts within Kibana’s Discover section. The alert dialog allows you to define different rules based on specific system parameters. These alerts can be in the form of e-mails or even calls to third-party APIs in order to trigger an action.
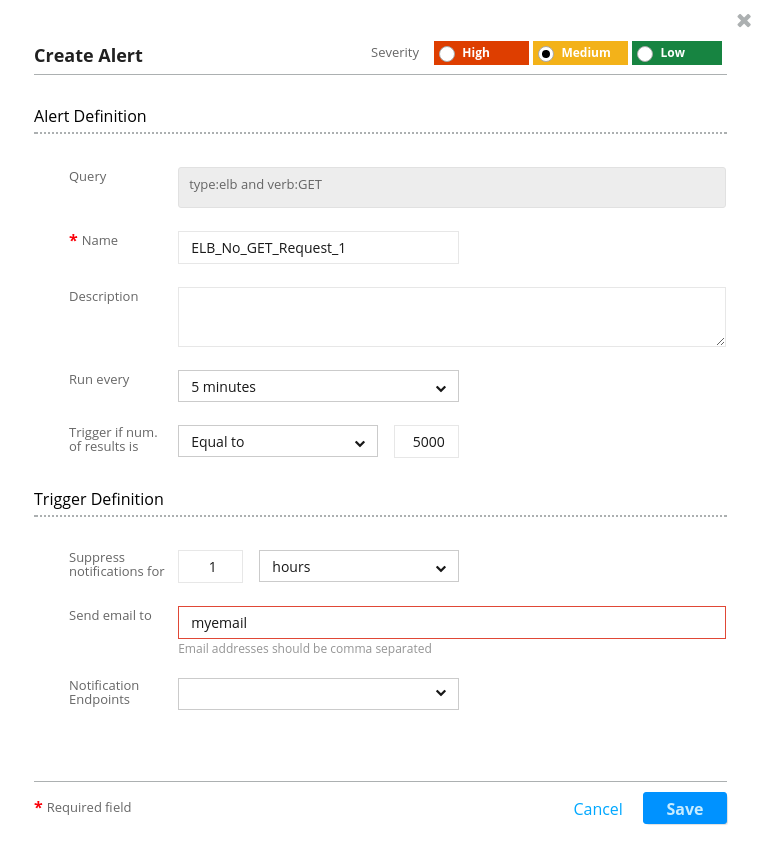
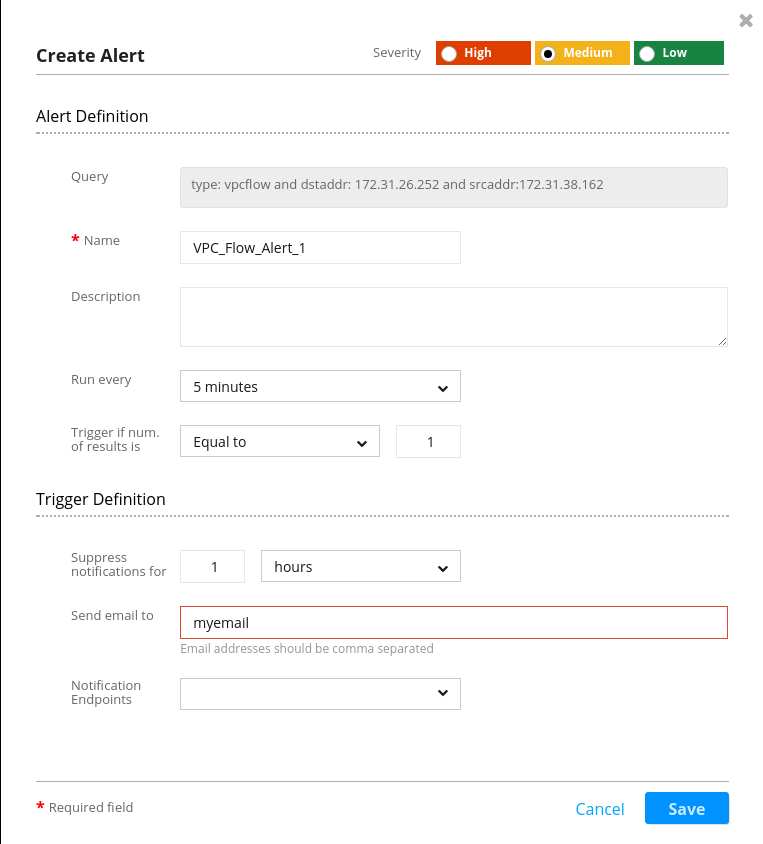
The first alert that we will create will be based on the number of requests to the ELB. This alert will trigger if the number of GET requests passes a defined threshold.
To create the alert under Kibana’s Discover section, enter the query that will trigger the alert and then click on the button Create Alert. In the example below, we have created an alert that will track the number of GET requests from an ELB instance (before starting to query the logs using the search bar under Discover section, it will be beneficial to first read about Lucene query syntax):
With the same logic, we can create alerts for VPC flow logs for whenever a specific traffic source connects with our system. (This enables Logz.io users to create rules based on certain IP whitelists or blacklists.) The creation of this alert is shown in the picture below:
Adding the Alerts to the Dashboard
The last piece of our dashboard is a table that contains a list of the alerts that have been triggered. To create this table, query for _exists_:alert and point to the fields that you want to see within the table.
The configuration for the table is shown in the picture below. Getting the list of triggered alerts on the dashboard is very important in order to get an overview of the system behavior history, gage the severity of the events taking place in your environment, and understanding what next steps are needed:
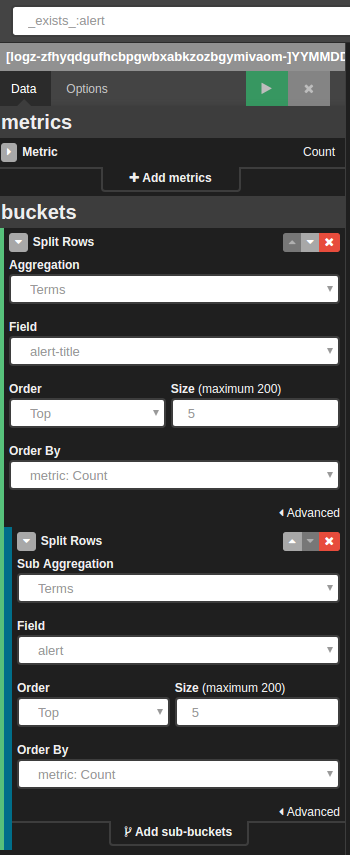
The configuration of the table chart

The result table of the query for the list of triggered alerts
After adding the last piece, here is the final version of the SIEM dashboard:
In this guide, I have described how to set up a SIEM dashboard with the ELK Stack and how it can help to protect your online resources. Taking into account the massive losses that several large enterprises have incurred, it’s clear that protecting your resources with threat intelligence is better than waiting for hackers to bring your cloud down.
Botnet attacks are increasing, meaning that the time to take control of your resources is now.

You Might Also Like
SaaS Observability Done Right

