
Prometheus Monitoring with Open Source Grafana

The combination of OSS grafana and Prometheus is becoming a more and more common monitoring stack used by DevOps teams for storing and visualizing time series data. Prometheus acts as the storage backend and open source grafana as the interface for analysis and visualization.
Prometheus collects metrics from monitored targets by scraping metrics from HTTP endpoints on these targets. But what about monitoring Prometheus itself?
More on the subject:
Like any server running processes on a host machine, there are specific metrics that need to be monitored such as used memory and storage as well as general ones reporting on the status of the service.
Conveniently, Prometheus exposes a wide variety of metrics that can be easily monitored. By adding open source grafana as a visualization layer, we can easily set up a monitoring stack for our monitoring stack.
Let’s take a closer look.
Installing Open Source Grafana & Prometheus
For this article, I’m using a Dockerized deployment of Prometheus and OSS grafana that sets up Prometheus, OSS grafana, cAdvisor, NodeExporter, and alerting with AlertManager.
The default configuration used in this image already defines Prometheus as a job, with a scraping interval of 15 seconds, so the server is set to monitor itself.
- job_name: 'prometheus'

   scrape_interval: 10s

   static_configs:

     - targets: ['localhost:9090']
To install this stack, use these commands:
git clone https://github.com/stefanprodan/dockprom

cd dockprom

docker-compose up -d
Open up the OSS grafana at: http://<serverIP>:3000 and use admin and changeme as the password to access OSS grafana.
Defining the Prometheus Datasource
Our next step is to define Prometheus as the data source for your metrics. This is easily done by clicking “Creating your first datasource.”
The configuration for adding Prometheus in open grafana is as follows:
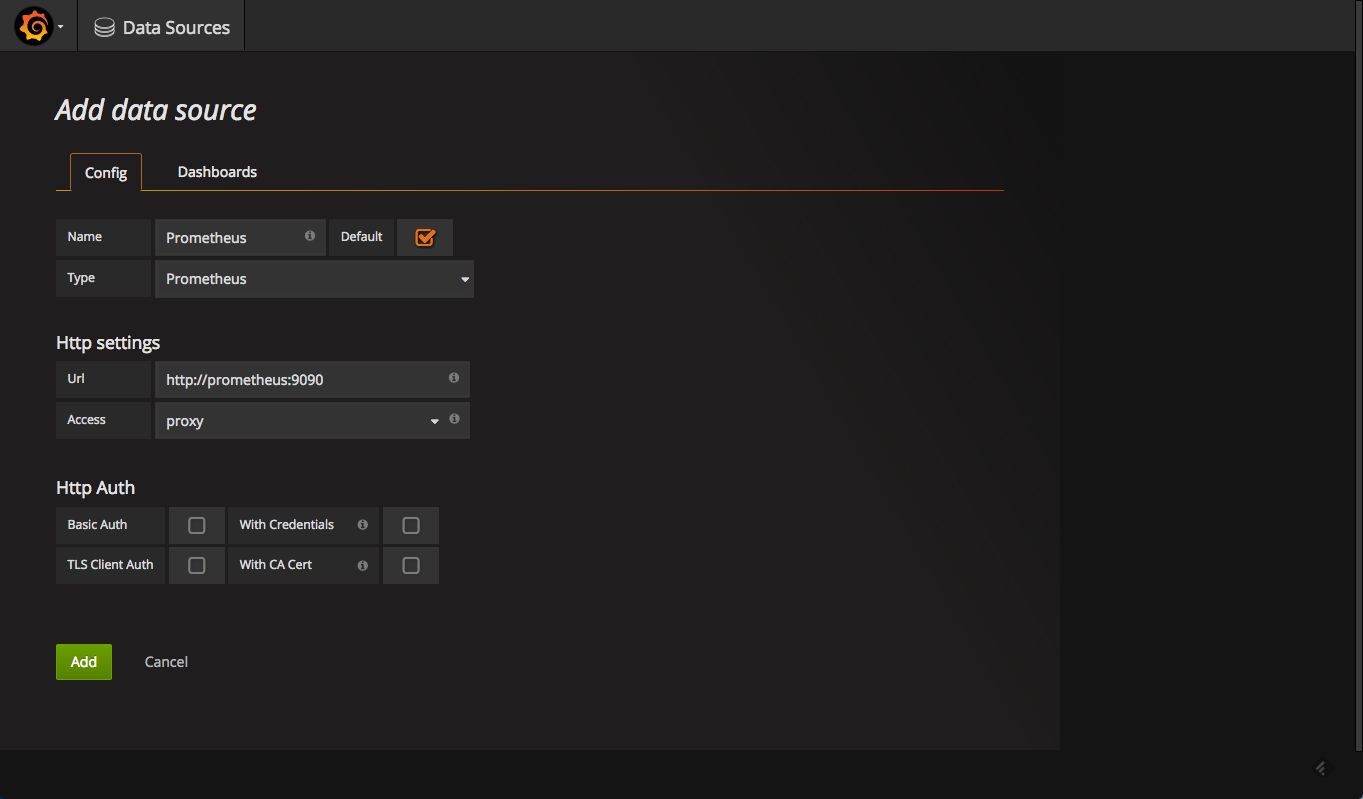
Once added, test and save the new data source.
What to Monitor?
Now that we have open source grafana and Prometheus set up, we can begin to set up monitoring.
Prometheus ships a number of useful metrics that can be monitored. For example, since Prometheus stores all chunks and series in memory, we can build a panel based on the prometheus_local_storage_memory_chunks and prometheus_local_storage_memory_series metrics.
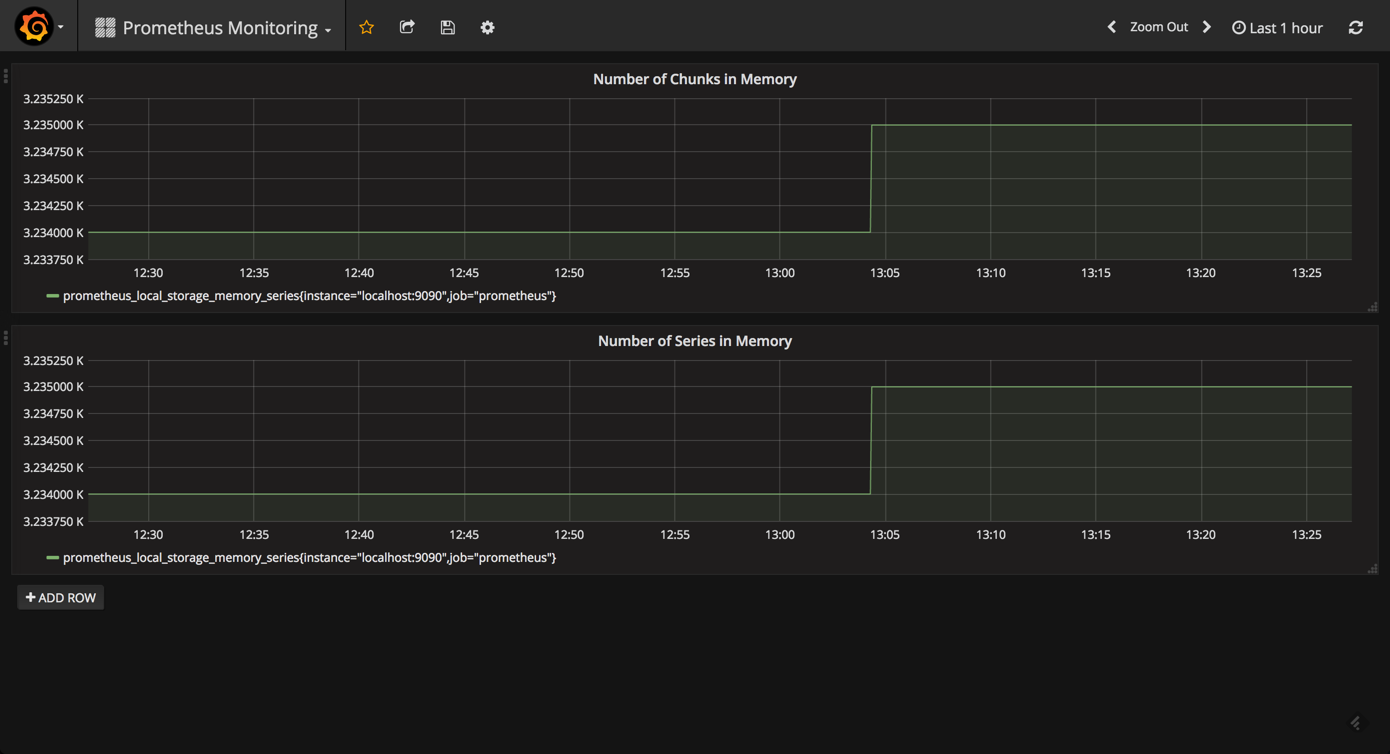
Based on your RAM, you will want to monitor these panels for any specific thresholds passed. You can fine-tune the amount of RAM using the storage.local.memory-chunks configuration directive, while Prometheus recommends that you have at least three times more RAM available than needed by the memory chunks alone.
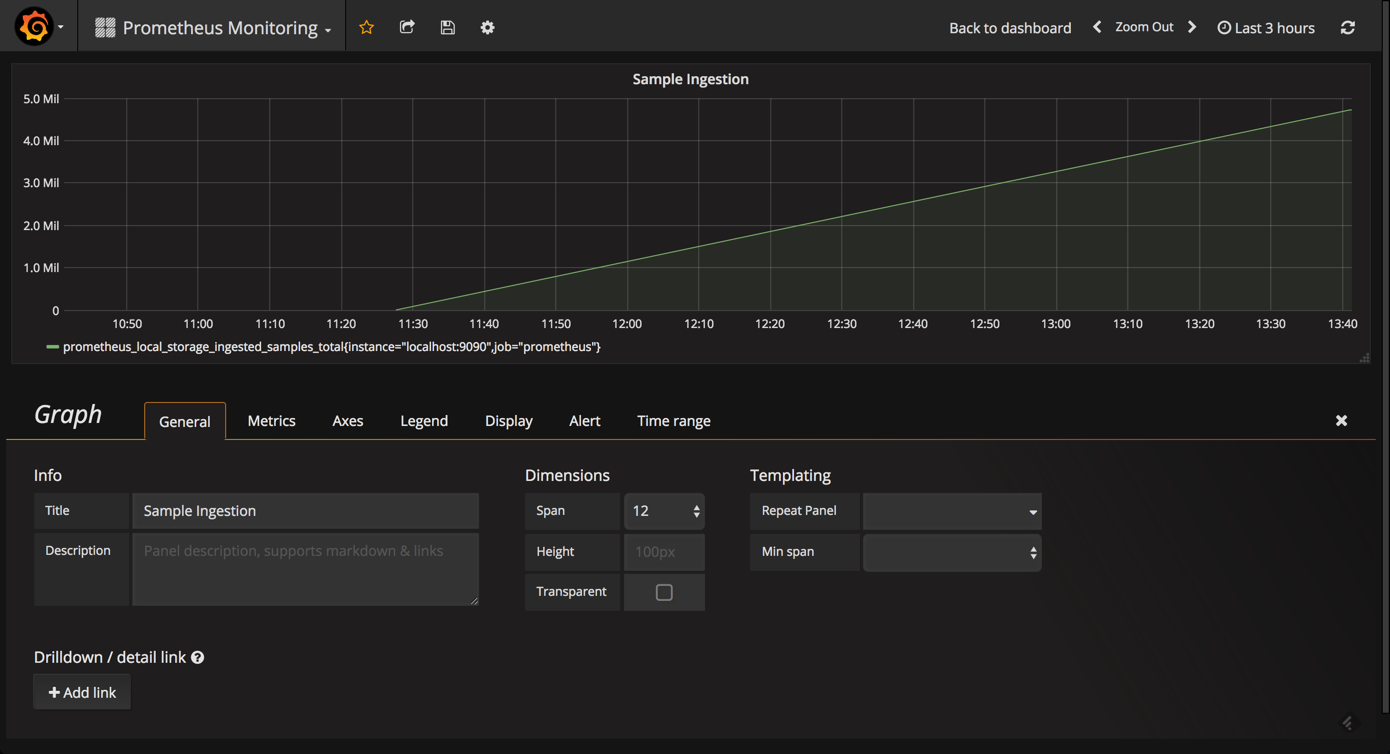
To get an overview of how well Prometheus is performing, we can measure the ingestion rate for the samples using the prometheus_local_storage_ingested_samples_total metric. What you need to monitor is whether the rate displayed aligns with the amount of metrics you know you are ingesting.
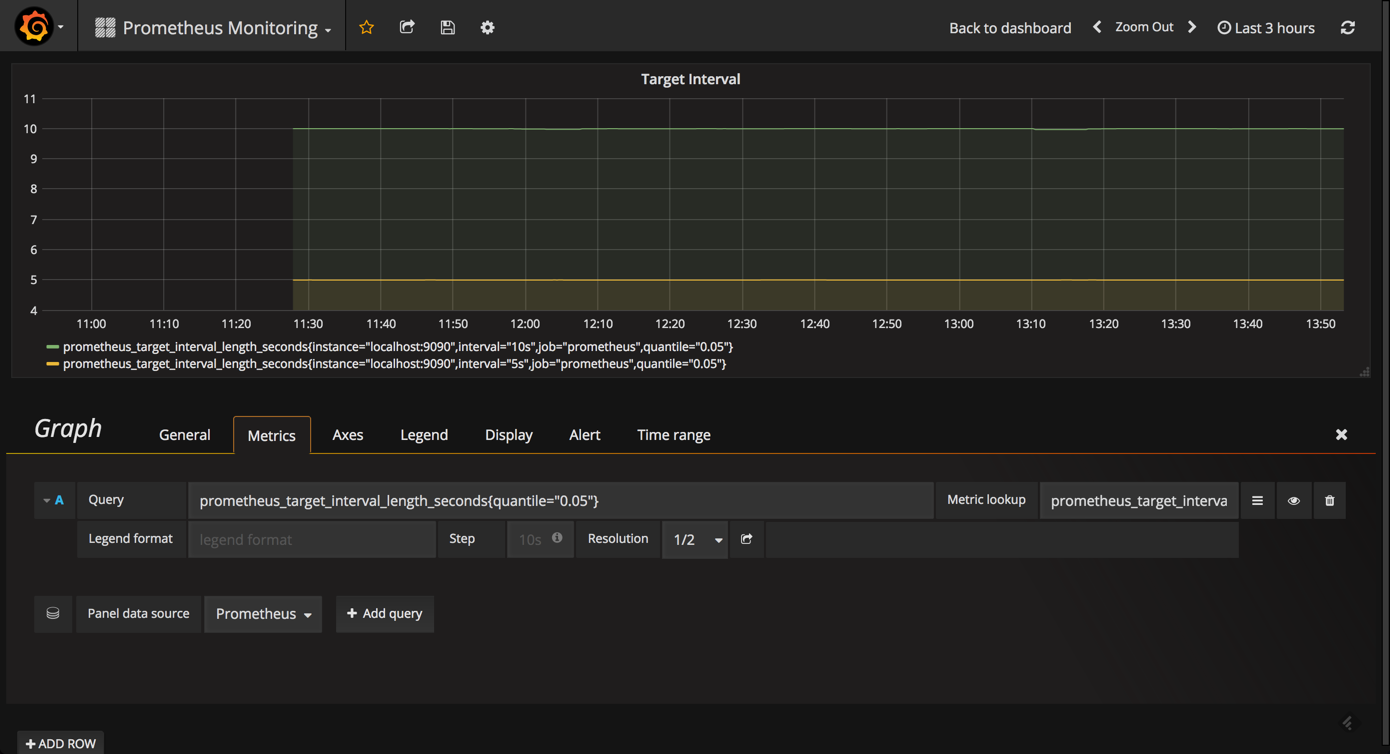
Likewise, it can be useful to monitor the actual amount of time between target scrapes that you have configured for Prometheus using the prometheus_target_interval_length_seconds metric. This will help you to identify latency issues whenever a sudden rise in latency is something that you will want to explore.
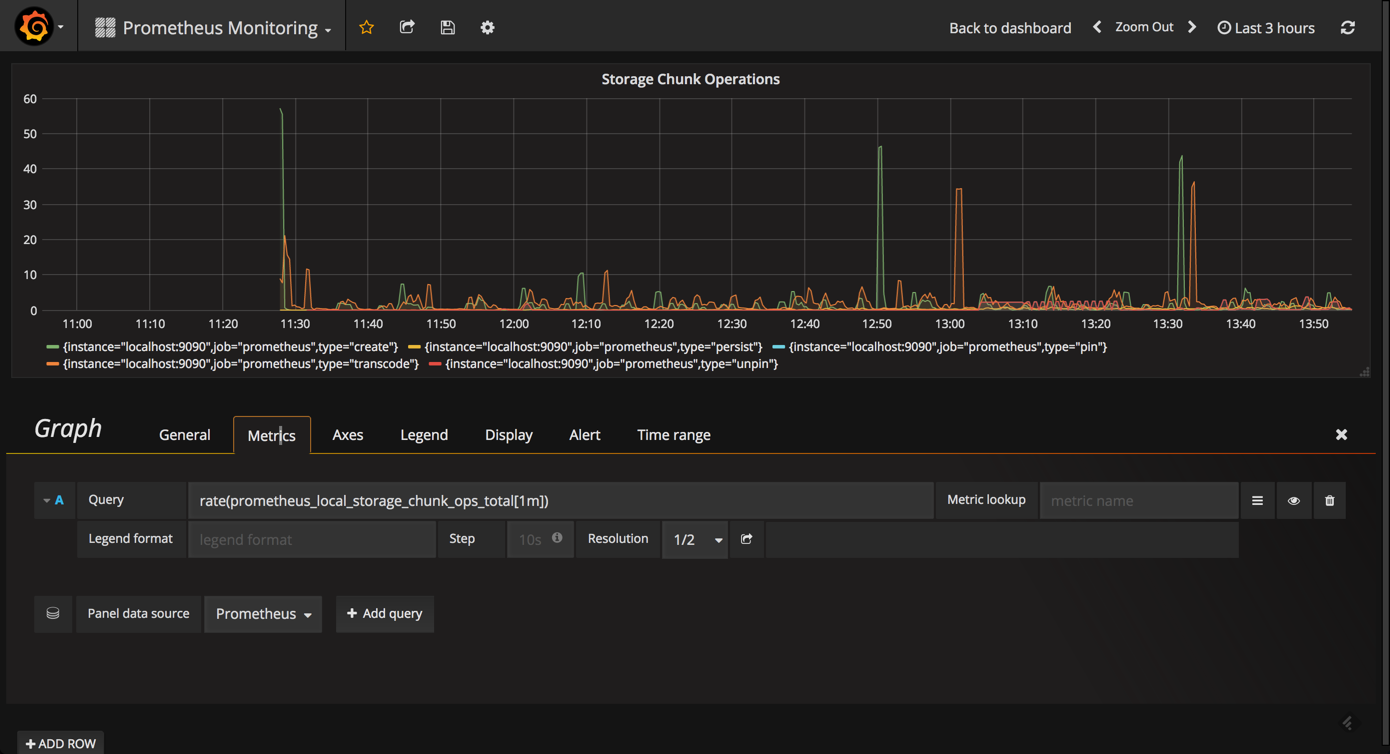
Another useful metric to query and visualize is the prometheus_local_storage_chunk_ops_total metric that reports the per-second rate of all storage chunk operations taking place in Prometheus.
Using the Prometheus Stats Dashboard
Open source grafana comes with a built-in official dashboard for Prometheus called “Prometheus Stats” that was developed together with the Prometheus team. After you set up Prometheus as the datasource, simply select the “Dashboards” tab and import the listed dashboard.
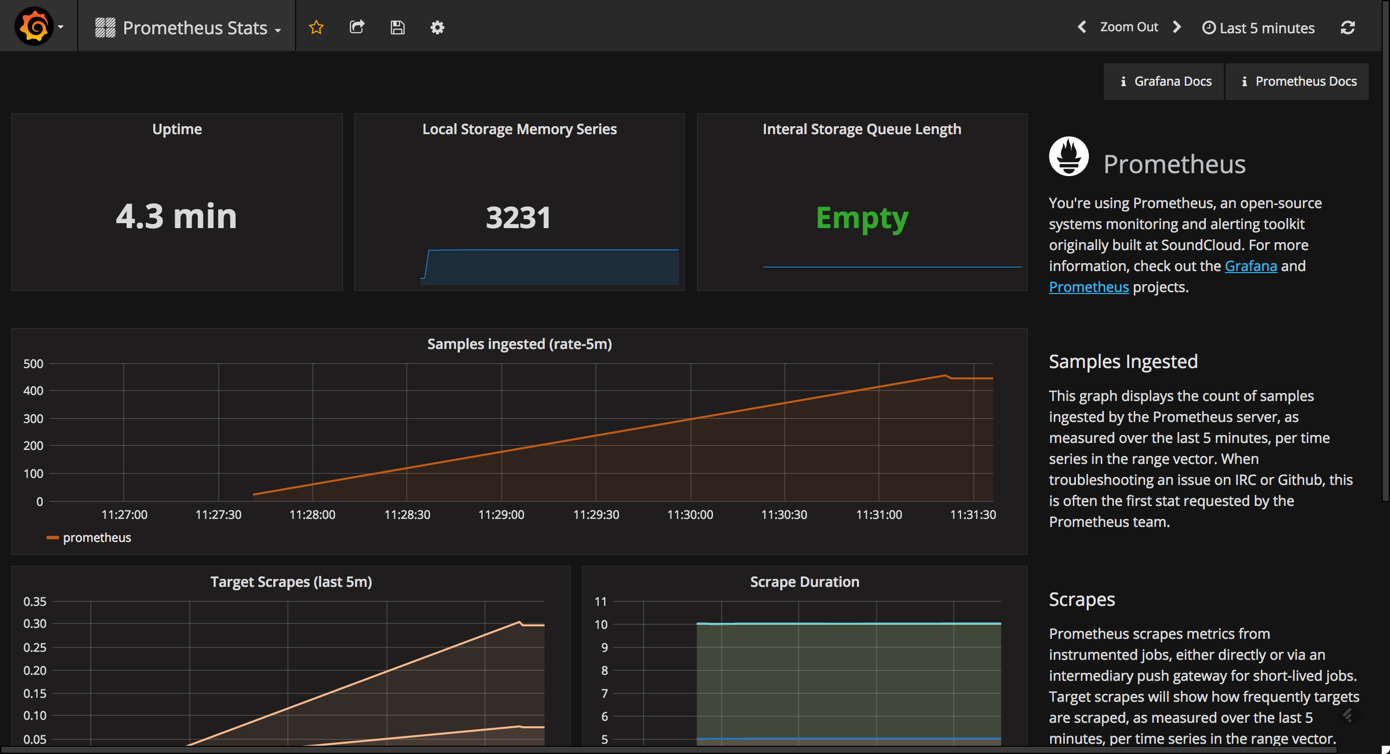
As you can see, this dashboard contains the following visualizations (some are similar to the ones described above):
- Uptime: The total amount of time since your Prometheus server was started
- Local Storage Memory Series: The current number of series held in memory
- Internal Storage Queue Length: Ideally, this queue length should be “empty” (0) or a low number
- Sample Ingested: Displays the samples ingested by Prometheus
- Target Scrapes: Displays the frequency that the target — Prometheus, in this case — is scraped
Monitoring Prometheus with a Benchmark Dashboard
While designed for benchmarking Prometheus servers, the Prometheus Benchmark dashboard can be used to get a sense of the additional metrics that should be monitored.
To install and use this dashboard, simply go to Dashboards → Import and paste the URL for the dashboard.

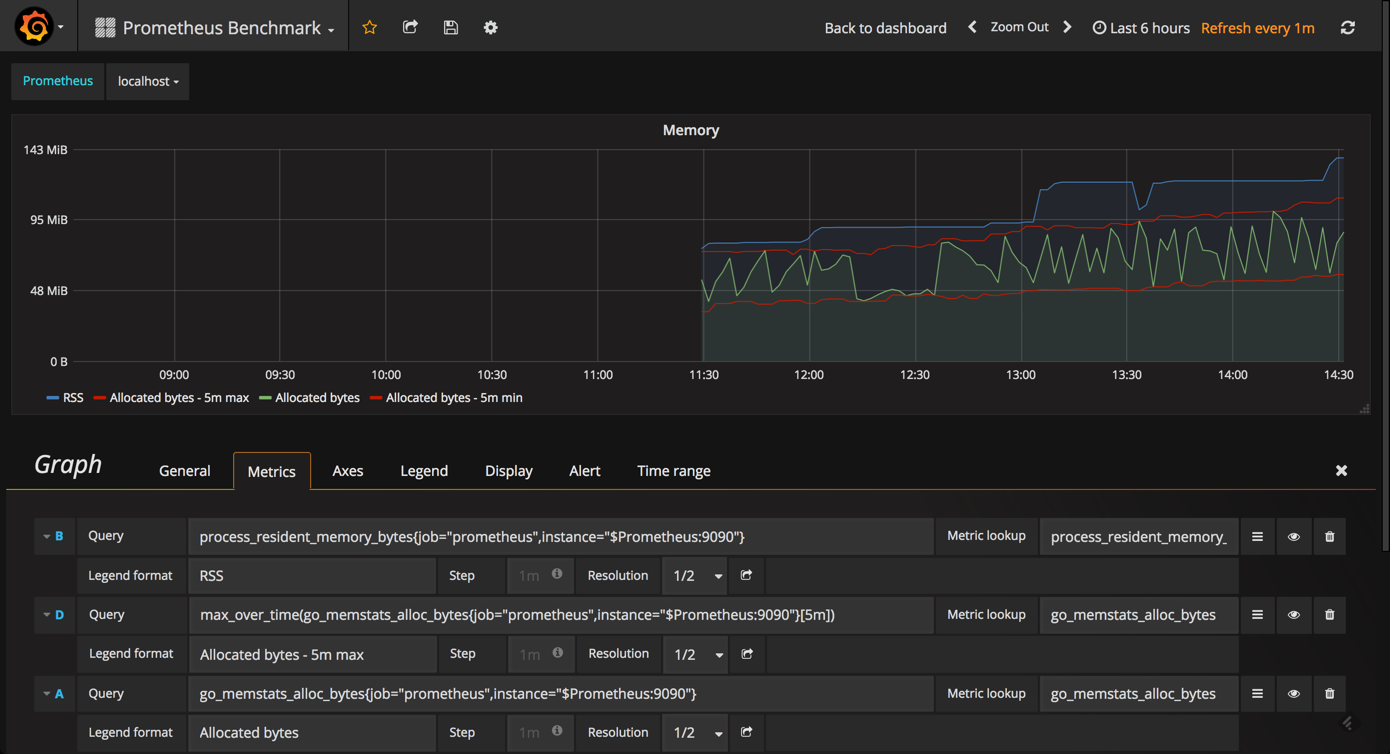
While this is probably overkill for the day-to-day monitoring of your instance, this advanced dashboard includes some useful panels that are not displayed in the Prometheus Stats dashboard.
For example, the Memory graph gives you an idea of the memory consumed by Prometheus (same goes for the CPU graph).
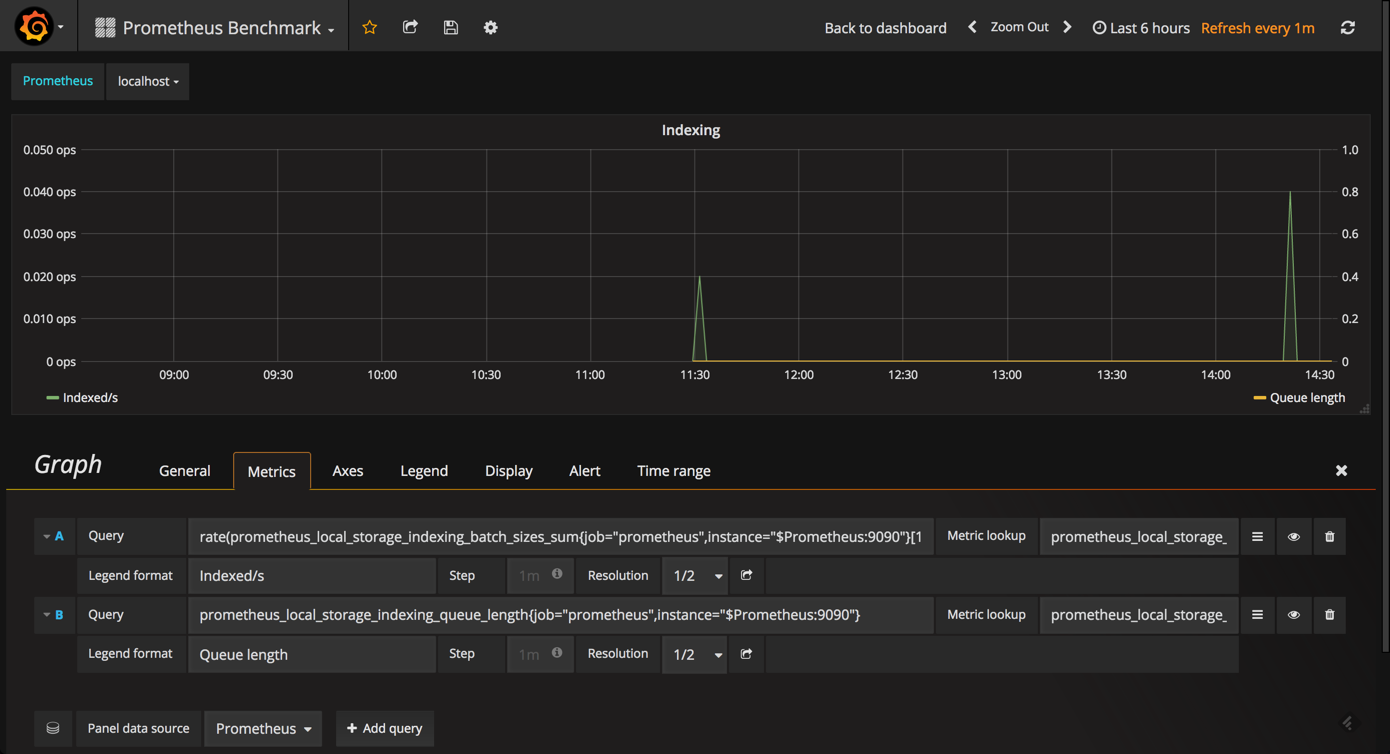
The Indexing graph gives you a good picture of the indexing rates for your Prometheus instance.
Endnotes
You can slice and dice the various metrics that Prometheus self-reports about itself any way you want. Prometheus exports a long list of metrics that can be seen by browsing to http://<serverIP>:9090/metrics. You can experiment with the various queries in the graph editor at http://<serverIP>:9090/graph.
So, how you construct your Prometheus monitoring dashboard will ultimately involve quite a lot of trial and error. The good news is that the combination with open source grafana makes this exploration extremely easy, and Prometheus has some good built-in functionality to help you along the way.

You Might Also Like

Top 5 open-source HIDS systems

The 8 Hidden Pitfalls of Using AWS CloudWatch
Get started for free
Completely free for 14 days, no strings attached.
