
Tis the Season: 3D Observability for Prometheus + Grafana + Octoprint
December 20, 2022

You may get lucky this holiday season with a new 3D printer, either as a gift or something you give yourself as a reward for all your hard work this year.
Household 3D printers have made tremendous strides in ease of use and affordability over the last decade. In this time, even use of budget 3D printers has matured from a long weekend of slow building and constant troubleshooting to essentially plug and play – transforming many garages and basements from humble storage rooms to makerspaces that would be the envy of any iron-themed superhero.
At the same time, I myself stumbled into an issue with my printer a few weeks ago where its onboard fans were blowing on the device’s hotend and causing a thermal runaway error, even after rebuilding said hotend. This issue causes Octoprint to restart as well, losing my metrics in the process and making the root cause even more difficult to identify.
So, within the context of monitoring and observability, such a situation begs the question – how can we preserve our metrics, get great visualizations of what the printer is currently doing, receive alerts when and if something goes wrong, plus get your hands on neat statistics such as total prints completed, total print time, and number of failed prints?
The answer? Prometheus + Grafana + Octoprint = 3D Observability!
A quick summary of what each element does:
Octoprint: is used to control the 3D printer via a web interface, most commonly run on a Raspberry Pi, and attached to the printer control board via USB. It is currently the most widely used 3D printer host software backed by lots of great community plugins. The plugin we’re interested in here is the Prometheus Exporter plugin, which will allow us to expose the metrics we want, including current print progress and extruder temperature.
Prometheus: is used to scrape the metrics that we’re exposing from Octoprint and remote write them to Logz.io, where they can then be visualized and used for alerts in Grafana. We’ll run this in a docker container on the Raspberry Pi itself.
Grafana: is used for visualizing our metrics and sending alerts whenever certain thresholds are met, such as a current print changing status or hotend temperature increasing beyond safe levels.
Set up and Installation:
First thing first, you’ll need to set up Octoprint and attach it to your 3D printer. You’ll then want to grab a micro SD card and an Octoprint image to set that up – Octoprint provides great instructions on how to get that working.
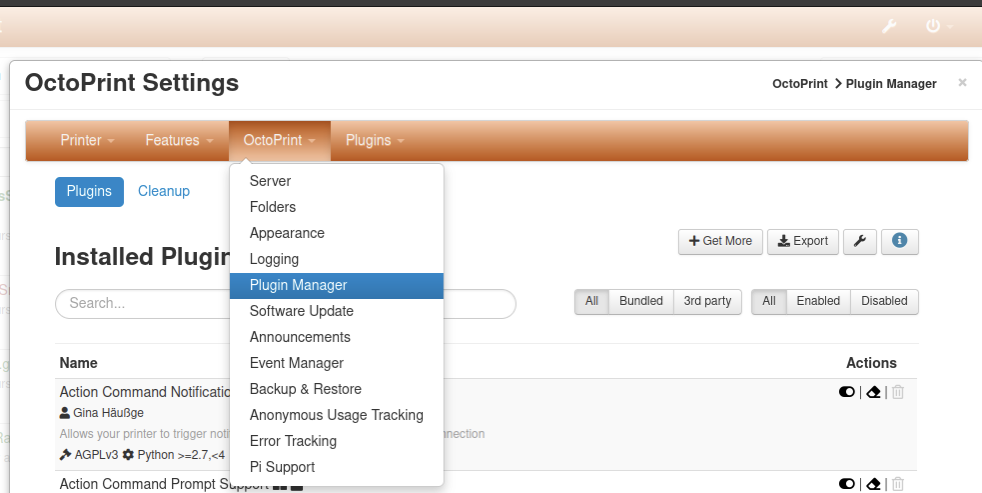
Once your OctoPrint is properly set up, you’ll need to install the Prometheus Exporter Plugin from the plugin manager to expose your metrics. This is accomplished by going to settings > OctoPrint > PluginManager, then enabling “Prometheus Exporter Plugin”.

Once the exporter is installed, you should see the raw metrics at the address http://octo.local/plugin/prometheus_exporter/metrics if in fact you used the provided hostname from the OctoPrint tutorial.

We’ll also need to get an access key so Prometheus can access these metrics – we’ll do that in Octoprint by going to Settings > API > Access Application Keys, then Entering an Application Identifier and generating a code.
Next, we’ll need to set up Prometheus to scrape those metrics and send them along to Logz.io. We’ll start by creating the configuration that Prometheus is going to use to find these metrics and send them to Logz.io:
- Get your Logz.io bearer key by logging in, navigating to Metrics > Send your metrics > Remote Write for Prometheus
- Now ssh to your OctoPrint server (ssh pi@octo.local)
- Create a new directory in /home/pi called “prometheus” (mkdir /home/pi/prometheus), and create “prometheus.yml” with the following (nano /home/pi/prometheus/prometheus.yml).
global:
  external_labels:
    p8s_logzio_name: <Your_Printer_Name>
remote_write:
  - url: https://listener.logz.io:8053
    bearer_token: <Your logz.io bearer token>
    remote_timeout: 30s
    queue_config:
      batch_send_deadline: 5s  #default = 5s
      max_shards: 10  #default = 1000
      min_shards: 1
      max_samples_per_send: 500 #default = 100
      capacity: 10000  #default = 500
scrape_configs:
  - job_name: 'octoprint'
    scrape_interval: 5s
    metrics_path: '/plugin/prometheus_exporter/metrics'
    params:
      apikey: ['<YOUR OCTOPRINT API KEY>'] # Get this from OctoPrint > Settings > Features > API
    static_configs:
      - targets: ['localhost']
Now we need to install Docker and run Prometheus to use this configuration. If you’re unfamiliar with Docker, it is a platform for running containerized applications. We’re using it here because once it’s set up, it’s simple to run Prometheus, configure it to restart automatically if your Raspberry Pi restarts, and update (just remove the container and run it again, since we’re using the latest image).
Docker provides good instructions for installing on Debian 10, so follow those to get Docker up and running. I would recommend setting up the repository, then installing Docker from here.
Once Docker is installed, you can run Prometheus and mount in the configuration file we made earlier to start shipping our metrics.
To run Prometheus in Docker using the configuration we made above, run:
sudo docker run –restart=always -d -v /home/pi/prometheus/prometheus.yml:/etc/prometheus/prometheus.yml –network=host –name=prometheus prom/prometheus
What do all of these flags mean?
- –restart=always is telling Docker to restart this container if the Pi restarts
- -d run as daemon (background process)
- -v /home/pi/prometheus/prometheus.yml:/etc/prometheus/prometheus.yml Mounts the Prometheus configuration into the container
- –network=host for the sake of simplicity, we’ll run the container on the host network of the Pi
- –name=prometheus just giving the container an appropriate name
Almost there! Now we have OctoPrint controlling the printer, the Prometheus Exporter Plugin exposing our metrics, and Prometheus remote writing our metrics to Logz.io. Now we just need to visualize our metrics and set up any alerts we want.
On Logz.io, Navigate to the Metrics product to create a new dashboard with your metrics, or you can import this one I created:

Now you should have a visualization of your printer’s metrics. If you want to create alerts, you can do so from the “Alerting” section  You’ll also need to create a new Contact Point so the system knows where to send the alerts. I want to receive a text message whenever a print is finished, which I accomplished by choosing Email as the contact point and using my cellular provider’s SMS gateway – <phone_number>@tmomail.net in my case with T-Mobile. Other carriers have their own SMS gateway, so you’ll need to check for your specific carrier if you want to go this route.
For the actual alert, here is what I used. There are many other alerts you could make, but this is a good starting point.

Once that’s done, you’re all set to add your own panels, create new alerts for items such as temperature differences or printer state changes, or even start shipping metrics for other elements that you want to monitor! To help get started, here is a long list of available exporters that you can use to expose metrics for various applications here.
Happy printing and happy holidays from all of us at Logz.io!

You Might Also Like

A Guide on Log File Parsing Tools

