ScaleUP 2021: Taking the Logz.io Observability Platform to the Next Level
November 16, 2021

Today was a very exciting day for Logz.io, as we held ScaleUP 2021 – our second annual user conference – dedicated to elevating our customers’ success, discussing best practices for modern observability, and unveiling Logz.io’s latest product updates.
These product advancements were presented by our Co-Founder and VP of Product Asaf Yigal, and members of the Logz.io software engineering team. They discussed exciting new capabilities that will help users: surface and investigate performance issues faster, collaborate on new security events, and continue to use the best open source for logs, metrics, and traces.
Here’s a list of their product sessions covering our latest product updates:
- Unified Dashboards: Customers can now visualize and filter all of their logs, metrics, and traces side-by-side to quickly correlate relevant data during investigations.
- Service Performance Monitoring: Provides a bird’s eye view of your trace data to quickly spot significant trends in performance and drill down into individual traces.
- Event Management: Creates workflows to prioritize and collaborate on security event response, undertaking a severity-based cross-stakeholder approach.
- OpenSearch: We’re migrating customers from Elasticsearch to OpenSearch! Opensearch is the new open source version of Elasticsearch.
- Anomaly Detection: Uses the power of Machine Learning and AI to automatically surface critical telemetry data to highlight health and performance issues faster.
- Scheduled Alerts: Precisely determine when alerts should trigger, and when they should not, to help improve efficiency and avoid alert fatigue.
To learn more about these announcements, read on! And stay tuned for upcoming posts that go even deeper into each new capability.
Unified Dashboards
Navigating between siloed and disconnected monitoring tools to investigate telemetry data can slow down engineers during the time they need to be fastest: production incidents. This is why Logz.io unifies telemetry data in one platform. Up until now, customers still had to move between different interfaces to correlate their logs, metrics and traces.
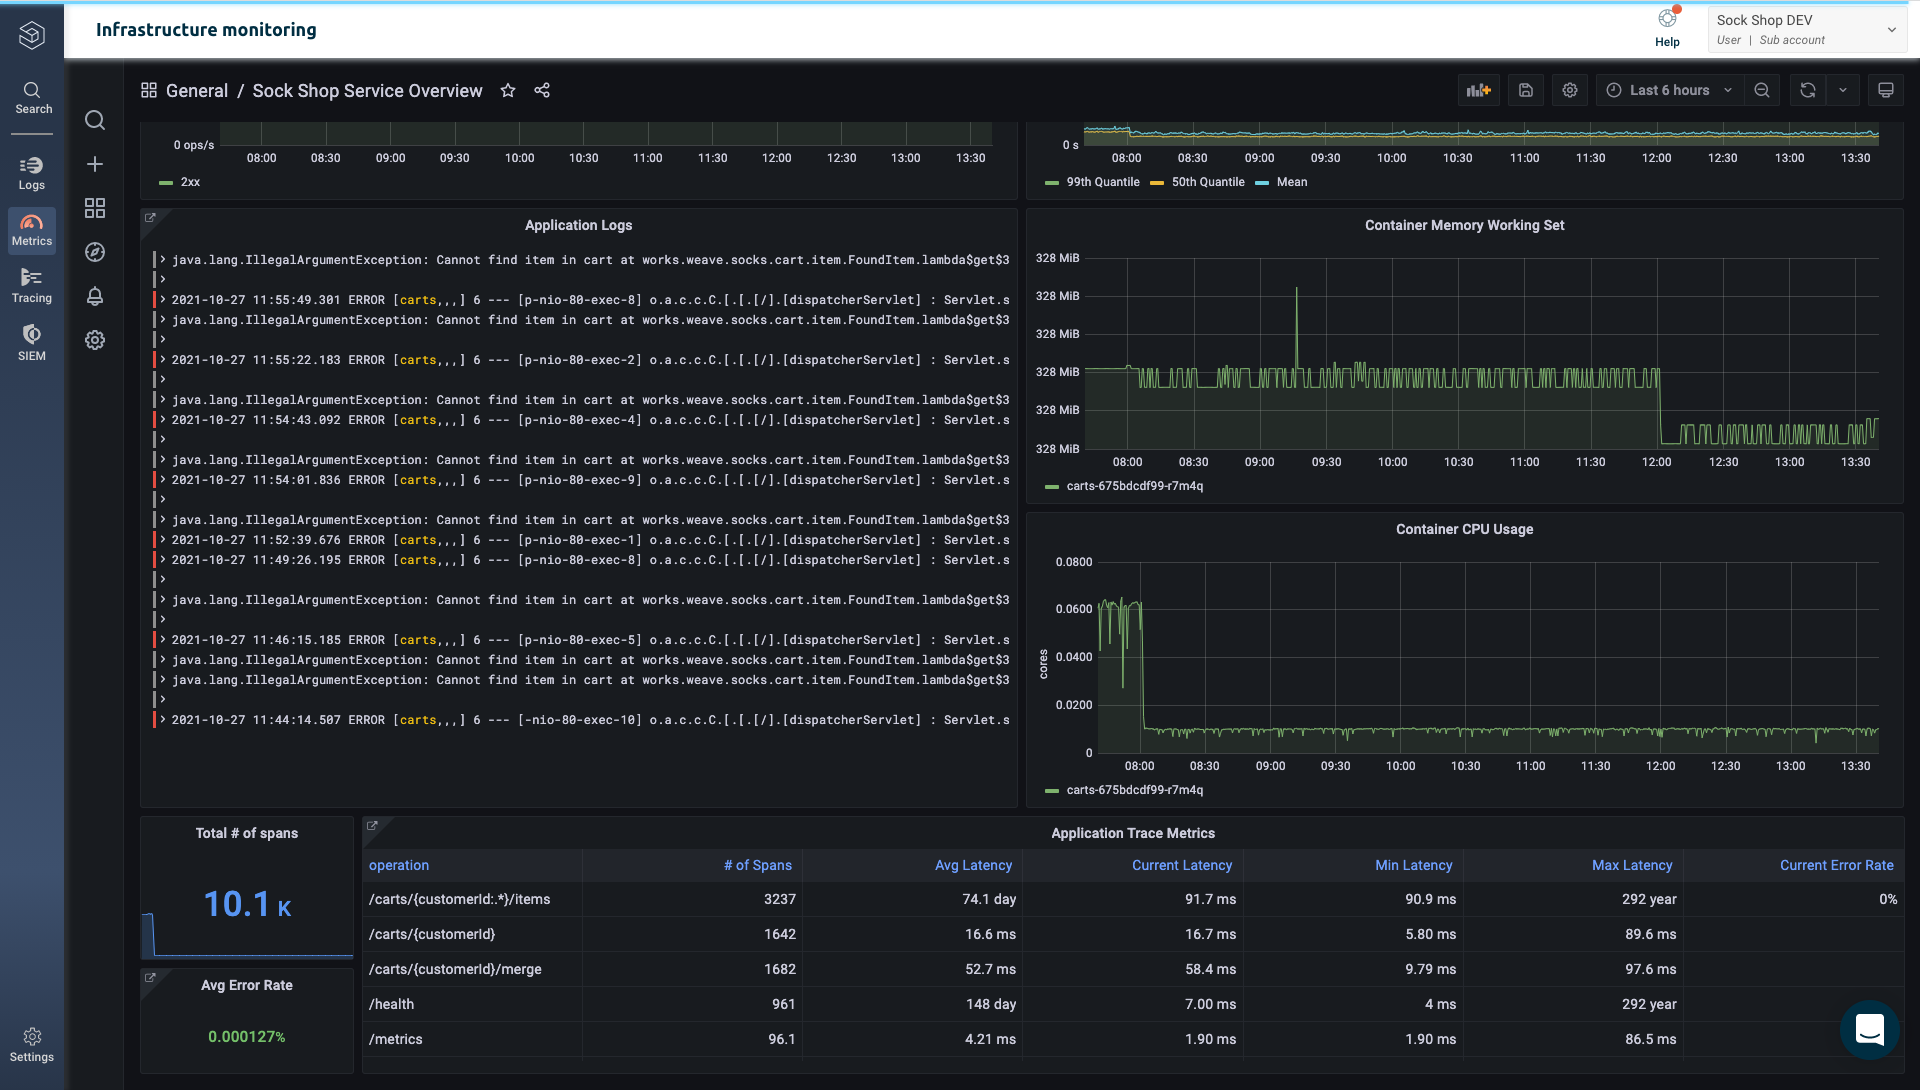
With Unified Dashboards, you can visualize and investigate logs, metrics, and traces in a single monitoring dashboard.
This makes it easy to quickly see a broad overview of your environment, and zoom into the relevant data to investigate details – all together in a single view. When engineers can view and correlate all of their telemetry data together, they can investigate problems faster so they can resolve them sooner.
Try it yourself later on in November!
Service Performance Monitoring
Modern cloud environments consist of hundreds, if not thousands, of distinct components and short-lived services that are constantly interacting, replicating, and rebooting across shared infrastructure. Monitoring application requests that travel across a vast ecosystem of microservices can be an enormously complex undertaking.
Logz.io Distributed Tracing makes it easy to examine individual requests that require interactions across multiple microservices with intuitive trace visualization. But what if you’re collecting thousands, if not millions, of traces? How will you know which traces to focus on?
With Logz.io’s new Service Performance Monitoring, you can visualize aggregated metrics generated directly from the trace data to gain a high level overview of macro performance trends. This bird’s eye view into your systems’ health metrics can help quickly locate anomalies and spikes in services or specific operations, and offers an easier way to monitor across microservices, and then jump to the respective individual traces with one click of the mouse.
We’ve contributed this capability back to the open source community – which includes the technology to generate the metrics in OpenTelemetry and the interface to monitor the metrics in Jaeger – and it will be included in the next release of Jaeger. It has been included in the OpenTelemetry collector since late this summer.
Service Performance Monitoring is currently in Beta.
Anomaly Detection
Common monitoring approaches include setting static thresholds that look for a specific type of problem, or known unknowns. When you know what to look for, this approach works perfectly fine – and is employed by thousands of Logz.io users.
But what about when you don’t know what to look for? And what if huge volumes of data clutter the specific information that indicates oncoming production incidents?
This is why we built Logz.io Anomaly Detection, which automatically surfaces the critical data needed to unearth production issues that might have otherwise been missed.
Anomaly Detection utilizes current and historical telemetry data, more specifically by modeling and analyzing unstructured logging and trace data to build a model of known patterns and then queries against fresh data coming into the platform to locate and score the severity of anything that looks unusual. These issues are then translated into dedicated alerts and visualizations for additional investigation.
Worth noting, we will be building out Anomaly Detection across the entire platform – Logs, Metrics, Tracing and Security. This is particularly exciting as you consider the involved benefits, and the fact that this extends well beyond the reach of other providers who are offering this type of capability for metrics alone.
OpenSearch
In January of 2021, Elastic decided to relicense the formerly open source projects Elasticsearch and Kibana to a non-open-source license.
At Logz.io we aim to deliver the best-of-breed open source to our customers, which is why we are gradually moving away from the ELK Stack. To that end, we’re excited to announce that Logz.io has begun the transition to OpenSearch and OpenSearch Dashboards – the new open source fork of Elasticsearch and Kibana.
Logz.io has worked closely with AWS and others to initiate, build, and enrich OpenSearch and OpenSearch Dashboards with the goal of enabling users to safeguard their existing investments in Open Source technology and utilize capabilities built for the community, and guided by the community. To learn more about OpenSearch, check out our OpenSearch FAQ page.
We have begun to migrate our clusters to OpenSearch this month. Customers won’t notice any immediate changes from the migration – except for improved performance delivered by OpenSearch compared to using Elasticsearch.
Learn more here.
Event Management
Logz.io continues to deepen Cloud SIEM’s capabilities to make it easier for security teams and MSSPs to surface, investigate and enable response to potential threats.
The latest improvement to Cloud SIEM is the introduction of Logz.io Event Management, which will help our users better classify, prioritize, and collaborate on significant security events.
Event Management accelerates key workflows around threat identification, security analyst assignment, severity-based triage and subsequent mitigation. Using this new capability, analysts are enabled to consolidate event alerting and track investigative status from alert to mitigation, providing critical insight to ensure more effective response.
Scheduled Alerts
Observability alerting can be noisy and create alert fatigue. Too many alerts that don’t provide new and important information can reduce trust in alerting altogether in the eyes of a busy engineer.
Scheduled Alerts makes it easy to determine when an alert should evaluate predefined trigger conditions to prevent users from being overloaded with unnecessary data. For example, does a group of developers need to stay notified of problems in their staging account over the weekend? Probably not. So they can schedule the alert to only trigger during weekdays. By contrast, alerting can be tuned to fire more aggressively during a particularly sensitive timeframe, such as a new application launch, or during a time when related business is expected to increase dramatically.
With Scheduled Alerting, teams can filter out the noise while focusing on the information that matters most. Stay tuned in December for GA.
Learn More
The individual ScaleUP product announcement sessions go deeper into use cases, value propositions, and technical details for each of these important product updates. If you’re interested in learning more, click here to see all the ScaleUP sessions whether you registered for the event or not!
We’ll also be releasing blog posts and documentation that dive into these new capabilities.
Interested in learning how you can use these features? Contact us to get in touch!
It’s an extremely exciting time for Logz.io, our customers and our highly innovative modern Observability platform. Stay tuned to this space for more details as these capabilities arrive in the product!
You Might Also Like

Kubernetes Phase 2—Key Challenges at Scale

