Logging A Docker Environment with Portainer (Or Not)
January 10, 2017
For the sake of our dedicated readers, let’s start with the conclusion: Portainer is not a logging solution for Docker.
But wait! Before you move on — Portainer is an extremely useful and easy-to-use UI for Docker that is well worth exploring if Docker is part of your day-to-day work. And it’s open source!
Still with me? Great!
So, what is Portainer? Simply put, it’s a UI for Docker that allows you to “easily manage your Docker hosts or Swarm clusters.” In other words, it’s a pretty face on top of the Docker API.
Portainer runs as a lightweight (9.132 MB) container that can run on any Docker engine (Mac, Linux and Windows) and can be used to manage images, containers, volumes, networks and — yes — logs.
As someone who has looked into and written extensively about Docker monitoring with Logz.io and the ELK Stack, I was interested in testing the logging capabilities of Portainer.
Below are my notes.
Setting it Up
Installing Portainer is easy and can be done with two simple commands.
Start by pulling the image from the Docker hub:
docker pull portainer/portainer
Next, we need to run the container. Since it needs access to the Docker daemon on our host, we need to mount the socket file from within the container host:
docker run -d -p 9000:9000 -v /var/run/docker.sock:/var/run/docker.sock portainer/portainer
Now that your container is running, all that’s left to do is open your browser with the following URL:
http://:9000
You now need to go through some simple configuration steps.
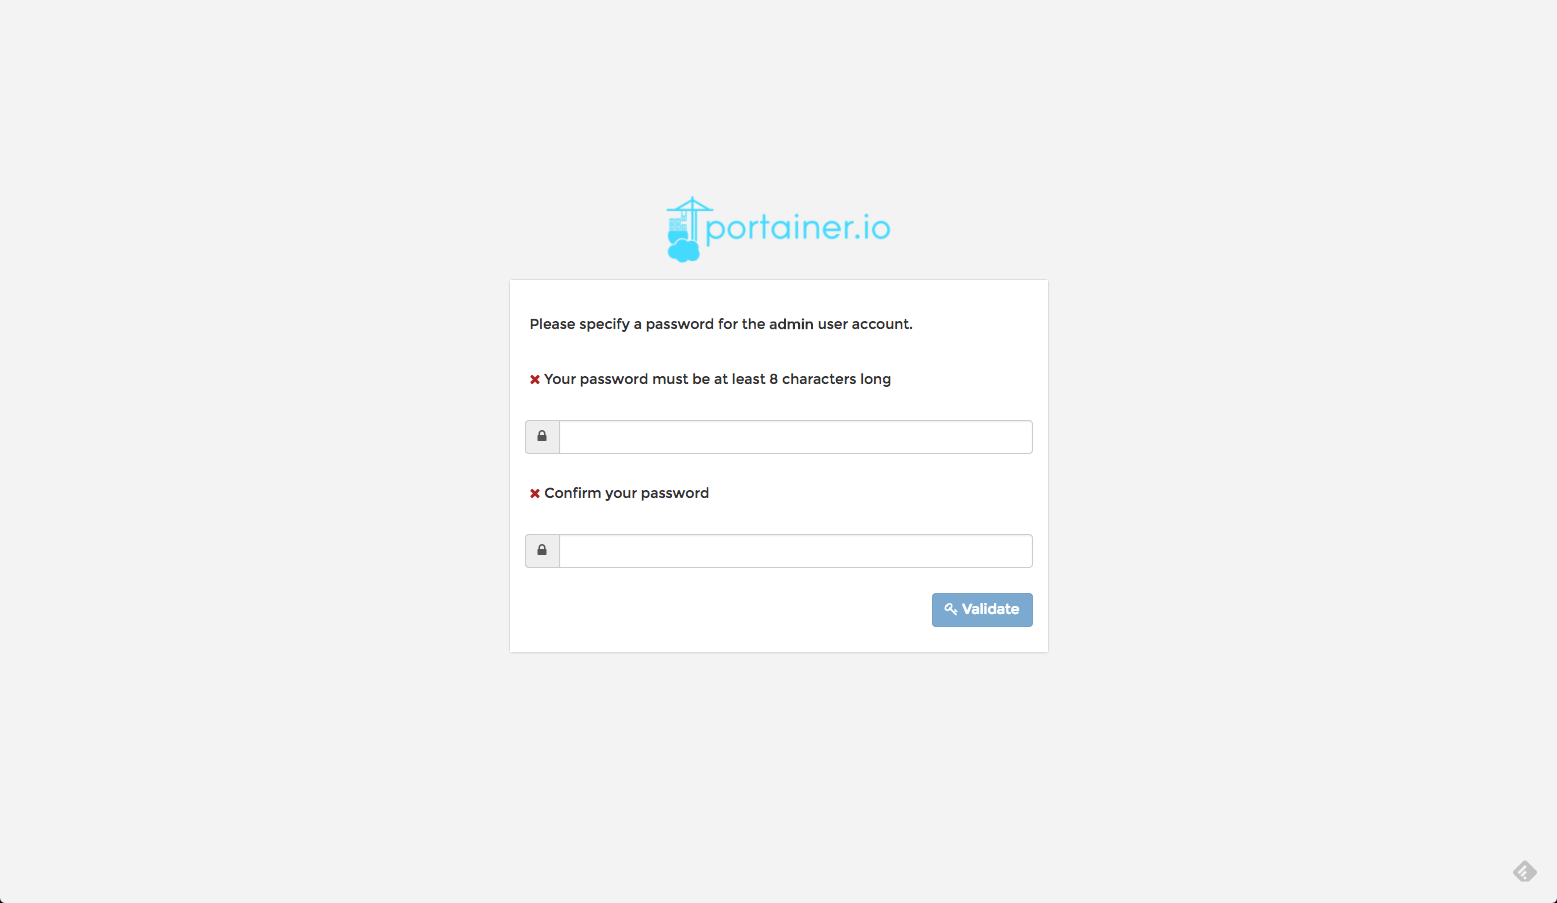
You should be seeing the password configuration page, where all you need to do is enter and then confirm a password.
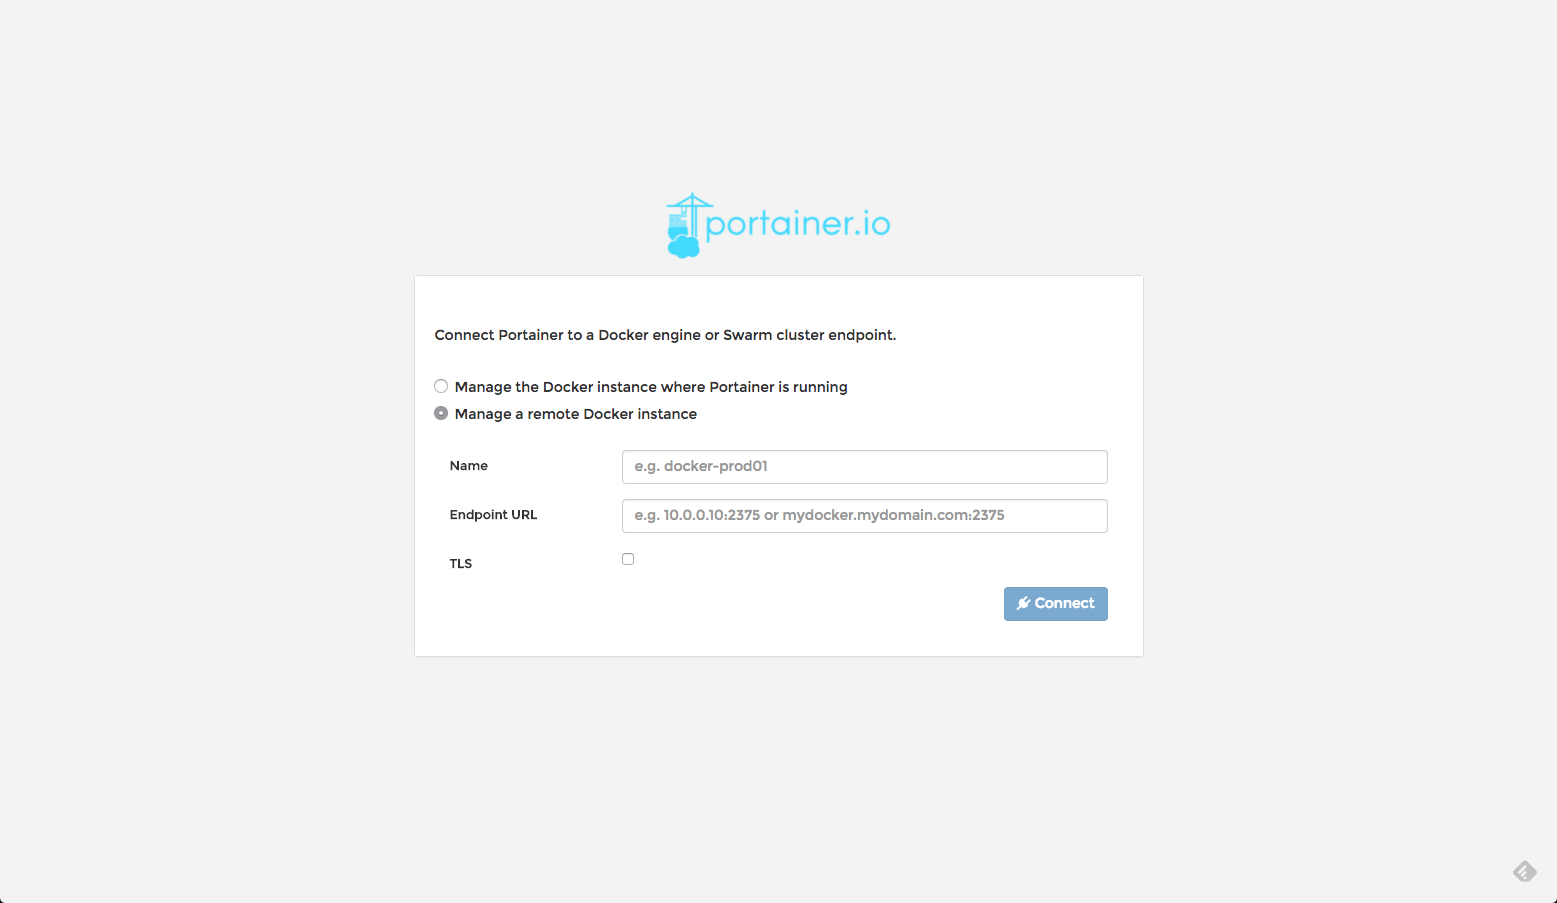
Clicking Validate, you will be asked to enter your password one last time and then an additional configuration page is displayed asking you which Docker host you want to manage with Portainer — you can choose between a remote Docker host and a local Docker.
Once you complete that simple task, click Connect and you will have access to Portainer!
Playing Around
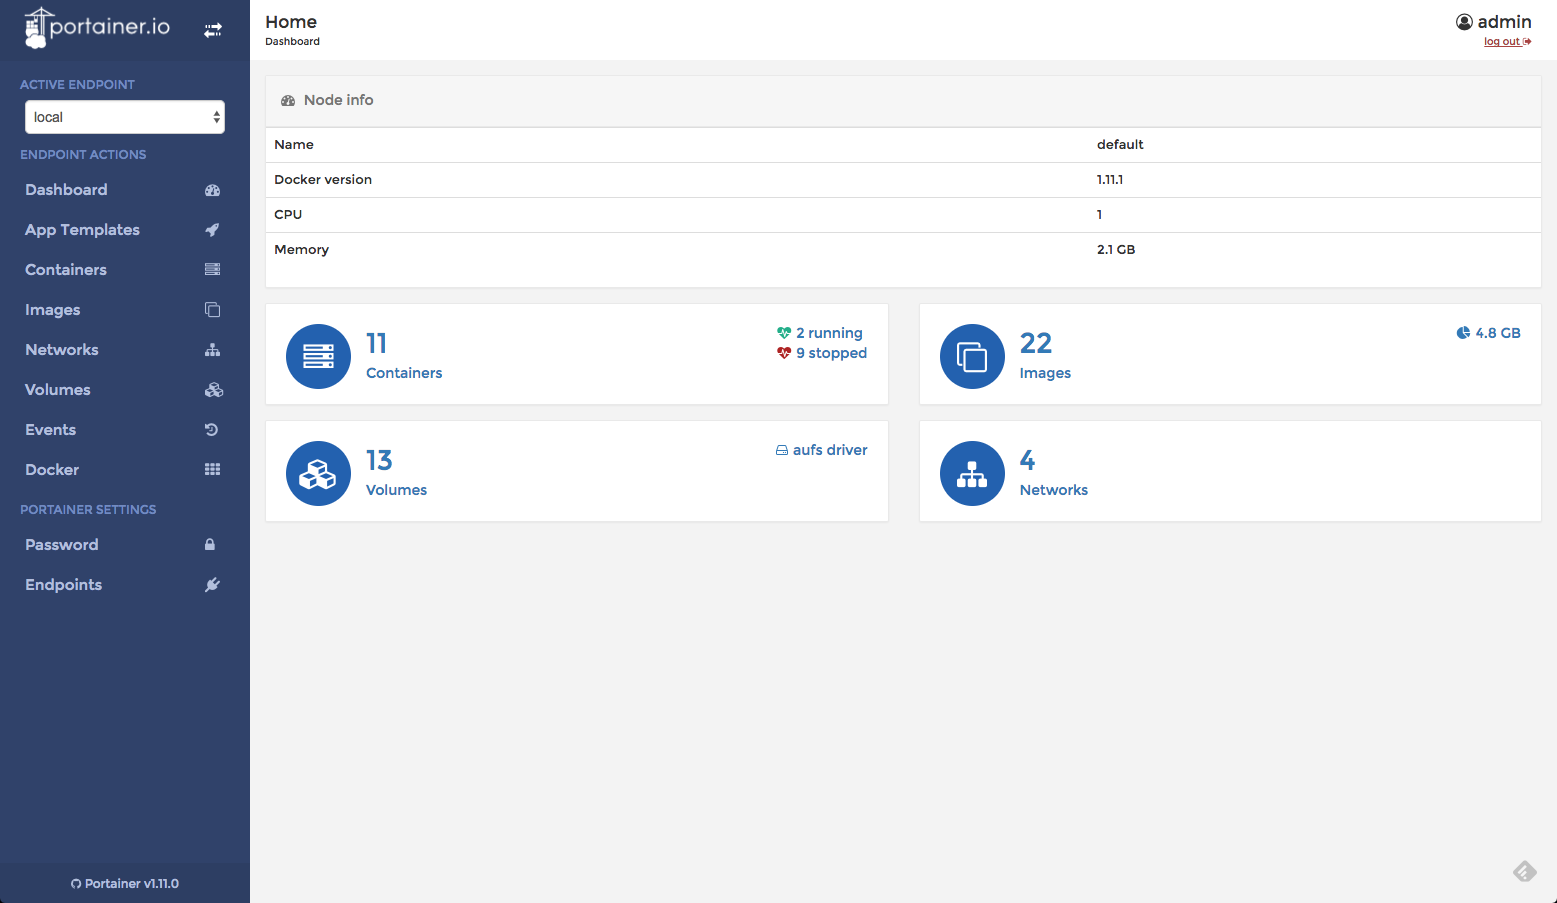
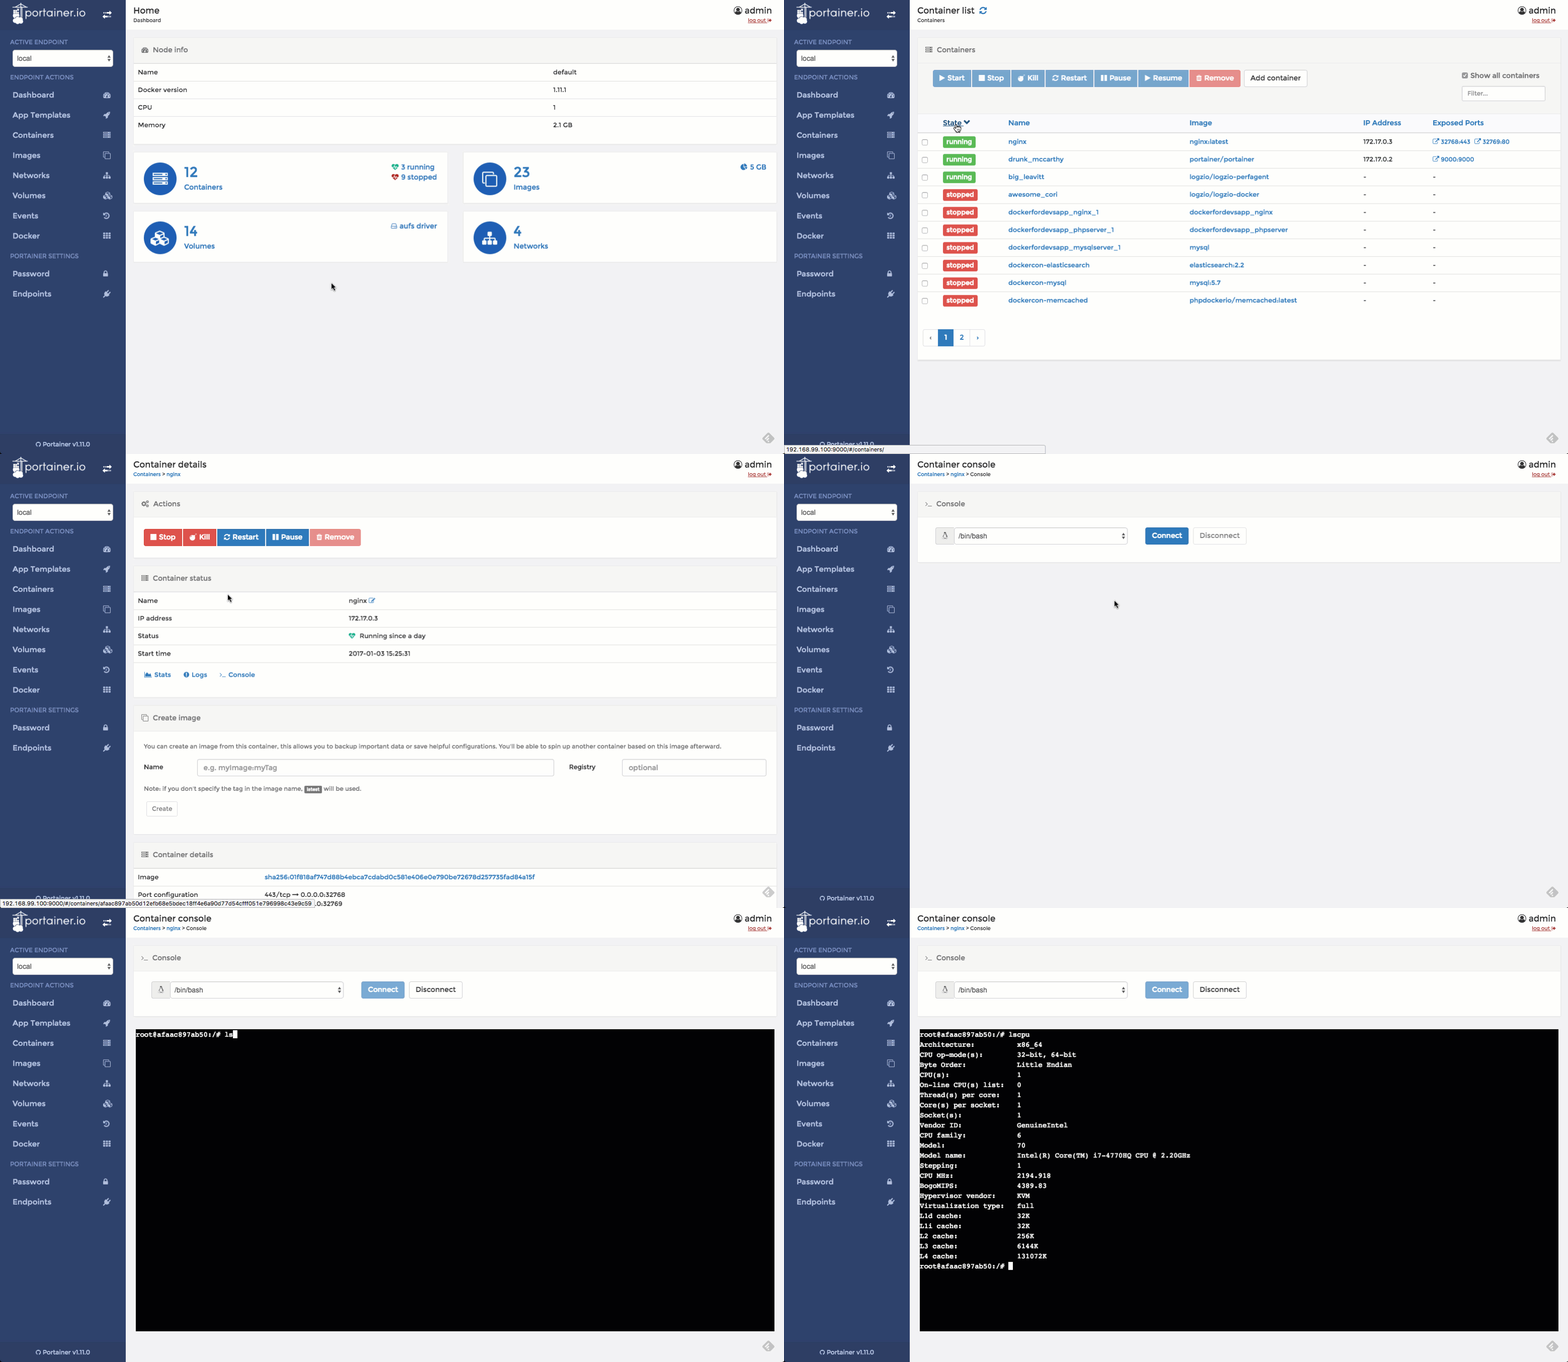
The default page that opens up is a dashboard. The dashboard gives you an overview of your Docker node (or nodes in case of Swarm) as well as the number and status of your containers, the number and total size of images, the number of volumes, and the number of existing networks.
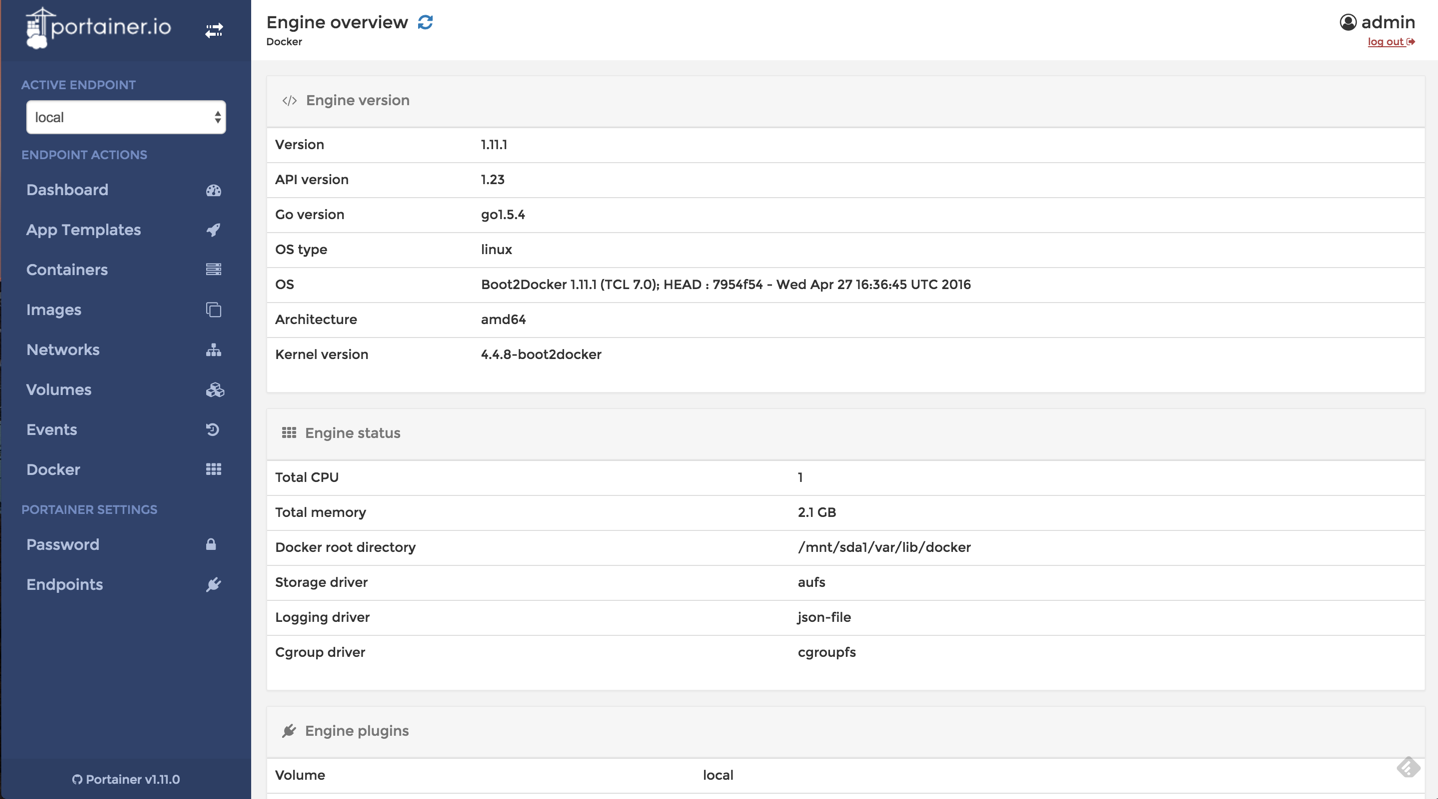
If you’re looking for general information on the Docker Engine, select the Docker tab from the menu on the left.
Using the same menu, you can manage the main building blocks comprising any Docker environment: containers, images, networks, and volumes.
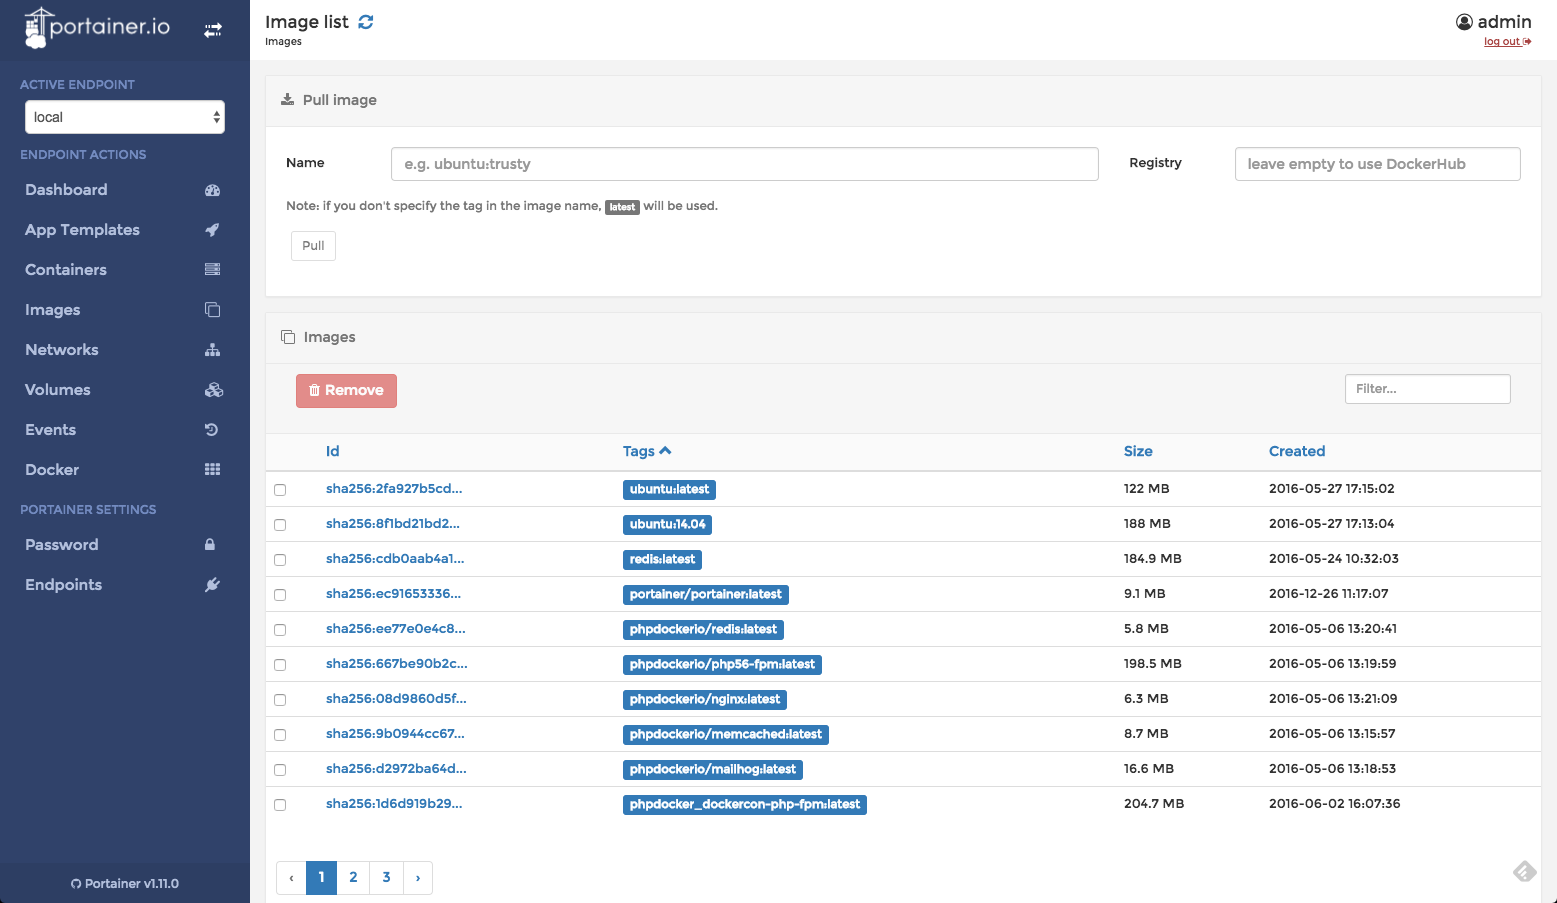
For example, selecting Images gives you a list of all the images pulled. You can see their Id, tag, total size, and the date that they were created.
The great thing about Portainer is that it allows you not only to get an overview of the environment but also to manage it. For example, if you want to pull a new image (from the Docker Hub or a different registry) or remove an existing image, you can do so from this page.
On the Containers page, you will be able to see a list of all your containers. Selecting a container will give you all the details about the selected container including its status, network, and port configuration as well as the option to build an image from the container. You can even open a terminal with bash into the container.
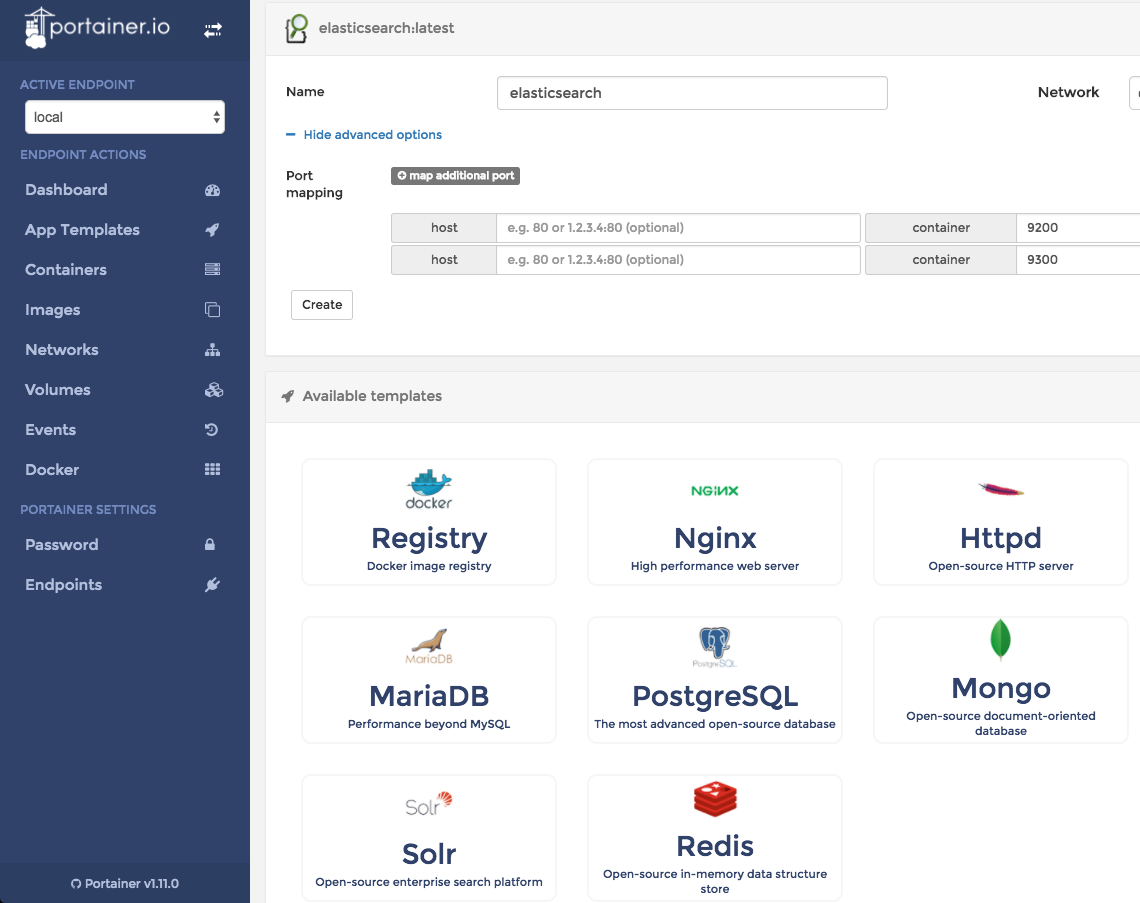
An interesting feature is the ability to run new containers based on ready-made Portainer templates. Select App Templates from the menu, choose which template to use, configure the container name and port mapping, and create (or run) your container.
Logging Containers
From a logging perspective, Portainer gives visibility to resources that would otherwise be harder to access.
As explained in this post, one of the reasons it’s so challenging to log Docker environments is their multi-layered nature. There are various metrics and logs to measure such as the stdout and stderr output of a container, Docker container statistics, and Docker daemon events.
While Portainer does not offer a way to get a comprehensive and centralized view of these three types, it does allow you to easily access the three data streams.
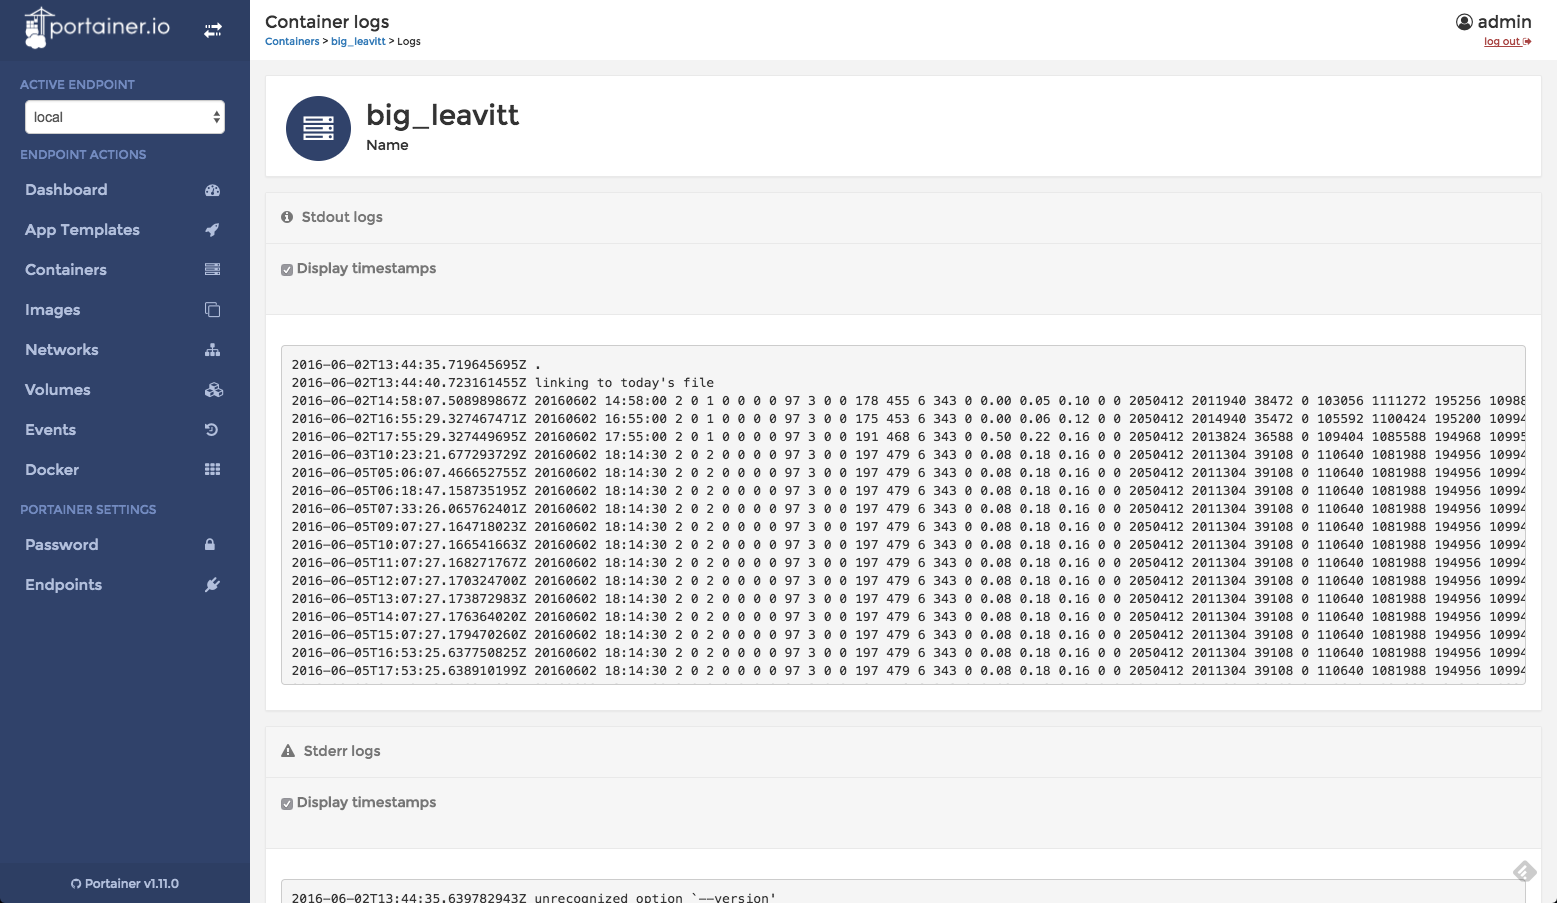
To see container logs, for example, you need to select one of the containers on the Containers page and then click Logs. As you can see below, you get a nice view of the stdout and stderr output:
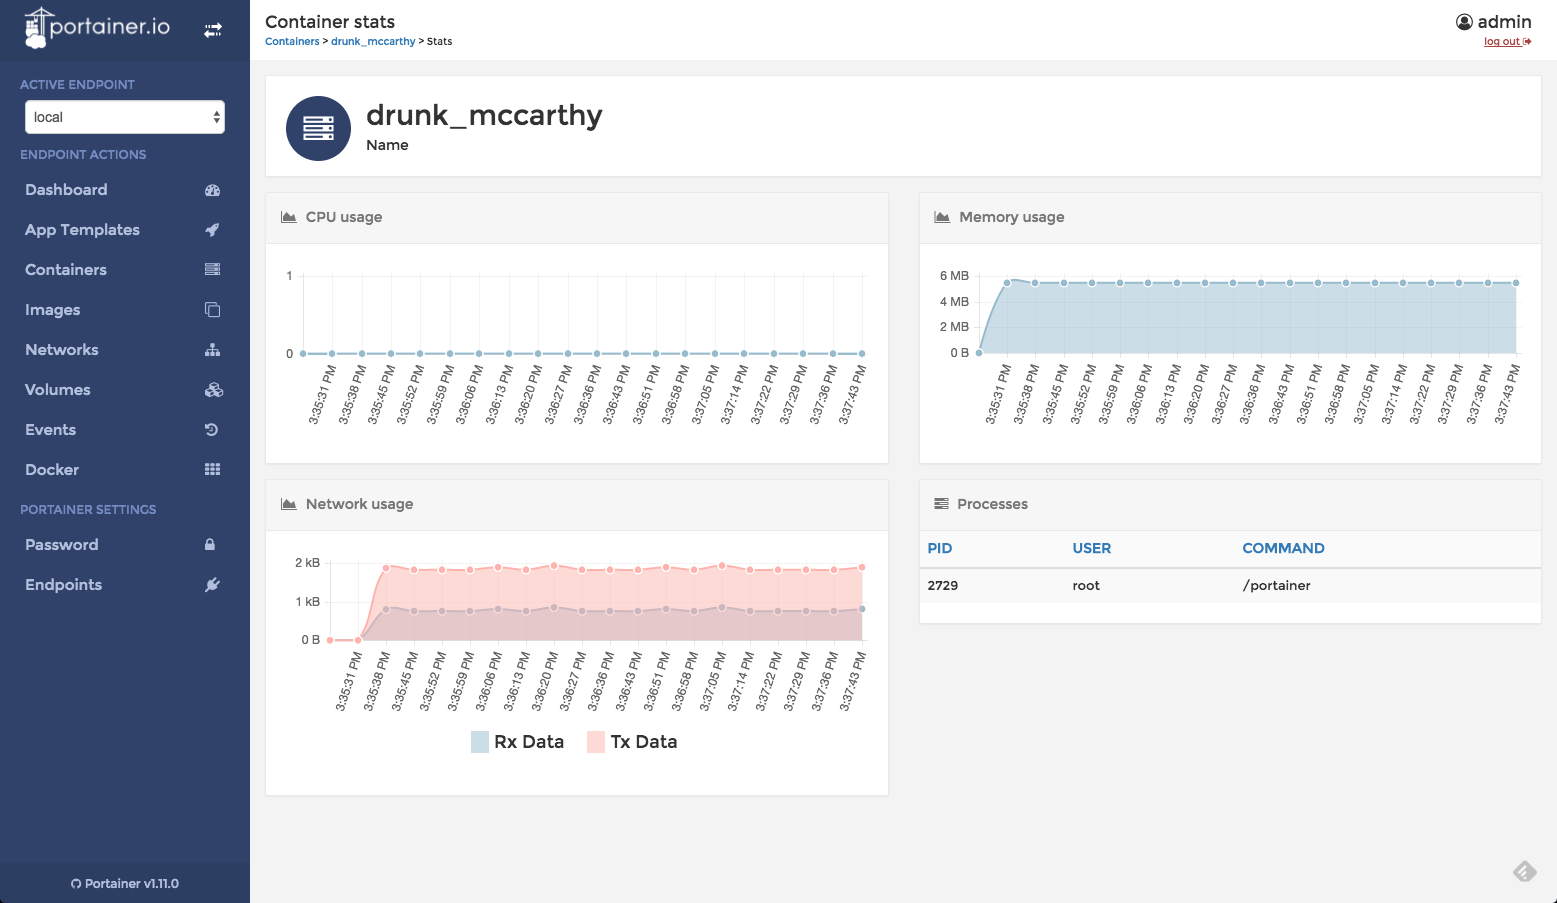
The same goes for Docker stats. It’s worth noting that the data is refreshed upon page load, so there is no data retention:
Docker events (Docker daemon “admin” actions such as kill, attach, restart, and die) can be viewed on the Events page.
Summing It Up
Portainer fills in an extremely empty void in the Docker world by wrapping up the Docker API with a pretty, intuitive, and easy-to-use UI.
More on the subject:
From a logging perspective, though, there is much that is missing such as the very basic ability to query the logs to the more advanced function of visualizing them and being able to build a comprehensive monitoring dashboard.
But that’s OK. Portainer does not claim to be a logging solution for Docker, and it is excellent at what it does claim to be — “an open-source, lightweight management UI which allows you to easily manage your Docker host or Swarm cluster.”
As such, it’s well worth checking out.
I also recommend reading this article as the author, Russ Mckendrick, explores the integration of Portainer with Docker Swarm as well as this note on Reddit by Portainer CEO Neil Cresswell.
