The Central Source of Truth: Fall Guys and Mediatonic
January 27, 2021

Mediatonic is a sprawling video game studio based in the UK, with a number of successful titles to their name: Heavenstrike Rivals, Gears POP!, and Murder by Numbers among them. In 2020, they struck gold again with Fall Guys: Ultimate Knockout. But this game would be special, and the need of handling these kinds of gaming logs at this kind of scale would be, too.
This battle royal-style fighting game pits 60 players against each other until one reigns supreme. To handle the launch of that sort of multiplayer rumble, repeated tens of thousands of times with players all over the world, they were going to need unprecedented levels of insight into their game’s inner mechanics and gaming insights.
Fall Guys took off in August last year, but months went into preparing the launch. As you can imagine, monitoring the performance of all this action, especially with the bandwidth stressed state of lockdown-laden 2020, required a heavy amount of lifting. Logging at scale is a challenging prospect.
But the technical operations team for Mediatonic had a trick up its sleeve to monitor the launch of what they knew would be one of the biggest games worldwide from lockdown. It all starts with Data. Data Visualization.
“Being able to visualize it is something completely different in a way that puts it in a format that everyone can see, everyone can understand, and everyone can follow and that you can share without having to explain it,” Rory Marquis, technical director for the game Fall Guys: Ultimate Knockout at Mediatonic Games, tells us. “It’s not in a spreadsheet, it’s not boring, and it generally changes the perception of the data.”
Spring into Motion: Break Out While in Lockdown
Back in April, as the Great Lockdown was just beginning, they were trying to stack their gaming logs.
“We had a lot of log files and a lot of servers and a lot of data.” But they only had insights, and a graph, for a single server. “Once you have a visualization of data or just any data, you always want more. And we knew from our beta test that we needed more.”
Rory and co. moved to pull, pack, and pass all the logs they had through a homegrown Python script. They downloaded all the gaming log data from all the servers and managed to get some KPIs out of it. But moving closer to release in August, they decided they needed to look for external answers to their game-logging problems.
Logging Games with Logz
In June, they first approached Logz.io.
“I know of other gaming companies that have used the ELK Stack and know that it is generally a good, solid platform from which to work from,” says Rory. So, “the barest minimum we were looking for was something with Elasticsearch and Kibana, and there are a couple things that offer it.”
Rory received several recommendations to go with Logz.io. After getting in touch, Rory’s team outlined what they needed: centralized data, a single source, good cost prediction, and saving their engineers time to focus on scaling. Still, he wasn’t optimistic that the complex needs he saw in his game’s beta testing could be met.
“We started the trial. I started fiddling with it and couldn’t figure out what I was missing. I wondered if my use case was too complex.”
Then he took to Logz.io’s online chat service. With clarity and focus, they identified things right away.
Very quickly they were able to identify the couple steps that I had missed along the way,” Rory says, leading the way to a breakthrough. “Within 10 minutes more of coding I was able to trail all of the data coming in.”
It was initially overwhelming to have so much data streaming live so quickly, far greater in scale than he thought gaming logs and monitoring would ever allow.
“I realized I was in the Matrix!”
“It was pretty simple to do and it basically took about 10 minutes to get a minimally viable connection and product up.”
Gaming Logs Fit to Scale
Next, it was time to build out the visuals. Rory dialed it back and tried to get the hang of things. He managed to set up a counter to look at all the users coming from his personal system — 1. Now, he wanted to get the right guidance to immediately learn the extras. It had to work for all the servers and thousands of players Mediatonic anticipated after launch.
Knowing the scale of metrics and logs pertaining to gaming to anticipate, he called up Logz.io to talk brass tax: cost.
“We’d got the centralized logs, metrics and alerting we want, but how much is this going to cost? preempted the call and calculated my own estimate.”
Rory inquired as to the real cost of the solution, beyond what he saw on the website. What he learned surprised him.
“I didn’t quite understand how Logz.io could be less than the figure on the website,” especially for something with the demands of a gaming company. But, amazingly, I learned that you can drop logs that you don’t need, reducing the data Logz.io collects and making the monitoring process all the more efficient.”
“The ability to drop a log meant that they could ingest it, pass it, put it through their system, but if we didn’t want it, they would drop it for us.”
In the long run, that would let them “ achieve the cost we wanted and actually retain the most important data that we wanted.” With the swipe of a toggle, that setting could be activated or deactivated.
“This is where I felt very powerful, they’d help us lower the cost when we wanted to you…Help us build out all the dashboards; they would manage the service for us; and they would give us all this great…they gave us everything we needed and even things we didn’t expect.”
Summer Heat: Launch Approaching
In July 2020, they had Logz.io integrated and ready for launch. The server stats looked so, so different at that point.

Everything was now time-serialized, centralized, and persisted, allowing for easy comparison between one moment and another. Even after getting everything they needed and wanted, his team uncovered an unexpected use case.
Receiving a Kibana alert in Slack, they were able to see deeper than they expected.
“The engineers looked at the hitch summary from the server and were able to filter that down to just the major hitches and see which particular server was the problem.”
“At that point, we’d gone from a very high-level just, nugget of information, down to identifying which server it is, just in a matter of seconds.”
Gaming Management Insights in an Instance
“We didn’t expect to be able to click directly to show the logs. It will open Kibana at the exact point, with the exact query information we needed to use…and take that information and 15:20 extrapolate it all out and look at all the servers across the whole network.”
“That was something we could not have done before…It was literally 20 or 30 seconds to do all this.”
In the past, Rory’s team would have downloaded all the logs and passed them through their original Python script. But those days were far in the past.
From there, they could break down gameplay by platform, use over time, and region simultaneously.
“This discussion revolved around ‘How many servers, how many players, on each platform, in one place, at one time, that we can display in the studio that is really easy to copy & paste into Slack and refresh every five seconds?’ And this is how this dashboard came into existence:
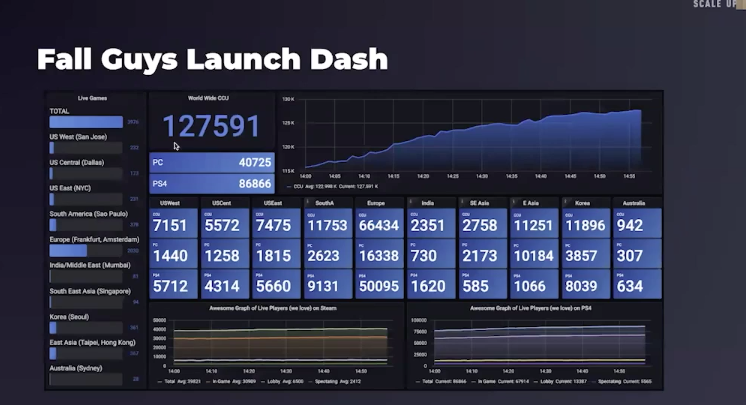
By August, Logz.io was monitoring hundreds of thousands of users at one time. We were recording dips and peaks in activities broken down by country and hour.
Some might be at the beginning of their monitoring strategy and visualization journey. But, the use cases that Logz.io affords companies are beyond what many anticipate when they start using the platform. Whether it is a specific use case like game monitoring, or larger dev category like server monitoring, Logz.io anticipates the unique needs of each task.
As the only, long-demanded DevOps tool blending ELK, Prometheus, and Jaeger, Logz.io lets teams focus on productivity more than maintenance.

You Might Also Like

Product Spotlight: Logz.io Service Performance Monitoring