Kubernetes Observability with Logs and Metrics in Logz.io
December 4, 2019

Yesterday, we announced the beta release of Logz.io Infrastructure Monitoring and the planned release of a Jaeger-based tracing solution. This article will dive a bit deeper into the steps required to set up a Kubernetes observability stack using Logz.io—collecting logs and metrics using Fluentd and Metricbeat and then correlating between them using Kibana and the metrics UI, all in Logz.io.
The addition of Logz.io Infrastructure Monitoring makes an open source-based observability platform for monitoring, troubleshooting and securing distributed cloud workloads.
This Kubernetes tutorial will go through setting up Fluentd, kubectl, minikube and hooking it all up to Logz.io.
Step 1: Collecting Kubernetes signals
Kubernetes has gone a long way since first being introduced and now makes available a long list of data signals, primarily logs and metrics, that can be collected and used for observability. We go over the different log types in this article.
To collect these signals, we need to build some data pipelines. Logz.io provided easy daemonset-based integrations using open-source agents — Fluentd for logs and Metricbeat for metrics.
Let’s take a closer look.
Shipping Kubernetes logs with fluentd
For shipping our Kubernetes logs into Logz.io, we will use a daemonset that runs a Fluentd pod on every node in the cluster. The image used is pre-configured to collect all the logs from a Kubernetes cluster together with relevant metadata for better context. Another option is using Filebeat, and we’ll cover this option in a subsequent article.
The first step is to store Logz.io credentials as a Kubernetes secret — your Logz.io account’s shipping token and Logz.io’s listener host. You can find the shipping token in the Logz.io UI, and the listener host depends on your region’s account, for example, listener.logz.io or listener-eu.logz.io.
Once you have these two credentials, replace the placeholders in the following kubectl command and execute it:
kubectl create secret generic logzio-logs-secret \
--from-literal=logzio-log-shipping-token='<>' \
--from-literal=logzio-log-listener='<>' \
-n kube-system
You should see this message displayed:
secret/logzio-logs-secret created
Next, simply deploy the dameonset:
kubectl apply -f https://raw.githubusercontent.com/logzio/logzio-k8s/master/logzio-daemonset-rbac.yaml
And the output:
serviceaccount/fluentd created
clusterrole.rbac.authorization.k8s.io/fluentd created
clusterrolebinding.rbac.authorization.k8s.io/fluentd created
daemonset.extensions/fluentd-logzio created
Check that the Logz.io fluentd pods are running with:
kubectl get pods -n
Or, if you receive an error that reads No resources found in default namespace, try this:
kubectl get pods --all-namespaces
Here we see three pods, one per node:
fluentd-logzio-4bskq              1/1 Running 0 58s
fluentd-logzio-dwvmw              1/1 Running 0 58s
fluentd-logzio-gg9bv              1/1 Running 0 58s
Within a minute or two, you should see logs flowing into Logz.io from your Kubernetes cluster:

Shipping Kubernetes metrics with Metricbeat
For shipping Kubernetes metrics into Logz.io, we will again use a daemonset but this time one that runs Metricbeat.
First, you’ll need to have kube-state-metrics installed in your cluster. Instructions for this vary a bit depending on what Kubernetes deployment you’re using, but the commands below will help you install it on an Amazon EKS cluster.
Start by cloning the project:
git clone https://github.com/kubernetes/kube-state-metrics.git
cd kube-state-metrics
You can now install with:
kubectl apply -f examples/standardYou should see the following output:
clusterrolebinding.rbac.authorization.k8s.io/kube-state-metrics created
clusterrole.rbac.authorization.k8s.io/kube-state-metrics created
deployment.apps/kube-state-metrics created
serviceaccount/kube-state-metrics created
service/kube-state-metrics created
Next, we’re going to again store Logz.io credentials as a Kubernetes secret, this time using the shipping token for your Logz.io metrics account:
kubectl –namespace=kube-system create secret generic logzio-metrics-secret –from-literal=logzio-metrics-shipping-token=<<SHIPPING-TOKEN>> –from-literal=logzio-metrics-listener-host=<<LISTENER-HOST>>
Output:
secret/logzio-metrics-secret created
The next step is to save your cluster details as a Kubernetes secret. You’ll need the following cluster details:
- KUBE-STATE-METRICS-NAMESPACE
- KUBE-STATE-METRICS-PORT
- CLUSTER-NAME
Replace the placeholders in the command below with the cluster details you retrieved and execute:
kubectl --namespace=kube-system create secret generic cluster-details
--from-literal=kube-state-metrics-namespace=<>
--from-literal=kube-state-metrics-port=<>
--from-literal=cluster-name=<>

secret/cluster-details created
Last but not least, deploy the Metricbeat daemonset with:
kubectl --namespace=kube-system create -f
https://raw.githubusercontent.com/logzio/logz-docs/master/shipping-config-samples/k8s-metricbeat.yml
You should see the following output:
configmap/logzio-cert created
configmap/metricbeat-config created
configmap/metricbeat-daemonset-modules created
daemonset.extensions/metricbeat-new created
configmap/metricbeat-deployment-modules created
clusterrolebinding.rbac.authorization.k8s.io/metricbeat created
clusterrole.rbac.authorization.k8s.io/metricbeat created
serviceaccount/metricbeat created
deployment.apps/metricbeat created
Make sure our Metricbeat pods are running:
kubectl get pods -n kube-system

NAME                                  READY STATUS RESTARTS AGE
aws-node-94l7z                        1/1 Running 0 32m
aws-node-ssfz9                        1/1 Running 0 32m
aws-node-vnwxq                        1/1 Running 0 32m
coredns-6f647f5754-cmbjw              1/1 Running 0 38m
coredns-6f647f5754-fqtrn              1/1 Running 0 38m
kube-proxy-fq9mx                      1/1 Running 0 32m
kube-proxy-qvhgc                      1/1 Running 0 32m
kube-proxy-zr56c                      1/1 Running 0 32m
kube-state-metrics-5458dddb44-nhvsc   1/1 Running 0 22m
metricbeat-586b769957-nthqk           1/1 Running 0 8m53s
metricbeat-new-kzp2b                  1/1 Running 0 8m53s
metricbeat-new-l7w2r                  1/1 Running 0 8m53s
metricbeat-new-xph8r                  1/1 Running 0 8m53s
Within a minute or two, your Kubernetes metrics will be shipped into Logz.io. It’s time to explore them using the metrics UI.
Step 2: Correlating between Kubernetes signals
Collecting logs and metrics from Kubernetes is not complicated. As shown above, there are a number of open source data shippers that do the job perfectly well. The challenge lies in being able to easily correlate between the signals.
Among open source tools, Grafana is a great analysis tool for metrics and Kibana is the de facto open source standard for investigating logs.
Now, if only we could get two tools like these together with proper correlation capabilities?
That sort of combination is exactly what Logz.io provides. Let’s see how.
Monitoring Kubernetes Metrics
Your metrics are stored in Logz.io in dedicated Elasticsearch indices that were designed to provide you with an optimized analysis experience. Using Elasticsearch’s rollup feature, metrics are automatically aggregated and downsampled. The metrics themselves can be visualized under the Metrics page in Logz.io.

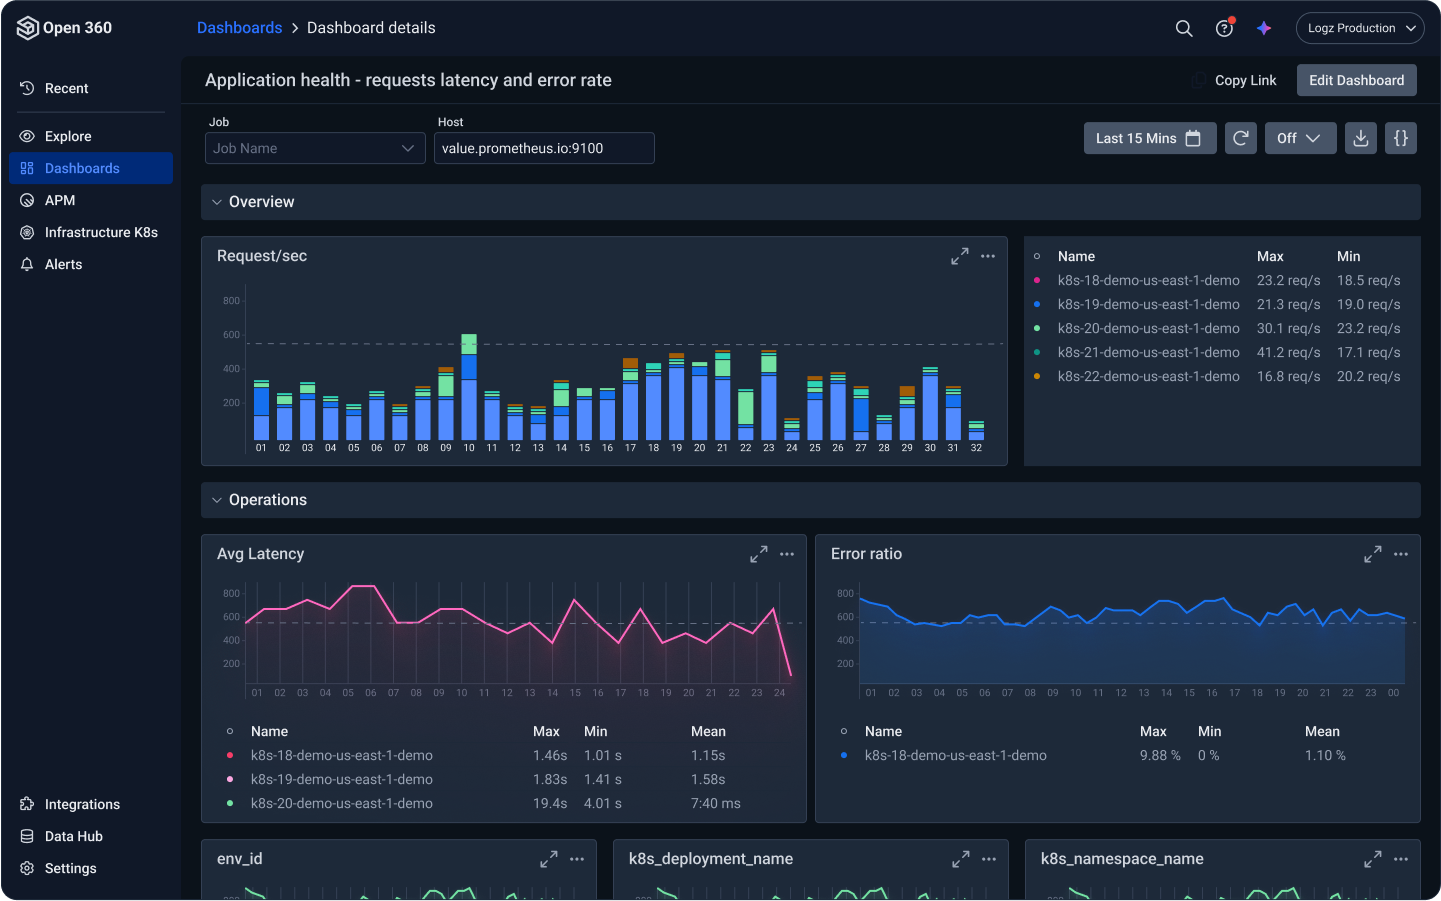
Logz.io provides multiple dashboards for monitoring Kubernetes both on the cluster level, the node level and the application level, as well as other dashboards for other environments. These can be found in the Logz.io Dashboards folder:

To start monitoring our Kubernetes cluster, I’m going to open the K8S Cluster dashboard:

Scrolling down, we see that we have an nginx pod that seems to be consuming a suspiciously high amount of memory and CPU:

To get a closer look, I’m going to filter the Pod Memory usage panel by clicking the nginx pod:

But this is just a symptom of an underlying issue. To drill down to the root cause, we’ll need to take a look at our nginx container logs. To this end, we’ll use the Explore in Kibana button on the panel.

Kibana is opened with all the relevant filters so you can seamlessly transition from monitoring metrics to log analysis. We can see that there’s a Java stack trace exception that’s showing up in the logs – which is probably the event to drill-down into.

Summing it up
A lot of engineers prefer to use open source observability tools. These tools offer flexibility, easy setup and community support, and of course, help reduce the dreaded vendor lock-in. For Kubernetes, these engineers will use fluentd to ship cluster and container logs into Elasticsearch, Prometheus and our metrics UI to build beautiful dashboards, and Jaeger to track performance issues across services.
Sounds great, right?
But there is an accompanying cost. At scale, the total cost of ownership rises. Engineers will have to spend time and resources to maintain these observability tools. Not only that, they will be less effective due to the siloed nature of these tools. When pressed for time, say when troubleshooting a production issue, for example, the last thing you want to bother yourself with is moving back and forth between different monitoring interfaces in different tools. It’s time-consuming and ineffective.
Logz.io aims to enable engineers to be more productive by allowing them to focus on what they do best and what matters most to their business — build and deliver great software. We do this by providing them with the best of breed open source observability tools they prefer to use as a fully managed solution, bundled in one unified platform and enhanced with enterprise-grade capabilities.
Give it a try. We’d love to get your feedback!


