A Kibana Tutorial: Getting Started
June 4, 2019

#Note: Elastic recently announced it would implement closed-source licensing for new versions of Elasticsearch and Kibana beyond Version 7.9. For more details, read our CEO Tomer Levy’s comments on Truly Doubling Down on Open Source.
Kibana is the visualization layer of the ELK Stack—the world’s most popular log analysis platform which is comprised of Elasticsearch, Logstash, and Kibana.More on the subject:
This tutorial will guide you through some of the basic steps for getting started with Kibana—installing Kibana, defining your first index pattern, and running some basic searches. We’ll also compare Kibana with OpenSearch Dashboards, the new forked version of Kibana launched by AWS after Elastic decided to close source Elasticsearch and Kibana in early 2021.
This tutorial is for anyone curious to install Kibana on their own. It assumes you’ve already got the database (Elasticsearch) and parsing tool (Logstash) configured and ready to go.
Need help installing Elasticsearch? Check out this Elasticsearch tutorial. If you haven’t installed Logstash yet, or are not familiar with how to use it, check out this Logstash tutorial.
If you’d rather not spend the time or resources installing and managing your own ELK Stack, Logz.io Log Management offers a fully managed service based on OpenSearch and OpenSearch Dashboards, which provides log ingestion, parsing, storage, and analysis dashboards out-of-the-box, at any scale.
Installing Kibana
Presuming you already have Elasticsearch installed and configured, we will start with installing Kibana. If you want to find out more about installing Elasticsearch, check out this Elasticsearch tutorial.
Depending on your operating system and your environment, there are various ways of installing Kibana. We will be installing Kibana on an Ubuntu 16.04 machine running on AWS EC2 on which Elasticsearch and Logstash are already installed.
Start by downloading and installing the Elastic public signing key:
wget -qO - https://artifacts.elastic.co/GPG-KEY-elasticsearch | sudo apt-key
add -
Add the repository definition:
echo "deb https://artifacts.elastic.co/packages/7.x/apt stable main" | sudo
tee -a /etc/apt/sources.list.d/elastic-7.x.list
It’s worth noting that there is another package containing only features available under the Apache 2.0 license. To install this package, use:
echo "deb https://artifacts.elastic.co/packages/oss-7.x/apt stable main" |
sudo tee -a /etc/apt/sources.list.d/elastic-7.x.list
All that’s left to do is to update your repositories and install Kibana:
sudo apt-get update
sudo apt-get install kibana
Open up the Kibana configuration file at: /etc/kibana/kibana.yml, and make sure you have the following configurations defined:
server.port: 5601
elasticsearch.url: "http://localhost:9200"
These specific configurations tell Kibana which Elasticsearch to connect to and which port to use.
Now, start Kibana with:
sudo service kibana start
Open up Kibana in your browser with: http://<yourServerIP>:5601. You will be presented with the Kibana home page.
Defining an index pattern
Your next step is to define a new index pattern, or in other words, tell Kibana what Elasticsearch index to analyze. To do that you will of course need to have data indexed.
For the purpose of this tutorial, we’ve prepared some sample data containing Apache access logs that is refreshed daily.
Next, we will use Logstash to collect, parse and ship this data into Elasticsearch. If you haven’t installed Logstash yet, or are not familiar with how to use it, check out this Logstash tutorial.
Create a new Logstash configuration file at: /etc/logstash/conf.d/apache-01.conf:
sudo vim /etc/logstash/conf.d/apache-01.conf
Enter the following Logstash configuration (change the path to the file you downloaded accordingly):
input {
  file {
    path => "/home/ubuntu/apache-daily-access.log"
    start_position => "beginning"
    sincedb_path => "/dev/null"
  }
}
filter {
    grok {
      match => { "message" => "%{COMBINEDAPACHELOG}" }
    }
    date {
    match => [ "timestamp" , "dd/MMM/yyyy:HH:mm:ss Z" ]
  }
    geoip {
      source => "clientip"
    }
}
output {
  elasticsearch {
    hosts => ["localhost:9200"]
  }
}
Start Logstash with:
sudo service logstash start

If all goes well, a new index will be created in Elasticsearch, the pattern of which can now be defined in Kibana.
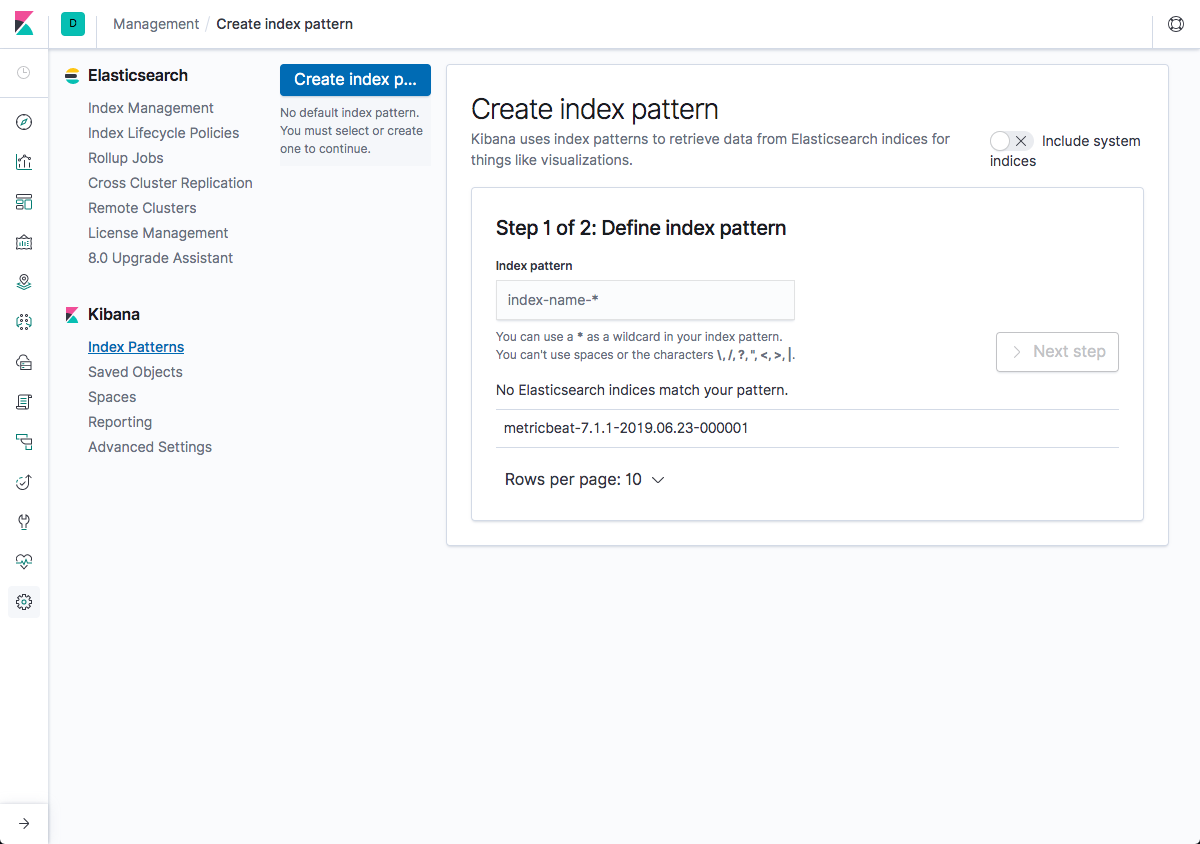
In Kibana, go to Management → Kibana Index Patterns, and Kibana will automatically identify the new “logstash-*” index pattern.
Define it as “logstash-*”, and in the next step select @timestamp as your Time Filter field.
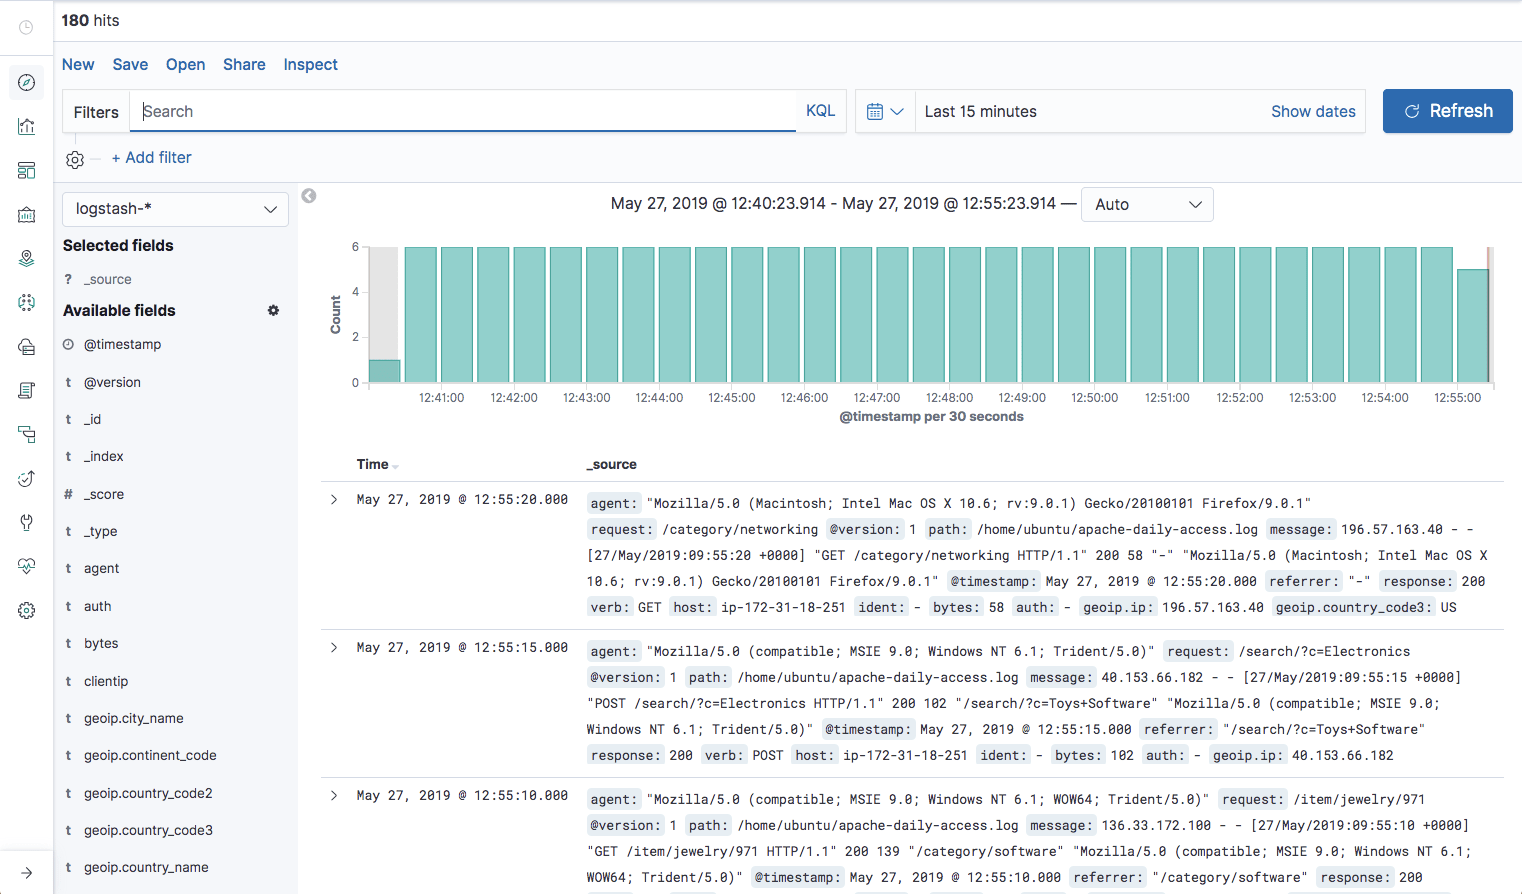
Hit Create index pattern, and you are ready to analyze the data. Go to the Discover tab in Kibana to take a look at the data (look at today’s data instead of the default last 15 mins).
Using Kibana in Logz.io
If you’re using Logz.io, simply use this cURL command to upload the sample log data. Logz.io listeners will parse the data using automatic parsing so there’s no need to configure Logstash (the token can be found on the Settings page in the Logz.io UI, and the type of the file is apache_access):
curl -T <Full path to file>
http://listener.logz.io:8021/file_upload/<Token>/apache_access
Kibana Searching
Kibana querying is an art unto itself, and there are various methods for performing searches on your data. This section will describe some of the most common search methods as well as some tips and best practices that should be memorized for optimized user experience.
KQL and Lucene
Up until version 6.2, the only way to query in Kibana was using Lucene syntax. Starting in version 6.2, another query language was introduced called Kuery, or as it’s been called now—KQL (Kibana Querying Language) to improve the searching experience.
Since version 7.0, KQL is the default language for querying in Kibana but you can revert to Lucene if you like. For the basic example below, there will be little difference in the search results.
Free-Text Search
Free text search works within all fields — including the _source field, which includes all the other fields. If no specific field is indicated in the search, the search will be done on all of the fields that are being analyzed.
In the search field at the top of the Discover page, run these searches and examine the result ( set the time parameter on the top right of the dashboard to the past month to capture more data):
- category
- Category
- categ
- cat*
- categ?ry
- “category”
- category\/health
- “category/health”
- Chrome
- chorm*
Tips and gotchas
Not case sensitive
Text searches are not case sensitive. This means that category and CaTeGory will return the same results. When you put the text within double quotes (“”), you are looking for an exact match, which means that the exact string must match what is inside the double quotes. This is why [category\/health] and [“category/health”] will return different results
Wildcard symbols and search
Kibana wildcard searches – you can use the wildcard symbols [*] or [?] in searches. [*] means any number of characters, and [?] means only one character
Field-Level Searches
Another common search in Kibana is field-level queries, used for searching for data inside specific fields. To use this type of search that, you need to use the following format:
<fieldname>:search
As before, run the following searches to see what you get (some will purposely return no results):
- name:chrome
- name:Chrome
- name:Chr*
- response:200
- bytes:65
- bytes:[65 TO *]
- bytes:[65 TO 99]
- bytes:{65 TO 99}
- _exists_:name
Tips and gotchas
Field-type dependency
- Field-level searches depend on the type of field. (Logz.io users – by default, none of the fields are analyzed, which means that searches in Logz.io are case-sensitive (unlike free-text search) and cannot use wildcard searches (again, unlike free-text search). The reason we save all of the fields as “not analyzed” is in order to save space in the index since the data is also duplicated in an analyzed field called _source)
Searching a range
- You can search a range within a field. If you use [], this means that the results are inclusive. If you use {}, this means that the results are exclusive.
_exists_
- Using the _exists_ prefix for a field will search the documents to see if the field exists
Capitalization and ranges
- When using a range, you need to follow a very strict format and use capital letters TO to specify the range
Logical Statements
You can use logical statements in searches in these ways:
- USA AND Firefox
- USA OR Firefox
- (USA AND Firefox) OR Windows
- -USA
- !USA
- +USA
- NOT USA
Tips and gotchas
- You need to make sure that you use the proper format such as capital letters to define logical terms like AND or OR
- You can use parentheses to define complex, logical statements
- You can use -,! and NOT to define negative terms
Kibana special characters
All special characters need to be properly escaped. The following is a list of all available special characters:
+ – && || ! ( ) { } [ ] ^ ” ~ * ? : \
Proximity searches
Proximity searches are an advanced feature of Kibana that takes advantage of the Lucene query language.
[categovi~2] means a search for all the terms that are within two changes from [categovi]. This means that all category will be matched.
Tips and gotchas
Proximity searches use a lot of system resources and often trigger internal circuit breakers in Elasticsearch. If you try something such as [catefujt~10], it is likely not to return any results due to the amount of memory used to perform this specific search.
Kibana Autocomplete

To help improve the search experience in Kibana, the autocomplete feature suggests search syntax as you enter your query. As you type, relevant fields are displayed and you can complete the query with just a few clicks. This speeds up the whole process and makes Kibana querying a whole lot simpler.
Kibana Filtering
To assist users in searches, Kibana includes a filtering dialog that allows easier filtering of the data displayed in the main view.
To use the dialog, simply click the Add a filter + button under the search box and begin experimenting with the conditionals. Filters can be pinned to the Discover page, named using custom labels, enabled/disabled and inverted.
Power users can also enter Elasticsearch queries using the Query DSL.
Thousands of engineers rely on Kibana’s search and visualization capabilities to troubleshoot their environments.
For those who prefer Kibana, but also require more advanced log analysis capabilities – such as anomaly detection, alerting, ML to automatically surface critical exceptions, and correlation with metrics and traces – Logz.io Log Management may be the better option. Logz.io adds these capabilities on top of OpenSearch Dashboards to accelerate log analysis and troubleshooting.
Summary
This tutorial covered the basics of setting up and using Kibana and provided the steps for setting up a test environment only. Tracking Apache access logs in production, for example, is better done using Filebeat and the supplied Apache module. The sample data provided can, of course, be replaced with other types of data, as you see fit. Kibana also provides sets of sample data to play around with, including flight data and web logs.
If you have any suggestions on what else should be included in the first part of this Kibana tutorial, please let me know in the comments below. The next Kibana tutorial will cover visualizations and dashboards.
Enjoy!

You Might Also Like

What’s New at Logz.io – January 2026

