
Securing Kubernetes with Open Source Falco and Logz.io Cloud SIEM
May 5, 2020

In a previous blog post I discussed the complexity of securing Kubernetes environments and some best practices. Unfortunately, even if we follow the best practices in setting up and configuring our system, we can never eliminate all the vulnerabilities. Similar to other systems, Kubernetes runtime security requires the ability to monitor our Kubernetes clusters for suspicious or anomalous behaviour, and use appropriate tools to monitor, alert and analyze incidents quickly and effectively, with as little false positive alerts as possible.
In this post I’d like to discuss:
- Monitoring Kubernetes audit logs and operational logs
- Monitoring Kubernetes API calls for potentially malicious behavior
- Falco open-source threat detection engine for Kubernetes, and
- How together with Logz.io Cloud SIEM, you can achieve effective threat monitoring in your environment.
I’ll also show it in action with some example attacks on containers (expect some reverse shell and recon action).
Monitoring security anomalies in Kubernetes logs
A new feature in Kubernetes (currently in beta) enables you to generate audit logs on the API invocations. A good security best practice is to enable the audit logger and monitor those logs for anomalous behavior.
Your operational Kubernetes monitoring logs can also provide indications for anomalous behavior and changes in an application’s behavior that could leave your system open to attack. Shipping those logs to a monitoring solution such as Logz.io enables you to set alerts and use dashboards and visualizations for investigation.
Kubernetes threat detection with Falco open source
Another important element in Kubernetes runtime security is monitoring the Kubernetes API calls to detect anomalous behavior that may indicate potential threats. We’re great believers in open source solutions. We use the ELK stack in our Cloud SIEM. We integrate with OSS security tools such as Zeek and Wazuh. We turned to the open source community for Kubernetes runtime security projects and found Falco. Falco is an interesting open source project for Kubernetes threat detection. It was started by Sysdig, and earlier this year it got accepted to the CNCF incubator, making it stand out. Falco uses Linux kernel instrumentation to monitor the system calls, and a rule engine matching those calls to known suspicious behavior. Once discovered, the potential threat is then output to stderr, a file or syslog.
We’ve integrated Falco with Logz.io Cloud SIEM, so you can collect, index, visualize and analyze the incidents raised by Falco, together with other sources, in your environment, on the ELK stack. We’ve prepared a Kibana dashboard you can use to view Falco’s alerts and to investigate them easily. Moreover, our security analysts have defined higher-order events provided in our Cloud SIEM together with a designated dashboard, which can help detect the sophisticated attacks hidden inside a haystack of false-positive alerts. Let’s have a look at how it works:
Shipping Falco events to Cloud SIEM and Enriching Rules
We will set Falco to write events to a file and will use open source Filebeat to ship those events from the file to Logz.io Cloud SIEM. We will also enrich Falco’s rules for better observability:
- Configure Falco rules to enrich observability. We’ve prepared a set of rules to use, and you can enrich more according to your system and needs. Falco’s rules are found in
falco_rules.yaml - Configure Falco to write its events to a file in a JSON format. Falco’s configuration is found under
falco.yaml. - Use Filebeat to listen on that output file and ship it to Logz.io, by configuring
filebeat.yml.
You can find a detailed tutorial on how to do these steps here.
If you’re new to Filebeat, check out this tutorial.
Now that we have the events indexed in Elasticsearch, let’s get to the real fun with the dashboards
Visualizing Falco Alerts (logs) in Cloud SIEM
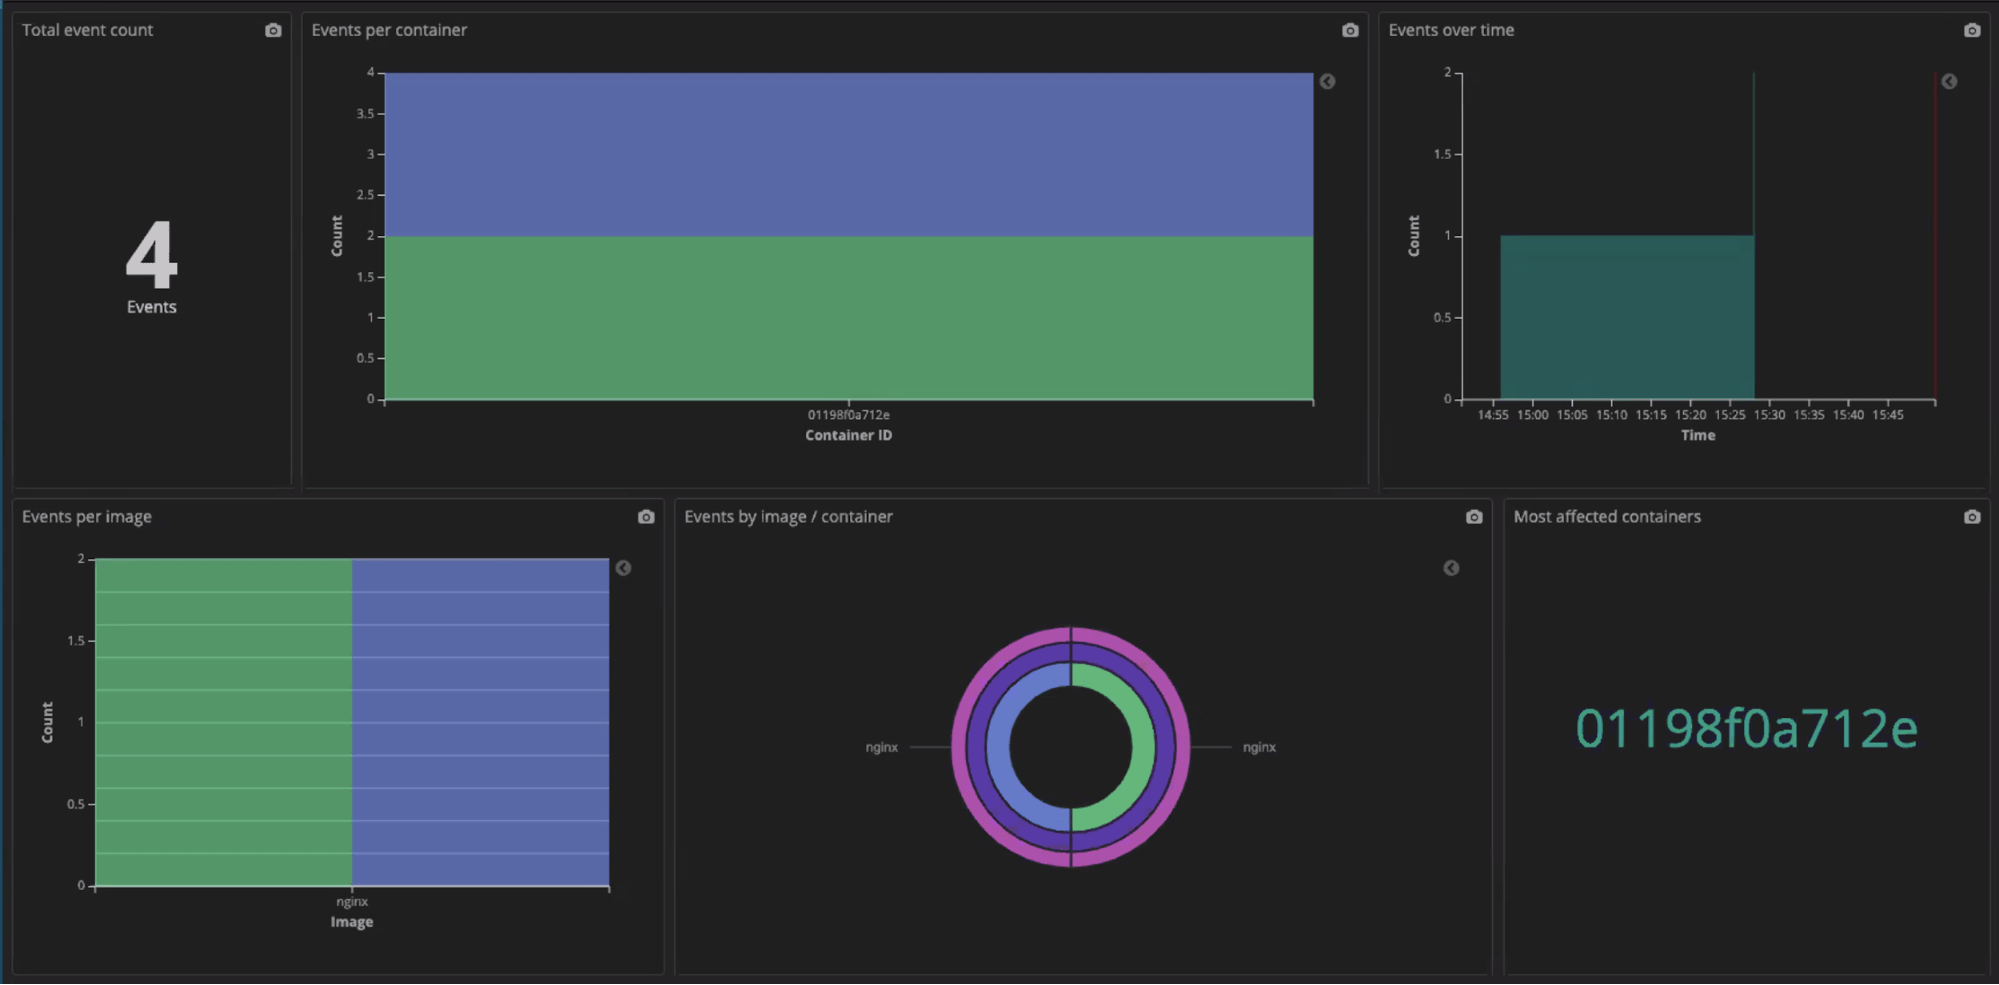
The pre-built Falco Log Summary Dashboard analyzes all of Falco’s events (called “logs” in Logz.io terminology) and shows them in various visualizations in the time window of choice: per container, per event, distribution, trend over time.
Let’s look at the following example dashboard:

We have nginx running in our Kubernetes cluster, and we can see the different nginx workloads. But then we see kube-proxy — that’s certainly not something I’d expect running on nginx!

Hovering over the suspicious instance can give us additional useful information such as the container ID and source image.
 You can of course click and filter to show only the relevant components, or zoom in on specific time windows in which the anomalous behaviour took place, just as you’re used to in Kibana. You can always clone and customise this Kibana dashboard to get the one that best suits your needs and processes.
Visualizing and Alerting High Order Events with Cloud SIEM
Falco provides a lot of useful information about the Kubernetes container’s activity. But oftentimes the challenge is to filter through the false positives and get to the real threats.
Let’s look at an example vulnerability, where an attacker that penetrated your container opens a reverse shell so the attacker can execute commands on your containers from outside your environment, start spreading through your network and take control from within. In this example:
1. The attacker uses netcat, the common utility for sending data across network connections, to connect to his C&C (command-and-control) server outside your organization, and executes a command shell. Since it is a reverse shell that is initiated from within your container, it will not be detected by traditional threat detection and can lead to malicious code running on your environment.

Attacker’s C&C server is set to connect to the reverse shell over netcat
2. The attacker can then scan your network using nmap for recon on the network devices and services running and their open ports.

3. After establishing that, the attacker can carry on exploiting these open ports and services to get access to other machines and spread through your network. The attacker could also carry malicious actions such as changing your SSH configuration to bypass security, and even spinning up a malicious C&C server inside your environment to avoid detection in follow-up malicious activity.
In this example, Falco can identify out of the box all netcat activity and alert on it. But that would include many valid communications operations with netcat. Cloud SIEM offers a designated rule for an attempt to start a command shell using netcat in a container. This rule identifies different shells, different variants of netcat and different means of execution. Other high-order rules cover security threats such as attempts to remove logging data from a container, attempts to alter SSH configuration, adding malicious repos to your container, or running recon tools.
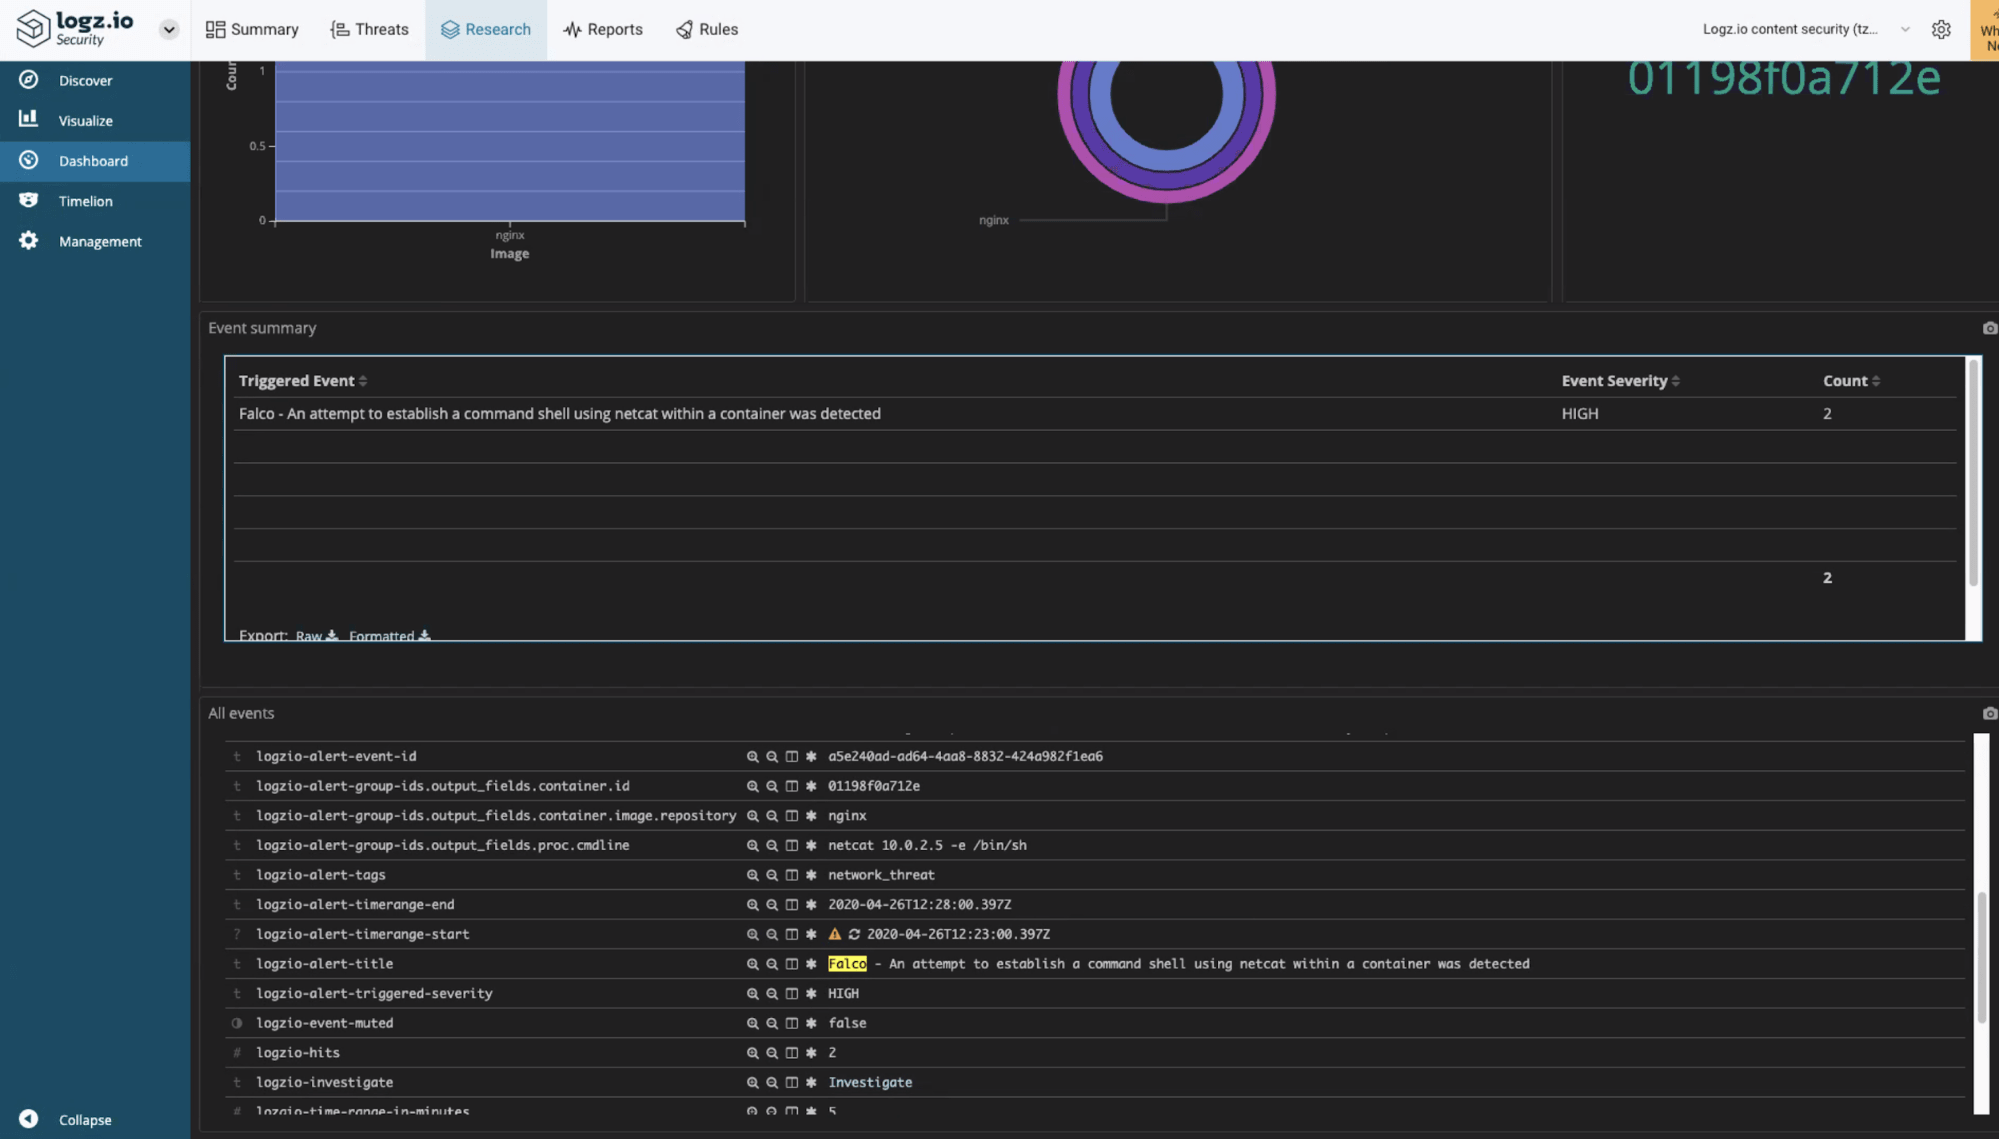
A pre-built Falco Event Summary Dashboard visualizes those events (not to be confused with the “logs” which refer to Falco’s raw events) and you can use it as first tier, in conjunction with the Falco Logs Dashboard, to monitor, prioritize your alerts and focus your investigations. Notifications can be sent to your destination of choice such as Slack or email.
In our example, Cloud SIEM will alert us on the attempt to establish a command shell using netcatwithin a container. The alert contains details of the container and suspicious command, as well as a detailed description of the behavior and suggested mitigation steps. Here it is on our Slack channel:

Cloud SIEM provides data enrichment on the alert (look under logzio-alerts-group-ids.*), as can seen in the above example:
- nginx container image (
container.image.repository) - container id (
container.id) - command-line executed (
proc.cmdline), - detailed human-readable description and suggested investigation and mitigation steps
You can then investigate the event using the Events dashboard:
Similarly, after establishing the reverse shell to his remote C&C, when the attacker tries to scan your network using nmap, you’ll be alerted on a potential recon tool activity:

You can then investigate the event using the popular Kibana dashboard capabilities:

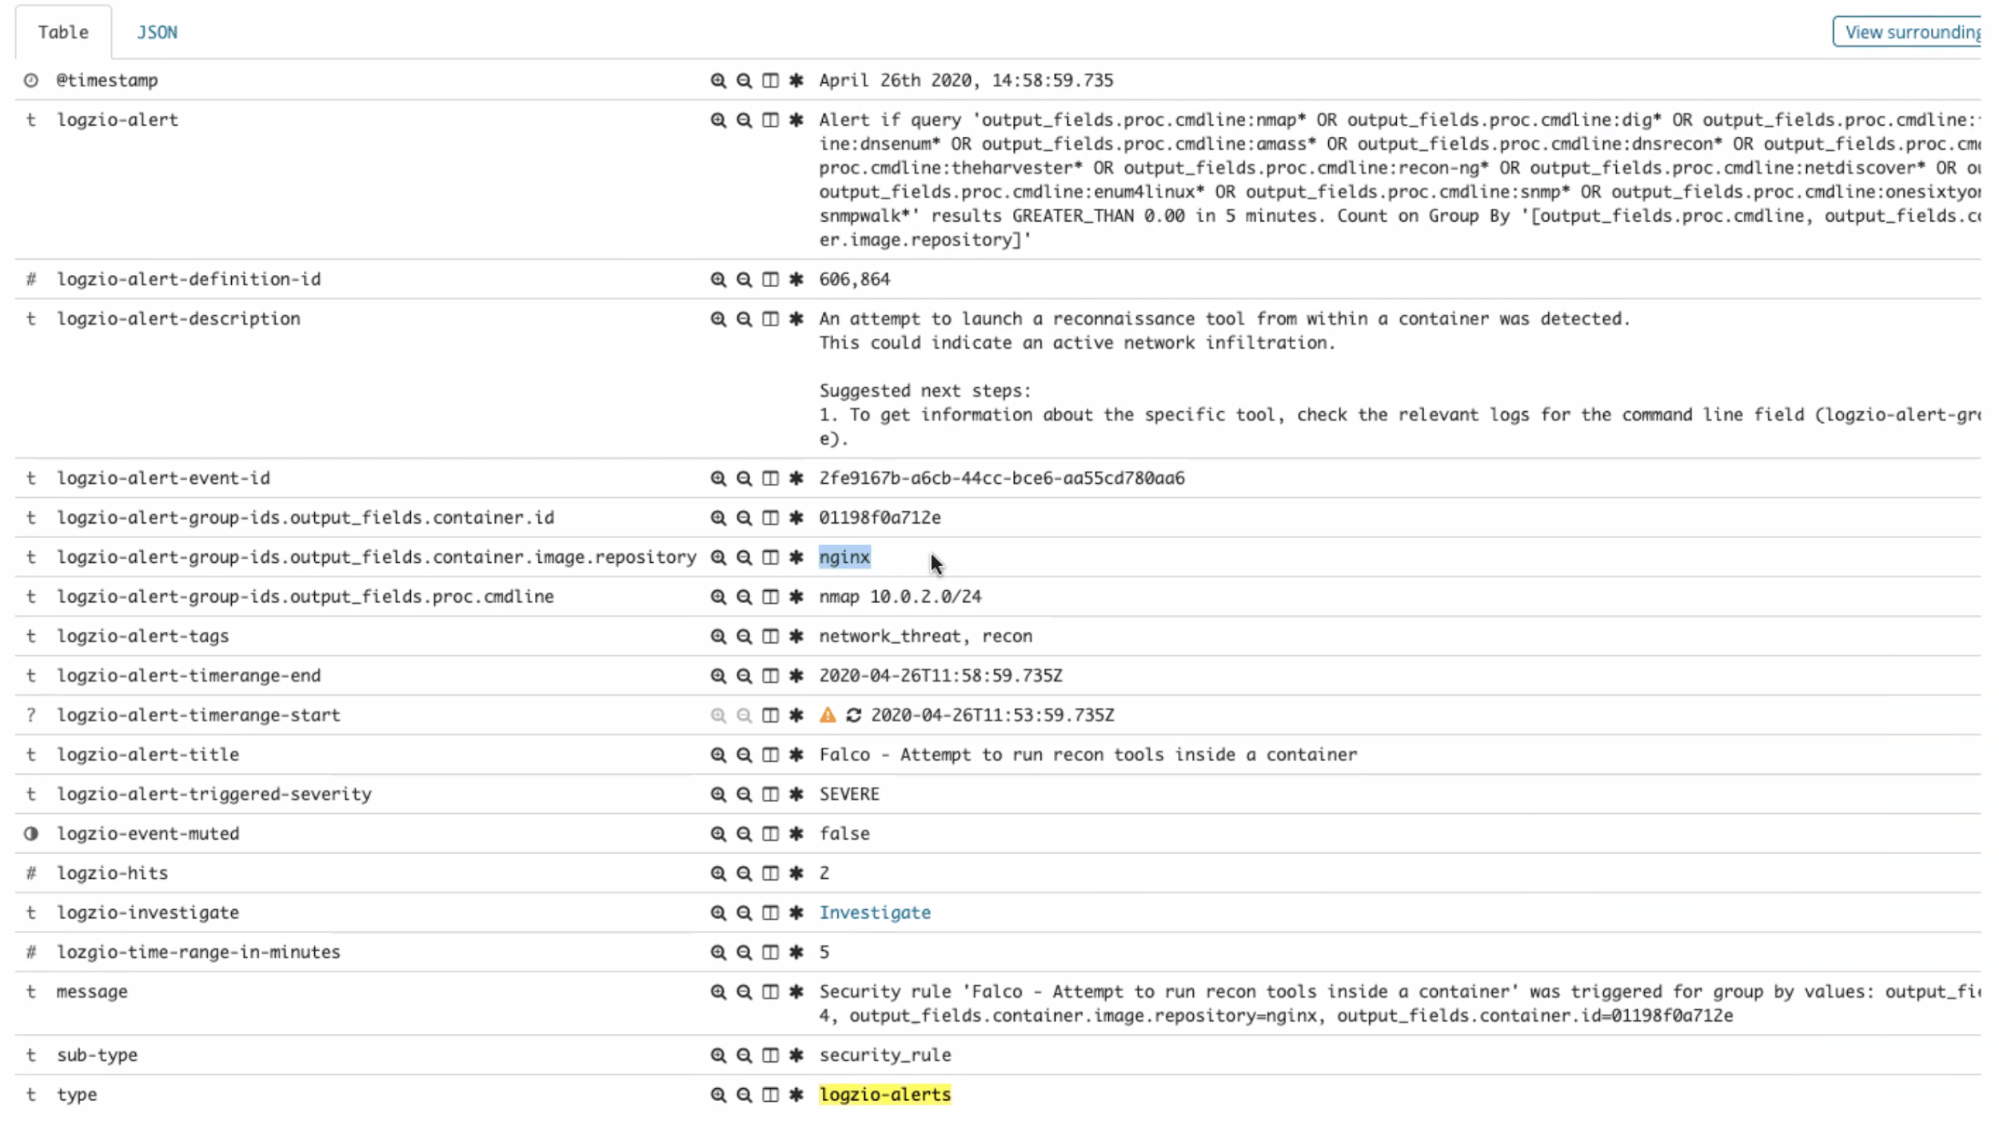
Clicking the “investigate” link in that alert will take you straight to Kibana Discover with a query result showing the alert trigger logs, where Tier-2 investigation can take place.
Some attacks may be more sophisticated and will require correlating several individual events to identify the kill chain. With all the information from Falco, as well as any other information on your systems available to the Cloud SIEM, you can set your rules and visualization for such high-order threats.
Endnotes
Everyone wants to run on Kubernetes and Docker and be cloud-native. But no one wants to compromise the security of his environment. This means properly configuring the components, managing privileges, and setting your overlay networks with proper segregation, to name a few best practices. But as we can’t prevent all vulnerabilities, we need good runtime logging, monitoring, and threat detection in place such as Falco open source, which is geared to the containers environment and activity. Now you can easily stream those logs and alerts to your Cloud SIEM, together with alerts from your other systems, and put good rules in place to flag and notify you of suspicious behavior and effectively investigate the incident for a quick resolution.

You Might Also Like

Introducing Multiple Shipping Tokens for Logz.io Accounts

