
Installing the ELK Stack on Mac OS X with Homebrew

What if I told you that it took me just under 10 minutes, 8 commands and 6 mouse clicks to create this bar chart informing me—big surprise—that I have too many open tabs in Chrome on my Mac? That might sound like a lot to some readers, but if you’re not a stranger to ELK you’ll know that installing the stack, even for testing and development purposes, usually involves a whole lot more than that. You can use Homebrew’s simple ctl to brew install Elasticsearch on Mac OS, as well as Kibana and the rest ELK Stack. A new official Homebrew tap developed by Elastic makes this procedure super easy.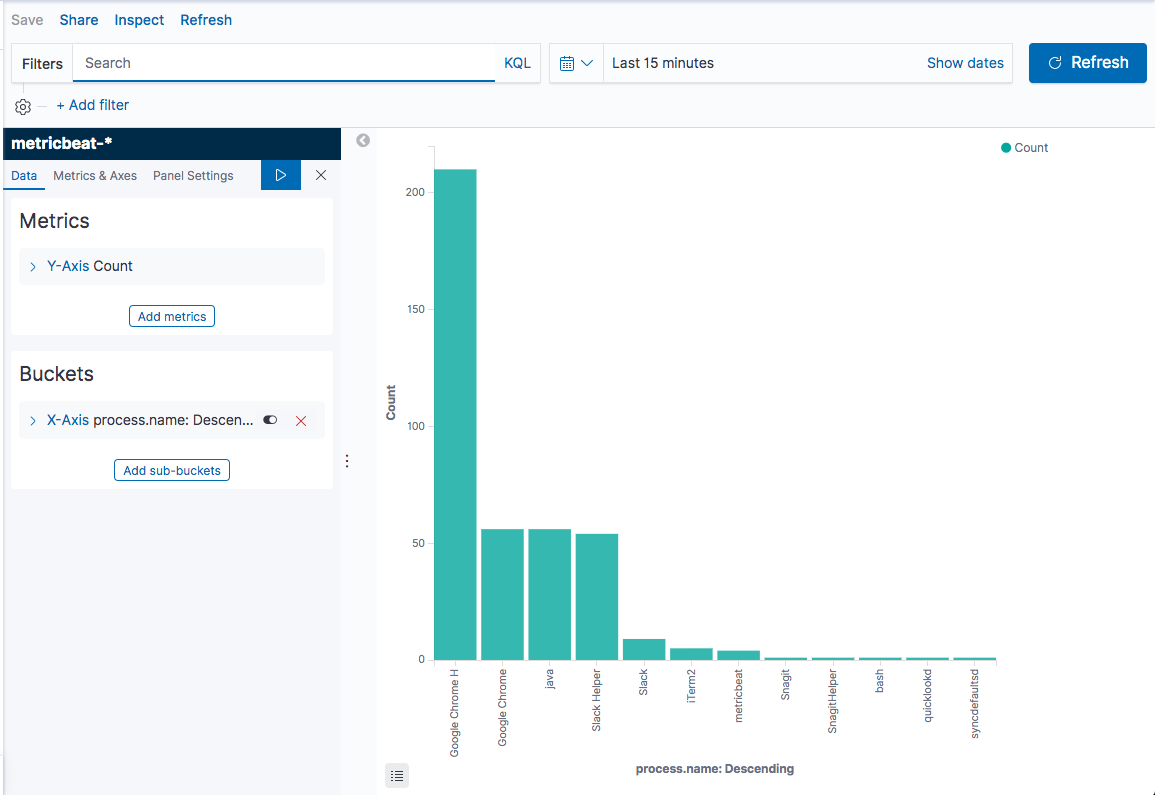
More on the subject:
What is Homebrew?
Homebrew is a popular open source package manager that makes installing software on Mac OS X much simpler. Instead of downloading the bundle’s source code manually, unarchiving it, and then configuring and running it, all you have to do is enter one simple command in your CLI.
Homebrew will download the source code, figure out if there are any dependencies, and download and compile them as well if necessary. It will then build the requested software and install it in one common location for easier access and updating. Homebrew’s inner workings and terminology are pretty straightforward but if you want to find out more, check out the docs.
What makes Homebrew so popular, especially among developers, is first and foremost, its ease of use and simplicity. Coupled with extensibility, one can easily understand why it’s probably the most popular package manager for Mac.
Let’s see how the new Homebrew tap can be used to set up ELK on your Mac.
Installing Homebrew
If you’ve already got Homebrew setup, feel free to skip to the next step. If not, here are the instructions you’ll need to install it.
As prerequisites, you’ll need a Mac of course (preferably running Mac OS X 10.10 or later), a CLI (Terminal works just fine) and some basic command line knowledge:
cd /usr/local

/usr/bin/ruby -e "$(curl -fsSL h
ttps://raw.githubusercontent.com/Homebrew/install/master/install)"
It should take a minute or two to install, after which, run the next command to verify the installation:
brew help
If you see some usage examples displayed, Homebrew has installed successfully.
Brew Install Elasticsearch on Mac
To install the ELK Stack, we will first install the new tap containing all of the Formulae for the different components in the stack:
brew tap elastic/tap
A total of 18 formulae are “tapped” as the output message informs us:
Cloning into '/usr/local/Homebrew/Library/Taps/elastic/homebrew-tap'...
remote: Enumerating objects: 23, done.

remote: Counting objects: 100% (23/23), done.

remote: Compressing objects: 100% (23/23), done.

remote: Total 23 (delta 11), reused 10 (delta 0), pack-reused 0

Unpacking objects: 100% (23/23), done.

Checking connectivity... done.

Tapped 18 formulae (64 files, 110.0KB).
Next, we’ll install Elasticsearch, Kibana, and Metricbeat (if you want to install the open source version of these components, simply replace -full with -oss):
brew install elastic/tap/elasticsearch-full
Homebrew will download and install Elasticsearch. This might take a minute or two:
==> Installing elasticsearch-full from elastic/tap
==> Downloading https://artifacts.elastic.co/downloads/elasticsearch/elasticsearch-7.1.1-darwin-x86_64.tar.gz?t
######################################################################## 100.0%
==> Caveats
Data:    /usr/local/var/lib/elasticsearch/elasticsearch_Daniel/
Logs:    /usr/local/var/log/elasticsearch/elasticsearch_Daniel.log
Plugins: /usr/local/var/elasticsearch/plugins/
Config:  /usr/local/etc/elasticsearch/

To have launchd start elastic/tap/elasticsearch-full now and restart at login:
  brew services start elastic/tap/elasticsearch-full
Or, if you don't want/need a background service you can just run:
  elasticsearch
==> Summary
🍺  /usr/local/Cellar/elasticsearch-full/7.1.1: 787 files, 531MB, built in 3 minutes 59 seconds
As instructed, run Elasticsearch with:
brew services start elastic/tap/elasticsearch-full
Or simply:
elasticsearch
To make sure, cURL Elasticsearch with:
curl http://localhost:9200
You should see the following output:
{
  "name" : "MacBook-Pro-4.local",
  "cluster_name" : "elasticsearch_Daniel",
  "cluster_uuid" : "x5an66f9TW6PUEqXUD9wUg",
  "version" : {
    "number" : "7.1.1",
    "build_flavor" : "default",
    "build_type" : "tar",
    "build_hash" : "7a013de",
    "build_date" : "2019-05-23T14:04:00.380842Z",
    "build_snapshot" : false,
    "lucene_version" : "8.0.0",
    "minimum_wire_compatibility_version" : "6.8.0",
    "minimum_index_compatibility_version" : "6.0.0-beta1"
  },
  "tagline" : "You Know, for Search"
}
Elasticsearch Connection Refused
Sometimes the connection is “refused” when you try to cURL http://localhost:9200:
curl: (7) Failed to connect to localhost port 9200: Connection refused
If this occurs, try changing the host IP to 0.0.0.0 and [“host1”] to [“0.0.0.0”].
If this also fails, change the host IP to 127.0.0.1 and [“0.0.0.0”] to [“127.0.0.1”].
Installing Kibana with Homebrew
Next, install Kibana with:
brew install elastic/tap/kibana-full
Kibana is downloaded and installed. And the output:
==> Installing kibana-full from elastic/tap
==> Downloading https://artifacts.elastic.co/downloads/kibana/kibana-7.1.1-darwin-x86_64.tar.gz?tap=elastic/homebrew-tap
######################################################################## 100.0%
==> Caveats
Config: /usr/local/etc/kibana/
If you wish to preserve your plugins upon upgrade, make a copy of /usr/local/opt/kibana-full/plugins before upgrading, and copy it into the new keg location after upgrading.
To run Kibana in the background, use:
brew services start elastic/tap/kibana-full
Or, if you don’t want/need a background service you can just run:
kibana
To access Kibana, open your browser at:
http://localhost:5601
You should see Kibana’s welcome screen
System Metrics Pipeline from Local Machine to Kibana
Next, let’s set up a simple data pipeline going using Metricbeat to ship some system metrics from our Mac:
brew install elastic/tap/metricbeat-full
Metricbeat is a much smaller package, so it’ll take just a few seconds to be downloaded and installed:
==> Installing metricbeat-full from elastic/tap
==> Downloading https://artifacts.elastic.co/downloads/beats/metricbeat/metricbeat-7.1.1-darwin-x86_64.tar.gz?tap=elastic/h
######################################################################## 100.0%
==> Caveats
To have launchd start elastic/tap/metricbeat-full now and restart at login:
brew services start elastic/tap/metricbeat-full
Or, if you don’t want/need a background service you can just run:
metricbeat
==> Summary
🍺  /usr/local/Cellar/metricbeat-full/7.1.1: 38 files, 70.0MB, built in 13 seconds
Again, to start Metricbeat you can use either of the following two commands:
brew services start elastic/tap/metricbeat-full
OR
metricbeat
Within a minute or two, Metricbeat will begin shipping system metrics to Elasticsearch. You can verify by listing Elasticsearch indices:
curl -X GET "localhost:9200/_cat/indices?v"

health status index                              uuid                   pri rep docs.count docs.deleted store.size pri.store.size
yellow open   metricbeat-7.1.1-2019.06.23-000001 nfaiVJxwRCCk1z_k2nsoUA   1   1        346            0      569kb          569kb
green  open   .kibana_1                          GBiD4P-wTW-kk8zpEP5TIA   1   0          3            0     14.1kb         14.1kb
green  open   .kibana_task_manager               tnZL7bfmQ4mplwSy0YGs5g   1   0          2            0     45.5kb         45.5kb
All you need to do now to start analyzing your Mac’s performance is define the new Metricbeat index pattern in Kibana.
Go to the management → Kibana → Index patterns page. You’ll see Kibana has automatically identified the new Elasticsearch index:
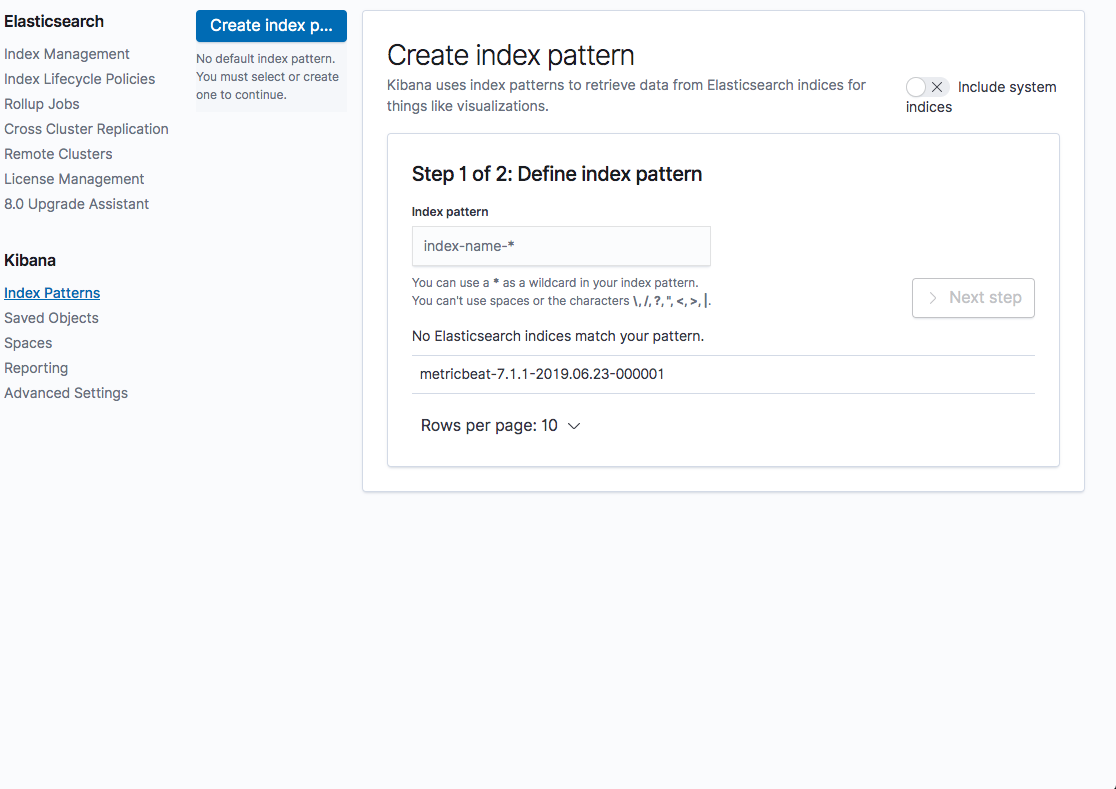
Define it as requested, proceed to the next step of selecting the @timestamp field, and create the new index pattern.
You can then open the Discover page to start analyzing your data:

From the list of available fields on the left, click the process name field and then the Visualize button.
A bar chart showing the most used processes my Mac is displayed:

Summing it up
I’m not great at math, but if I counted correctly, that’s eight simple commands to set up a development ELK Stack if you don’t have Homebrew installed. Two more clicks to get a useful visualization displayed!
So, a very simple way of getting started with the ELK Stack on Mac OS X and recommended for those users playing around and just getting their feet wet. You can still install the stack using the conventional method of course, but seriously — why would you do that?

You Might Also Like

5 Ways Logz.io’s Log Management UI Beats Kibana & OSD

Logz.io & PagerDuty Joint Webinar
Get started for free
Completely free for 14 days, no strings attached.
