How to Install the ELK Stack on Azure
May 12, 2019

The ELK Stack (Elasticsearch, Logstash & Kibana) offers Azure users with all the key ingredients required for monitoring their applications — Elasticsearch for scalable and centralized data storage, Logstash for aggregation and processing, Kibana for visualization and analysis, and Beats for collection of different types of data and forwarding it into the stack.
The ELK Stack can be deployed in a variety of ways and in different environments and we’ve covered a large amount of these scenarios in previous articles in this blog. As mentioned, this article covers what is an increasingly popular workflow — installing the ELK stack on Azure. We’ll start with setting up our Azure VM and then go through the steps of installing Elasticsearch, Logstash, Kibana and Metricbeat to set up an initial data pipeline.
A few things to note about ELK
Before we get started, it’s important to note two things. First, while the ELK Stack leveraged the open source community to grow into the most popular centralized logging platform in the world, Elastic decided to close source Elasticsearch and Kibana in early 2021. To replace the ELK Stack as a de facto open source logging tool, AWS launched OpenSearch and OpenSearch Dashboards as a replacement.
Second, while getting started with ELK is relatively easy, it can be difficult to manage at scale as your cloud workloads and log data volumes grow – plus your logs will be siloed from your metric and trace data.
To get around this, Logz.io manages and enhances OpenSearch and OpenSearch Dashboards at any scale – providing a zero-maintenance logging experience with added features like alerting, anomaly detection, and RBAC. If you don’t want to manage ELK on your own, check out Logz.io Log Management.
Alas, this article is about setting up ELK, so let’s get started.
The Azure environment
Our first and initial step is to set up the Azure environment. In the case of this tutorial, this includes an Ubuntu 18.04 VM, with a Network Security Group configured to allow incoming traffic to Elasticsearch and Kibana from the outside.
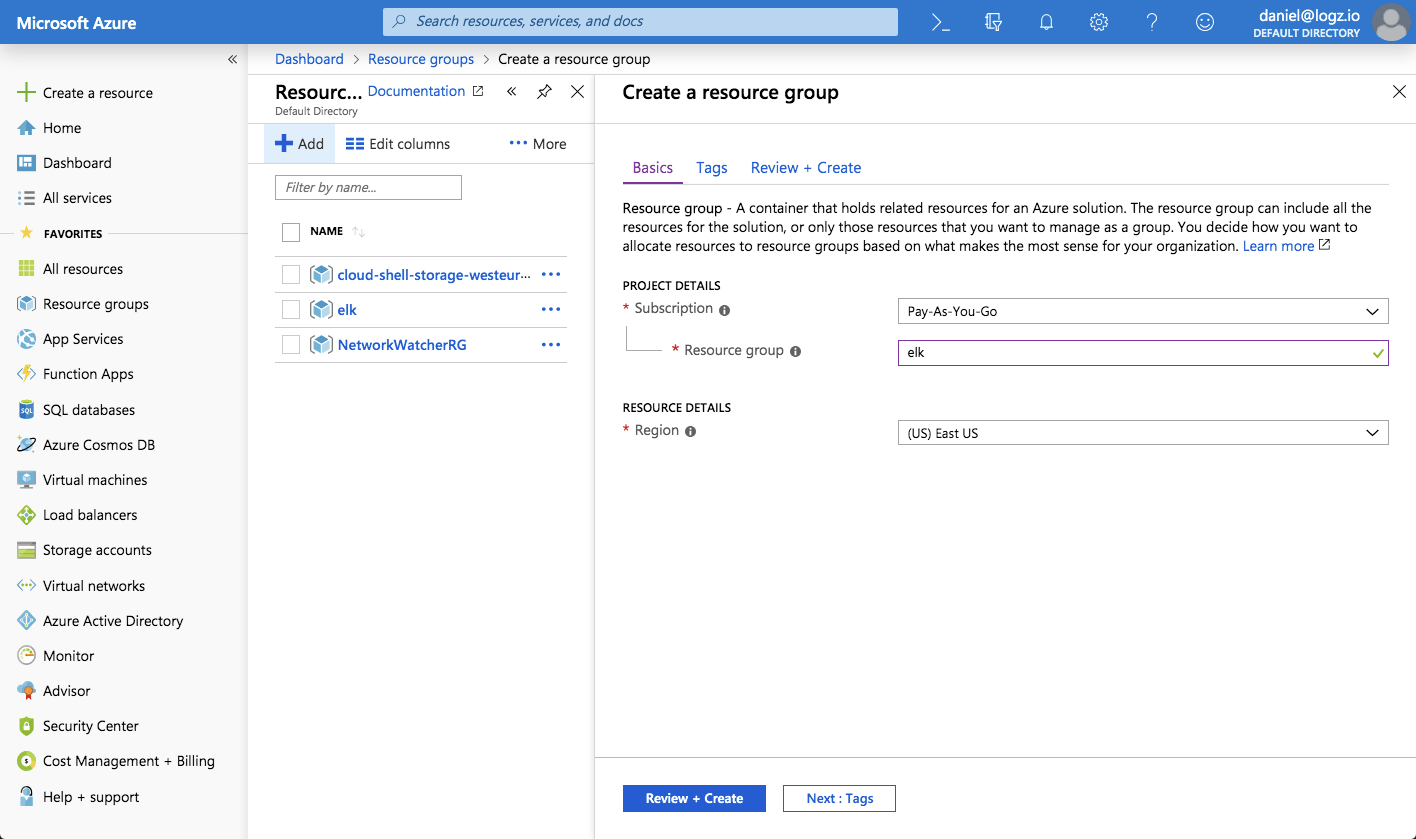
We’ll start by creating a new resource group called ‘elk’:
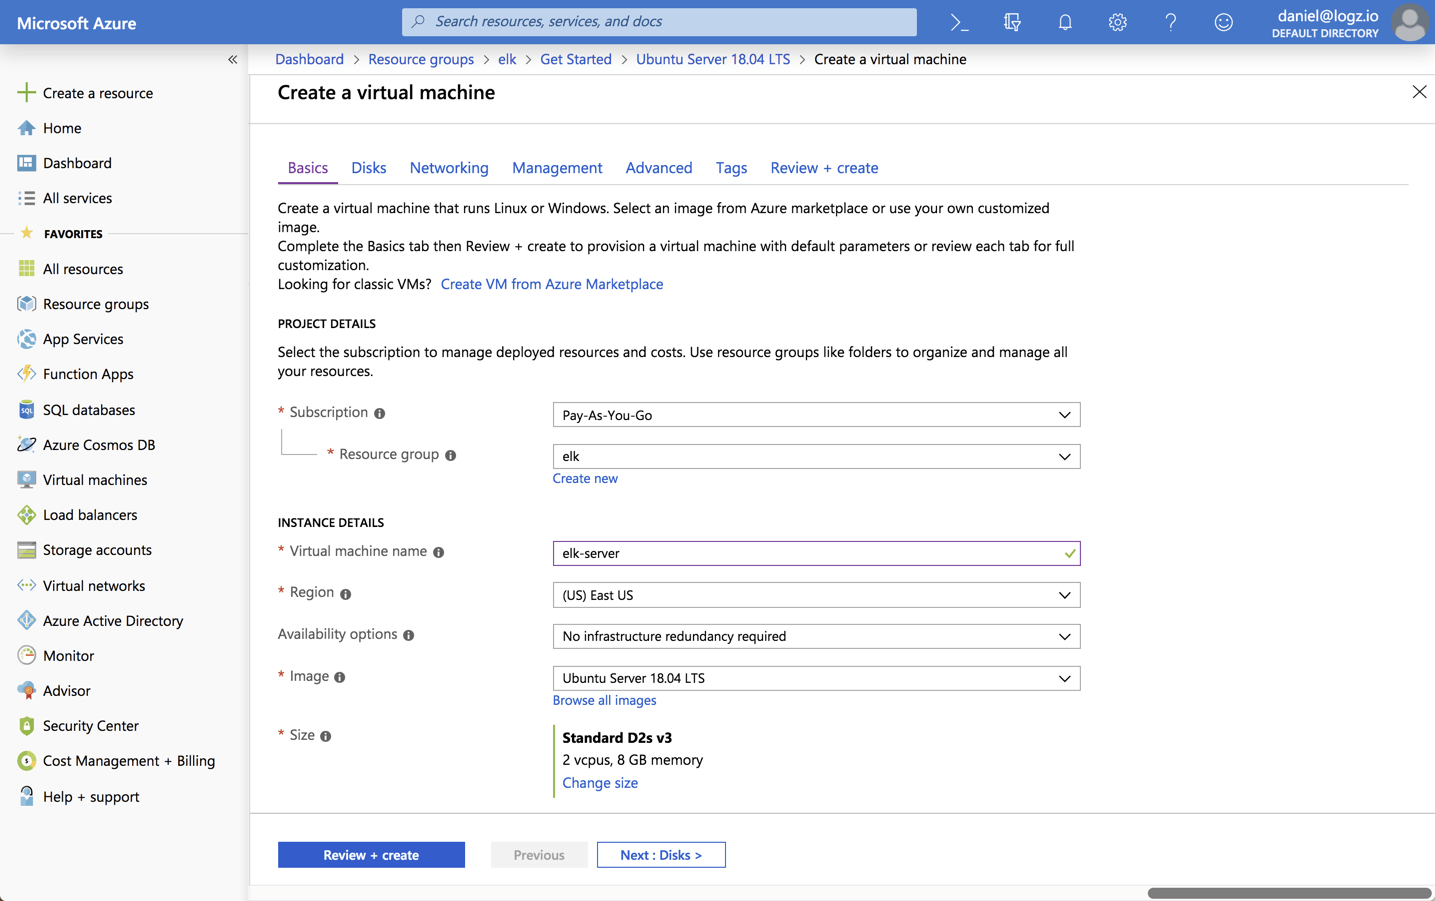
In this resource group, I’m going to deploy a newUbuntu 18.04 VM:
Please note that when setting up the VM for testing or development purposes, you can make do with the default settings provided here. But for handling real production workloads you will want to configure memory and disk size more carefully.
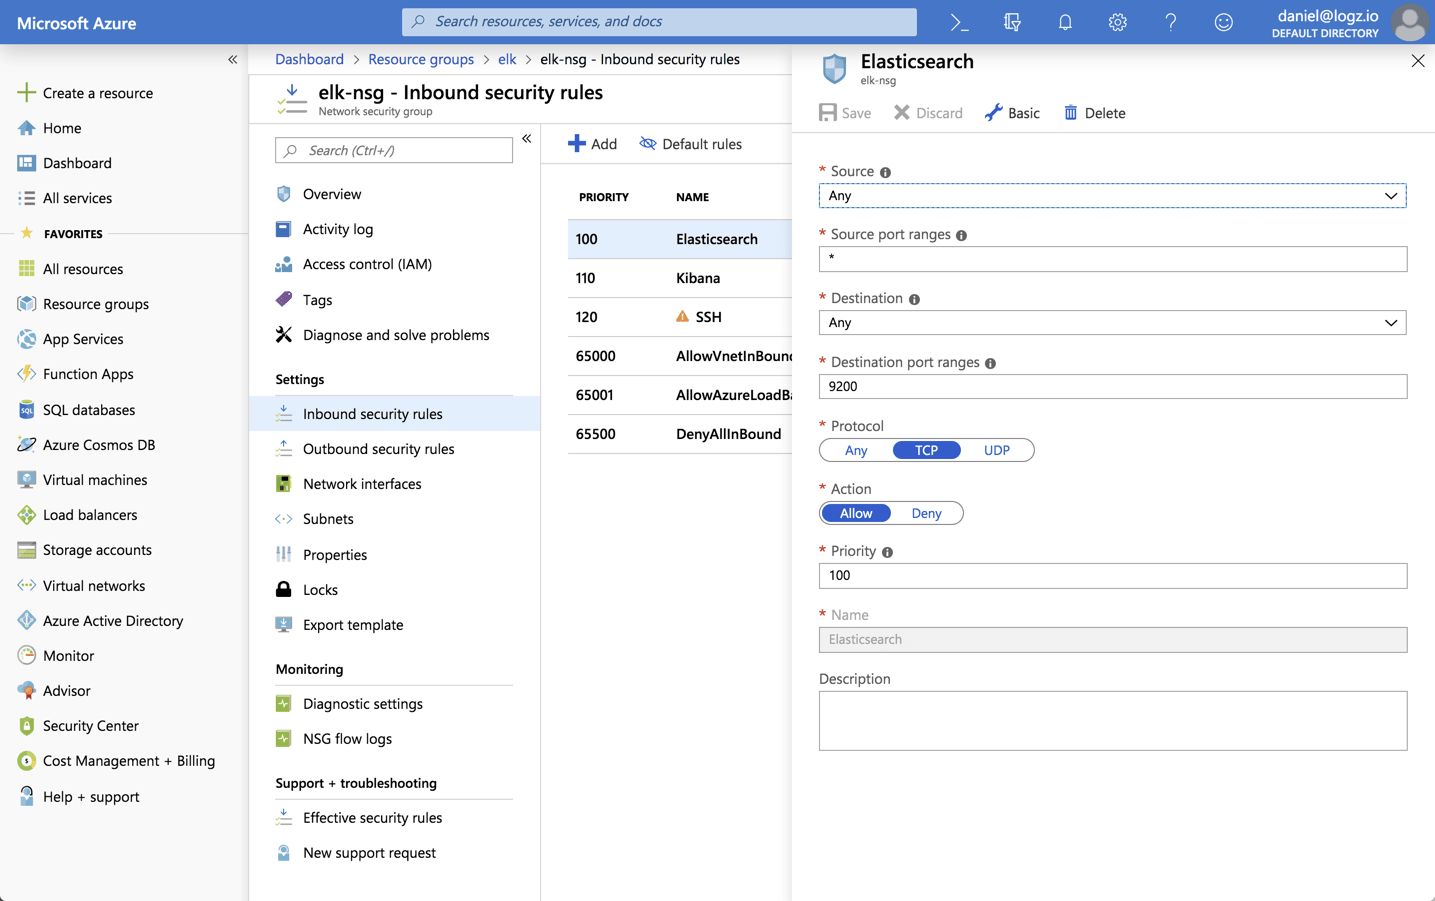
Once your VM is created, open the Network Security Group created with the VM and add inbound rules for allowing ssh access via port 22 and TCP traffic to ports 9200 and 5601 for Elasticsearch and Kibana:
Now that our Azure environment is ready, we can now proceed with installing the ELK Stack on our newly created VM.
Installing Elasticsearch
To install Elasticsearch we will be using DEB packages.
First, you need to add Elastic’s signing key so that the downloaded package can be verified (skip this step if you’ve already installed packages from Elastic):
wget -qO - https://artifacts.elastic.co/GPG-KEY-elasticsearch | sudo apt-key add -
For Debian, we need to then install the apt-transport-https package:
sudo apt-get update
sudo apt-get install apt-transport-https
The next step is to add the repository definition to your system:
echo "deb https://artifacts.elastic.co/packages/7.x/apt stable main" | sudo
tee -a /etc/apt/sources.list.d/elastic-7.x.list
All that’s left to do is to update your repositories and install Elasticsearch:
sudo apt-get update && sudo apt-get install elasticsearch
Elasticsearch configurations are done using a configuration file (On Linux: /etc/elasticsearch/elasticsearch.yml)that allows you to configure general settings (e.g. node name), as well as network settings (e.g. host and port), where data is stored, memory, log files, and more.
sudo su
vim /etc/elasticsearch/elasticsearch.yml
Since we are installing Elasticsearch on Azure, we will bind Elasticsearch to localhost. Also, we need to define the private IP of our Azure VM (you can get this IP from the VMs page in the console) as a master-eligible node:
network.host: "localhost"
http.port:9200
cluster.initial_master_nodes: ["<PrivateIP"]
Save the file and run Elasticsearch with:
sudo service elasticsearch start
To confirm that everything is working as expected, point curl or your browser to http://localhost:9200, and you should see something like the following output (give Elasticsearch a minute to run):
{
  "name" : "elk",
  "cluster_name" : "elasticsearch",
  "cluster_uuid" : "nuDp3c-JSU6tW-kqqPW68A",
  "version" : {
    "number" : "7.0.1",
    "build_flavor" : "default",
    "build_type" : "deb",
    "build_hash" : "e4efcb5",
    "build_date" : "2019-04-29T12:56:03.145736Z",
    "build_snapshot" : false,
    "lucene_version" : "8.0.0",
    "minimum_wire_compatibility_version" : "6.7.0",
    "minimum_index_compatibility_version" : "6.0.0-beta1"
  },
  "tagline" : "You Know, for Search"
}
Installing an Elasticsearch cluster requires a different type of setup. Read our Elasticsearch Cluster tutorial for more information on that.
Installing Logstash
Logstash requires Java 8 or Java 11 to run so we will start the process of setting up Logstash with:
sudo apt-get install default-jre
Verify Java is installed:
java -version

openjdk version "1.8.0_191"
OpenJDK Runtime Environment (build 1.8.0_191-8u191-b12-2ubuntu0.16.04.1-b12)
OpenJDK 64-Bit Server VM (build 25.191-b12, mixed mode)
Since we already defined the repository in the system, all we have to do to install Logstash is run:
sudo apt-get install logstash
Before you run Logstash, you will need to configure a data pipeline. We will get back to that once we’ve installed and started Kibana.
Installing Kibana
As before, we will use a simple apt command to install Kibana:
sudo apt-get install kibana
Open up the Kibana configuration file at: /etc/kibana/kibana.yml, and make sure you have the following configurations defined:
server.port: 5601
elasticsearch.url: "http://localhost:9200"
These specific configurations tell Kibana which Elasticsearch to connect to and which port to use.
Now, start Kibana with:
sudo service kibana start
Open up Kibana in your browser with: http://localhost:5601. You will be presented with the Kibana home page.
Installing Beats
The various data shippers belonging to the Beats family can be installed in exactly the same way as we installed the other components.
As an example, let’s install Metricbeat to send some host metrics from our Azure VM:
sudo apt-get install metricbeat
To start Metricbeat, enter:
sudo service metricbeat start
Metricbeat will begin monitoring your server and create an Elasticsearch index which you can define in Kibana. Curl Elasticsearch to make sure:
curl 'localhost:9200/_cat/indices?v'

health status index                              uuid                   pri rep docs.count docs.deleted store.size pri.store.size
yellow open   metricbeat-7.0.1-2019.05.12-000001 ULSQBIigQqK2zCUL3G-4mQ   1   1       6523            0      3.8mb          3.8mb
green  open   .kibana_1                          tlx3dbPySR2CBQM58XTYng   1   0          3            0     12.2kb         12.2kb
To begin analyzing these metrics, open up the Management → Kibana → Index Patterns page in Kibana. You’ll see the newly created ‘metricbeat-*’ index already displayed:
All you have to do now is enter the index pattern, select the @timestamp field and hit the Create index pattern button. Moving over to the Discover page, you’ll see your Azure VM host metrics displayed:
Congratulations! You have set up your first ELK data pipeline! More information on using the different beats is available on our blog: Filebeat, Metricbeat, Winlogbeat, Auditbeat.
ELK on Azure…at scale
Azure offers users the flexibility and scalability they require to install and run the ELK Stack at scale. As seen in the instructions above, setting up ELK on Azure VMs is pretty simple. Of course, things get more complicated in full-blown production deployments of the stack.
Data pipelines built for collecting, processing, storing and analyzing production environments require additional architectural components and more advanced configuration. For example, a buffering layer (e.g. Kafka) should be put in place before Logstash to ensure a data flow that is resilient and that can stand the pressure of data growth and bursts. Replicating across availability zones is recommended to ensure high availability. And the list goes on.
This requires time and resources that not every organization can afford to spend. Logz.io offers Azure users with a fully managed ELK solution for monitoring their applications, including seamless integration with Azure and built-in dashboards for various Azure resources such as Active Directory, Application Gateway, Activity Logs and more.


