What is Infrastructure Monitoring?
How it Works, Key Metrics & Use Cases
September 4, 2025
Key Takeaways:
- Infrastructure monitoring continuously collects and analyzes data from servers, networks, storage, containers, databases, and cloud systems to detect issues before they impact users.
- Monitoring platforms gather telemetry data (metrics and logs), trigger alerts on anomalies, visualize insights in dashboards, and increasingly automate remediation through AI and orchestration tools.
- Key infrastructure monitoring metrics include CPU, memory, disk I/O, network throughput and latency, uptime, error rates, and container stability.
- Use cases span performance optimization, downtime management, capacity planning, CI/CD monitoring, and compliance/security enforcement. This makes monitoring a foundation for DevOps success.
- Best practices involve unifying logs and metrics, monitoring Kubernetes holistically, setting contextual alerts, and optimizing data retention.
What Is Infrastructure Monitoring?
Infrastructure monitoring is the process of continuously collecting, analyzing, and visualizing data from an organization’s IT infrastructure. With infrastructure monitoring, DevOps teams can maintain system health, meet SLAs, reduce downtime, and detect and resolve issues proactively. This ensures optimal performance, availability, and reliability.
Key networks components infrastructure monitoring typically covers:
- Servers – CPU, memory, disk usage, and uptime across physical, virtual, or cloud-hosted servers.
- Networks – Bandwidth usage, packet loss, latency, and device health (like routers, switches, firewalls).
- Storage Systems – Disk performance, capacity, I/O operations, and failure predictions.
- Cloud Infrastructure – Cloud providers (AWS, Azure, GCP) for instance health, service usage, and cost optimization.
- Containers & Orchestration – Containerized workloads (e.g., Docker, Kubernetes) for resource allocation, pod status, and orchestration health.
- Databases – Query performance, replication, availability, and connection issues.
How Does Infrastructure Monitoring Work?
Infrastructure performance monitoring is about continuously collecting and analyzing performance and health data from across your environments. The core processes involved:
1. Data Collection – Agents, APIs, or log shippers gather telemetry data from various infrastructure components. Collection happens in real time or near-real time and is often streamed to a centralized monitoring platform.
2. Alerting – The data is evaluated against predefined thresholds or anomaly detection models. When performance drops or failures occur (e.g., a CPU spike or a service crash), the system triggers alerts so teams can act quickly. Alerts in productivity tools like email, Slack, or PagerDuty, help streamline the process.
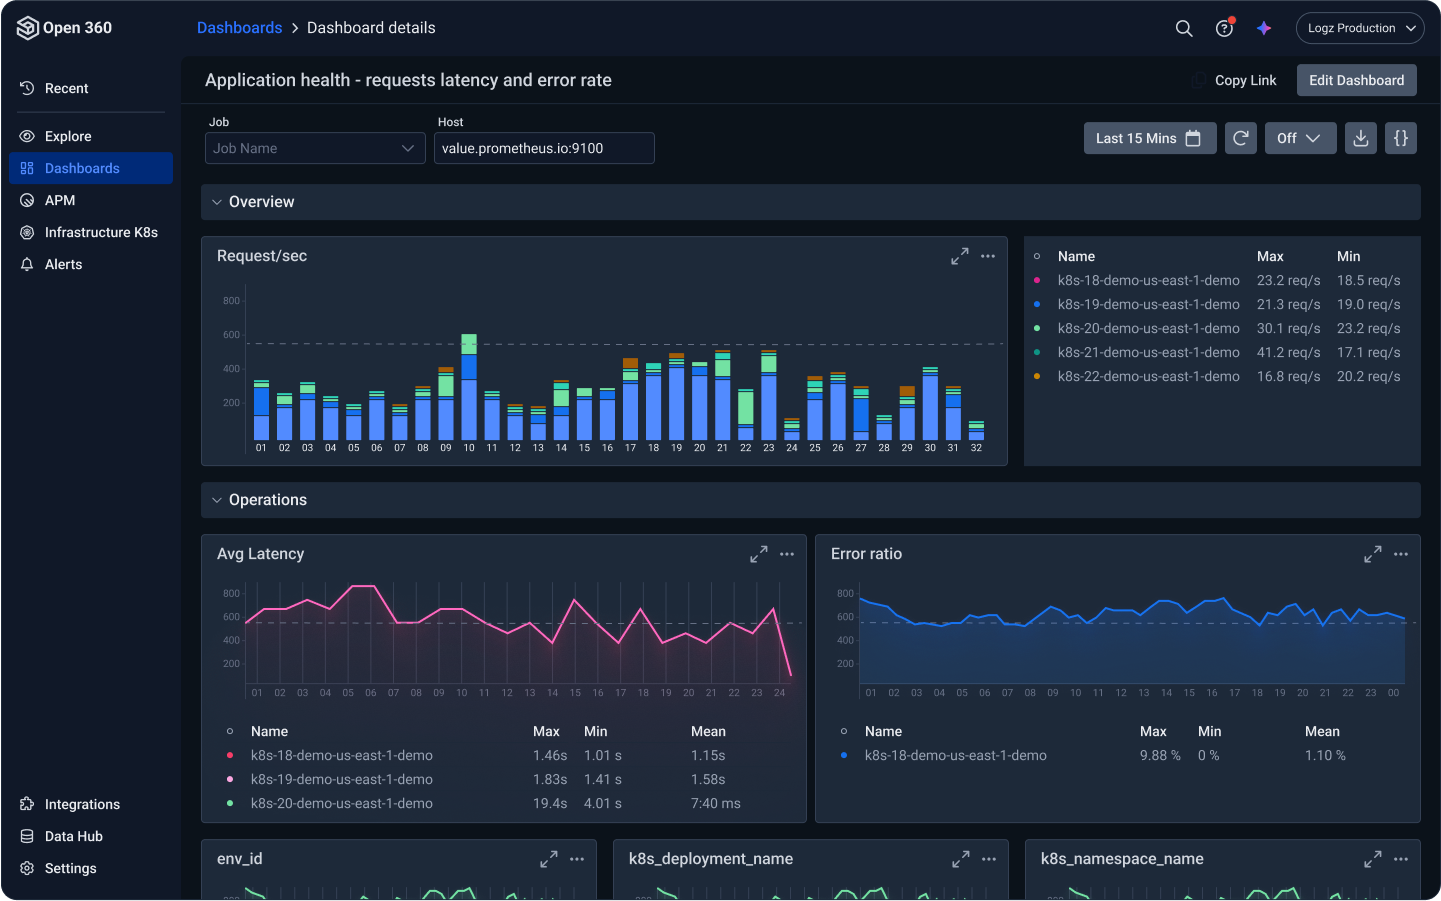
3. Dashboards & Visualization -The correlated telemetry data in displayed dashboards. This visibility into system health and trends helps teams understand what’s happening and prioritize issues. Customizable views let different teams focus on what matters most to them. When AI is used in modern monitoring infrastructure frameworks, agents can surface insights, provide recommendations and create customized dashboards.
4. Automation & Remediation – Advanced systems provide remediation guidance or integrate with orchestration tools to automate remediation. This reduces manual work and accelerates recovery.
Key Metrics Tracked in Infrastructure Monitoring
- CPU Usage – The percentage of processing power being used by the system. High CPU usage can lead to sluggish performance or application timeouts.
- Memory Usage – The amount of RAM currently in use versus what’s available. Insufficient memory can cause applications to crash or the system to start swapping to disk, which is much slower.
- Disk Usage – The amount of disk space used on a physical or virtual storage device. Running out of disk space can crash applications or prevent log and data writes.
- Disk I/O – The speed and volume of read/write operations to the disk. High disk I/O indicates heavy usage, which can slow down apps or databases that rely on disk access.
- Network Throughput – The amount of data being transmitted in and out of the system over a network interface. Bottlenecks in network traffic can degrade service responsiveness or even cause outages.
- Network Latency – The time it takes for data to travel from source to destination. High latency results in laggy applications and poor user experience.
- System Uptime – The total time a system has been continuously running without a restart or failure. High uptime is typically a sign of system stability and reliability.
- Error Rates – The percentage of requests that result in failures (e.g., 500 errors, timeouts). Elevated error rates are often the first sign something is broken.
- Request Rate (RPS/QPS) – The number of requests or queries processed. This helps understand load and scaling requirements.
- Response Time – The time it takes for the system to respond to a request. Slow response times directly impact user satisfaction and can indicate performance issues.
- Service Availability – The percentage of time a system is operational and accessible. Availability is often tied to SLAs and business continuity.
- Container Metrics – How often a container is restarted and actual usage versus configured thresholds. These indicate system stability (or lack thereof).
Common Use Cases for Infrastructure Monitoring
Here are some of the most common and impactful real-world use cases for infrastructure monitoring, across various industries and system types:
| Use Case | Explanation | Example |
| System Performance | Detecting and resolving bottlenecks | RCA of a slow loading web app |
| Downtime Management | Alerts and real-time notifications | Alerting about a database cluster overnight failure |
| Optimizing Resource Use | Forecasting resource use and capacity planning | Planning for holiday e-commerce website traffic |
| Monitoring CI/CD pipelines | Tracking build servers, artifact repositories, and pipeline runtimes health | RCA of slow deployment jobs |
| Compliance, Security | Ensuring secure configuration and anomaly alerts | Alerting about unauthorized system changes |
Benefits of Infrastructure Monitoring
Infrastructure monitoring offers several key benefits that significantly enhance the performance and resilience of your systems:
- Improved Reliability – By continuously tracking the health of servers, networks, and applications, monitoring helps detect issues before they impact users. This proactive approach minimizes downtime and ensures systems stay operational.
- Faster Troubleshooting – With real-time alerts and detailed logs, teams can quickly identify root causes and resolve incidents faster. This reduces MTTR and limits business disruption.
- Better Resource Management: Visibility into usage trends across compute, memory, storage, and bandwidth enables smarter capacity planning, cost optimization, and more efficient scaling of resources.
- Enhanced Performance: Identifying performance bottlenecks and latency issues early helps maintain optimal system speed and responsiveness, improving the end-user experience.
- Stronger Security Posture: Early identification of anomalies helps quickly investigate and respond to potential security threats.
- Support for Compliance and Auditing: Infrastructure logs and metrics serve as valuable evidence for audits and regulatory compliance, helping meet industry requirements.
Choosing the Right Infrastructure Monitoring Tool
The right infrastructure monitoring tool will enhance system reliability, team productivity, and incident response times. Here’s a structured way to evaluate and choose:
1. Define Your Requirements
Start by identifying what you need to monitor and why:
- Scope: Do you need to monitor servers, containers, databases, cloud resources?
- Scale: How many endpoints or services will be monitored?
- Environments: On-premises, cloud, hybrid, or multi-cloud?
2. Assess Key Features
Look for core capabilities such as:
- Real-time metrics collection
- Telemetry data management: Centralized collection, parsing, correlation and searchability for logs and metrics.
- Kubernetes support.
- Alerting & notifications: Real-time alerting and customizable thresholds, anomaly detection, and integrations with Slack, PagerDuty, etc.
- Dashboards: Easy-to-build and slide-and-dice visualizations for different teams or services.
- Automation: Self-healing, auto-remediation, or intelligent triage via AI/ML.
- APIs & integrations
3. Evaluate Ease of Use & Deployment
- Setup Time: Can your team get up and running quickly?
- Learning Curve: Is the UI intuitive? Does it require heavy customization or scripting?
- Support & Documentation: Are knowledge bases, tutorials, and customer support readily available?
4. Consider Cost & Licensing Model
- Pricing: Per-host, per-metric, per-GB of logs?
- Scalability: How does cost change as you grow?
- Free Tiers or Trials: Can you evaluate before committing?
5. Review Security & Compliance
Ensure capabilities such as:
- Data encryption in transit and at rest.
- RBAC/SSO integration.
- Audit logs
6. Test in a Real Environment
Run a proof-of-concept (POC) or pilot:
- Monitor a subset of your infrastructure.
- Simulate outages or high-load scenarios.
- Measure how quickly your team can detect and respond.
7. Look for Community & Ecosystem
- A vibrant open-source community or ecosystem can mean faster updates, plugins, and community support.
Infrastructure Monitoring Best Practices
- Adopt Managed, Scalable Monitoring – Use a managed service to handle scale, performance, and retention without the overhead of managing infrastructure yourself.
- Unify Logs and Metrics – Correlate multiple telemetry sources to speed up root cause analysis. Avoid silos by using a single platform to see the “big picture.”
- Monitor Kubernetes Holistically –Track not only pods and nodes but also the control plane, applications, and containerized services with centralized dashboards.
- Standardize Data Collection – Ingest telemetry consistently to ensure completeness and reduce complexity.
- Use Pre-Built Dashboards, Then Customize – Start with production-ready dashboards for common systems, then tailor them to your unique environment to save time and maintain relevance.
- Set Contextual Alerts – Go beyond thresholds by correlating metric alerts with logs and deployment events, and route them into your existing collaboration and incident-response tools.
- Retain and Roll Up Data Wisely – Maintain long-term visibility (e.g., 18 months) with intelligent rollups that preserve data integrity, so trends remain accurate.
- Drill Down Efficiently – Ensure workflows let you jump from high-level anomalies to detailed log views quickly, reducing mean-time-to-resolution.
- Enforce Access and Compliance Controls – Implement RBAC, SSO, and audit trails, and align your monitoring with security and compliance frameworks (SOC-2, ISO-27001, HIPAA, etc.).
- Optimize Data to Reduce Noise and Cost – Filter out unneeded telemetry to focus on what matters, improving performance and cost efficiency.
FAQs
What is application infrastructure?
The technology stack and services that support the deployment, operation, and performance of software applications. It includes physical or virtual servers, operating systems, databases, middleware, APIs, storage systems, network components, containers, orchestration tools like Kubernetes, and cloud services.
What are the main challenges in infrastructure monitoring?
The dynamic and distributed nature of today’s environments impedes visibility, making it challenging to detect performance issues in real time, manage a high volume of metrics and logs, and correlate infrastructure issues with application performance.
What features should be considered when choosing an infrastructure monitoring tool?
Real-time data collection, customizable dashboards, automated alerting with anomaly detection, support for modern technologies (e.g., containers, Kubernetes, cloud platforms), ease of integration, full stack visibility, historical data retention, and root cause analysis capabilities.
What is the difference between application monitoring and infrastructure monitoring?
Application monitoring focuses on the performance and behavior of the software itself. It examines response times, error rates, user interactions, and code-level diagnostics. This helps developers and SREs ensure the application is working as expected from the user’s perspective. Infrastructure monitoring tracks the underlying systems that run the application, such as CPU usage, memory, disk I/O, and network health.


