
Implementing Observability for Kubernetes
March 23, 2020

In today’s era of microservices, containers, and containerized applications, software architecture is more complex. Kubernetes is king in this environment, orchestrating an army of Docker containers in more distributed environments. As that architecture meets demand for high availability, reliability, security, and auto-scaling during peak time, the scale of these operations requires robust management of the three pillars of observability—logs, metrics, and traces—to debug and maintain systems. Thus, Kubernetes observability is now a top priority for DevOps teams.
The scale requires the execution of many operations to ensure that all services are always accessible for end users. The good news is that, when there are issues, these operational activities provide information to help developers and IT staff find the root causes of problems and fix them before their customers notice.
The Three Pillars in Kubernetes Observability
The “three pillars of observability” are logs, metrics, and traces. When combined, they provide sufficient insights to monitor software at any scale. Let’s look at how to take advantage of these three pillars to make systems more observable, especially when working in the Kubernetes environment.
Logs
Logs represent discrete events which, in most cases, describe what’s happening with your service. The payload is an actual message emitted from your system along with a metadata section containing a timestamp, labels, and tracking identifiers. The following is a sample log message:
time=”2019-12-23T01:27:38-04:00″ level=debug msg=”Application starting” environment=dev
Log messages represent data in a structured textual form. Most programming languages and frameworks support logging out of the box. However, creating log messages often requires a large volume to store logs, so you should carefully consider your storage strategy as your amount of data grows.
In Kubernetes, every container writes its logs to standard output which can be aggregated by a centralized logging solution for future analysis.
Metrics
Metrics are numeric representations of data measured over intervals of time. They are essential for understanding system health and for gaining insights using telemetry signals. The following is an example of a metric:
http_requests_total=100
Metrics are usually stored in time series data stores like Prometheus. Metrics are optimized for storage, compression, and processing. It’s easier to retrieve and query them than it is to retrieve and query logs. This makes metrics a perfect fit for both alerting and building dynamic dashboards which show the system’s real-time or historical data.
The example below uses Prometheus query language to read the total number of HTTP requests for service hello running in dev environment:
http_requests_total{service=”hello”, environment=”dev”}
Kubernetes generates events out of the box when, for example, a PersistentVolume can’t be created or there aren’t enough resources for your application. Any other application can use the Kubernetes API to generate custom events that indicate changes in the application’s state.

Traces
Modern systems are implemented as interconnected complex and distributed microservices. Understanding request flows and system communications is a huge technical challenge, mostly because all systems in a chain need to be modified to propagate tracing information. Distributed tracing is a new approach to increasing observability and understanding performance bottlenecks. A trace is a representation of consecutive events which reflect an end-to-end request path in a distributed system.
When you have a good understanding of an entire request flow, it’s possible to troubleshoot most performance bottlenecks or analyze dependencies between different services.
Unfortunately, Kubernetes does not provide native tracing capability. However, there are multiple technologies out there that perform this function. See the CNCF’s Cloud-Native Tracing Landscape trail map for more details.
5 Open Source Tools for Implementing Kubernetes Observability
Observability in Kubernetes can be implemented by using the five different open-source technologies described below.
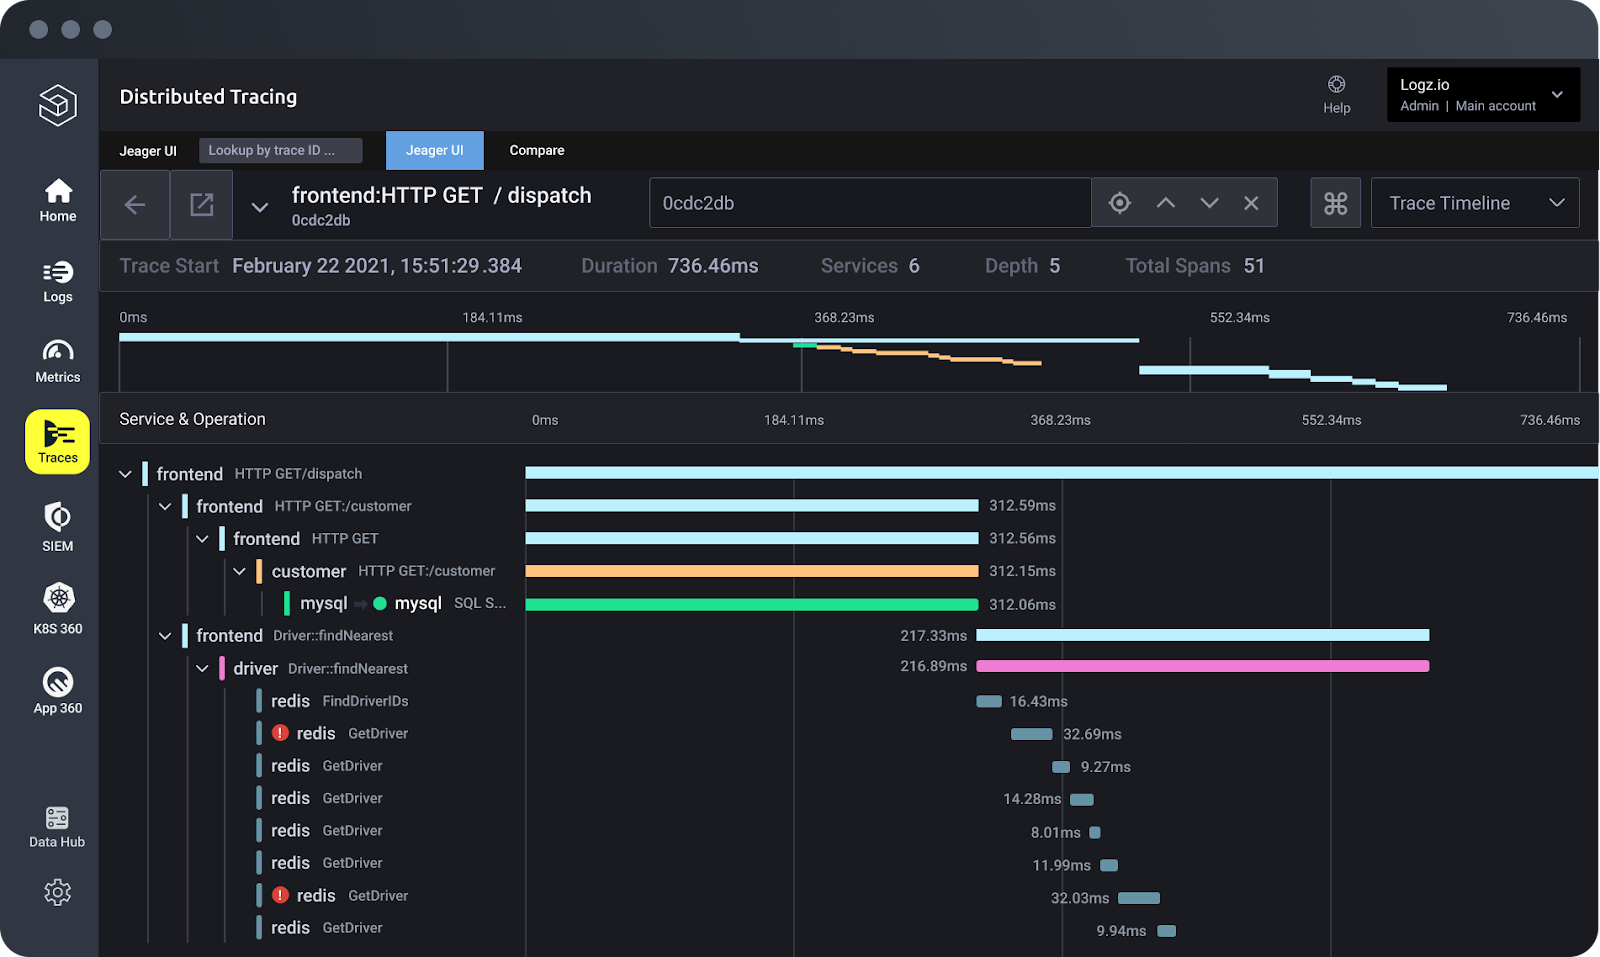
1. Jaeger—Distributed Systems Tracing with Kubernetes
Jaeger is an open-source distributed tracing system developed by Uber. According to Jaeger’s documentation, the tool is designed to monitor and troubleshoot distributed microservices, mostly focusing on:
- Distributed context propagation
- Distributed transaction monitoring
- Root cause analysis
- Service dependency analysis
- Performance/latency optimization
Your application needs to be instrumented before it can send tracing information. Jaeger provides client libraries for most programming languages, including Java, Go, Node.js, and Python.
The screenshot below shows a detailed request timeline view:

Jaeger can be deployed in Kubernetes using Jaeger Operator, which helps to deploy and manage Jaeger instances. If you are not familiar with operators, please take a look at the Kubernetes Operator documentation.
2. Fluentd—Collecting Kubernetes Logs
Fluentd is an open-source data collector for unified logging layers. It works nicely with Kubernetes running as DaemonSet. This combination ensures that all nodes run one copy of a pod.
Let’s take a look at an example of logging to ElasticSearch:
apiVersion: extensions/v1beta1
kind: DaemonSet
metadata:
name: fluentd
namespace: kube-system
…
spec:
…
spec:
containers:
– name: fluentd
image: quay.io/fluent/fluentd-kubernetes-daemonset
env:
– name: FLUENT_ELASTICSEARCH_HOST
value: “elasticsearch-logging”
– name: FLUENT_ELASTICSEARCH_PORT
value: “9200”
– name: FLUENT_ELASTICSEARCH_SSL_VERIFY
value: “true”
– name: FLUENT_ELASTICSEARCH_SSL_VERSION
value: “TLSv1_2”
…
The example above shows a DaemonSet manifest which deploys a Fluentd agent using the container image fluentd-kubernetes-daemonset on every Kubernetes node with a configured export to an Elasticsearch instance via TLS 1.2.
Fluentd supports multiple data output plugins for exporting logs to third party applications like ElasticSearch or Stackdriver. If your application running in Kubernetes streams logs to standard output (stdout), the Fluentd agent will make sure everything is properly distributed to a centralized logging solution. Later in this article, we’ll look at analyzing this data with ELK.
If you are interested in a hands-on example of Kubernetes logging with Fluentd, take a look at this article.
3. Prometheus—Automating Collection and Storage of Observability Data
Prometheus is a cloud native time series data store with built-in rich query language for metrics. It can be run in Kubernetes using a Kubernetes Operator or in a stand-alone mode.
The picture below shows the high-level architecture of Prometheus and its external components:

Prometheus uses exporters to allow third party data to be brought into its data store. There are a number of ready-to-use exporters maintained as part of the official Prometheus GitHub organization, including the Elasticsearch stats exporter for Prometheus, the Exporter for MySQL server metrics, and the Kafka exporter for Prometheus.
Usually, Prometheus scrapes specific metrics from an HTTP endpoint in order to read text-based metrics from it. However, in some cases, you will need to monitor components which cannot be scraped. Pushgateway allows you to push time series directly into a Prometheus data store.
Collecting data with Prometheus opens up many possibilities for increasing the observability of your infrastructure and of the containers running in Kubernetes. For instance, you can get a picture of your current capacity by measuring the number of requests handled by your service compared to the available connection pool in your web server.
4. Grafana—Visualizing Observability Data
Raw metrics are not the best for the visualization of observability data, since they often consist of time series, text-based data with thousands of events. This information is not readable by human beings.
Grafana, an observability platform which can be easily deployed in Kubernetes, helps you to overcome this problem by processing raw metrics. According to the Grafana documentation, this tool “allows you to query, visualize, alert on, and understand your metrics no matter where they are stored.” It does this through official and community-built dashboards which can be downloaded and imported into your Grafana instance. Grafana supports the querying of Prometheus metrics. The example below shows queries for Prometheus data itself:

Which Kubernetes Metrics Should I Monitor?
Even though there are a number of ready-to-use dashboards for Kubernetes-specific metrics, it’s not obvious which of these metrics you should actually pay attention to. In a production Kubernetes environment, the following metrics should be visible in your dashboard:
- Resource utilization saturation—the containers’ resource consumption and allocation.
- The number of failing pods and errors within a specific namespace.
- Kubernetes resource capacity—the total number of nodes, CPU cores, and memory available.
Most of the metrics above can be exported using node_exporter and cAdvisor.
In most cases, the Cluster Monitoring for Kubernetes dashboard provides enough insights to monitor nodes and workloads.

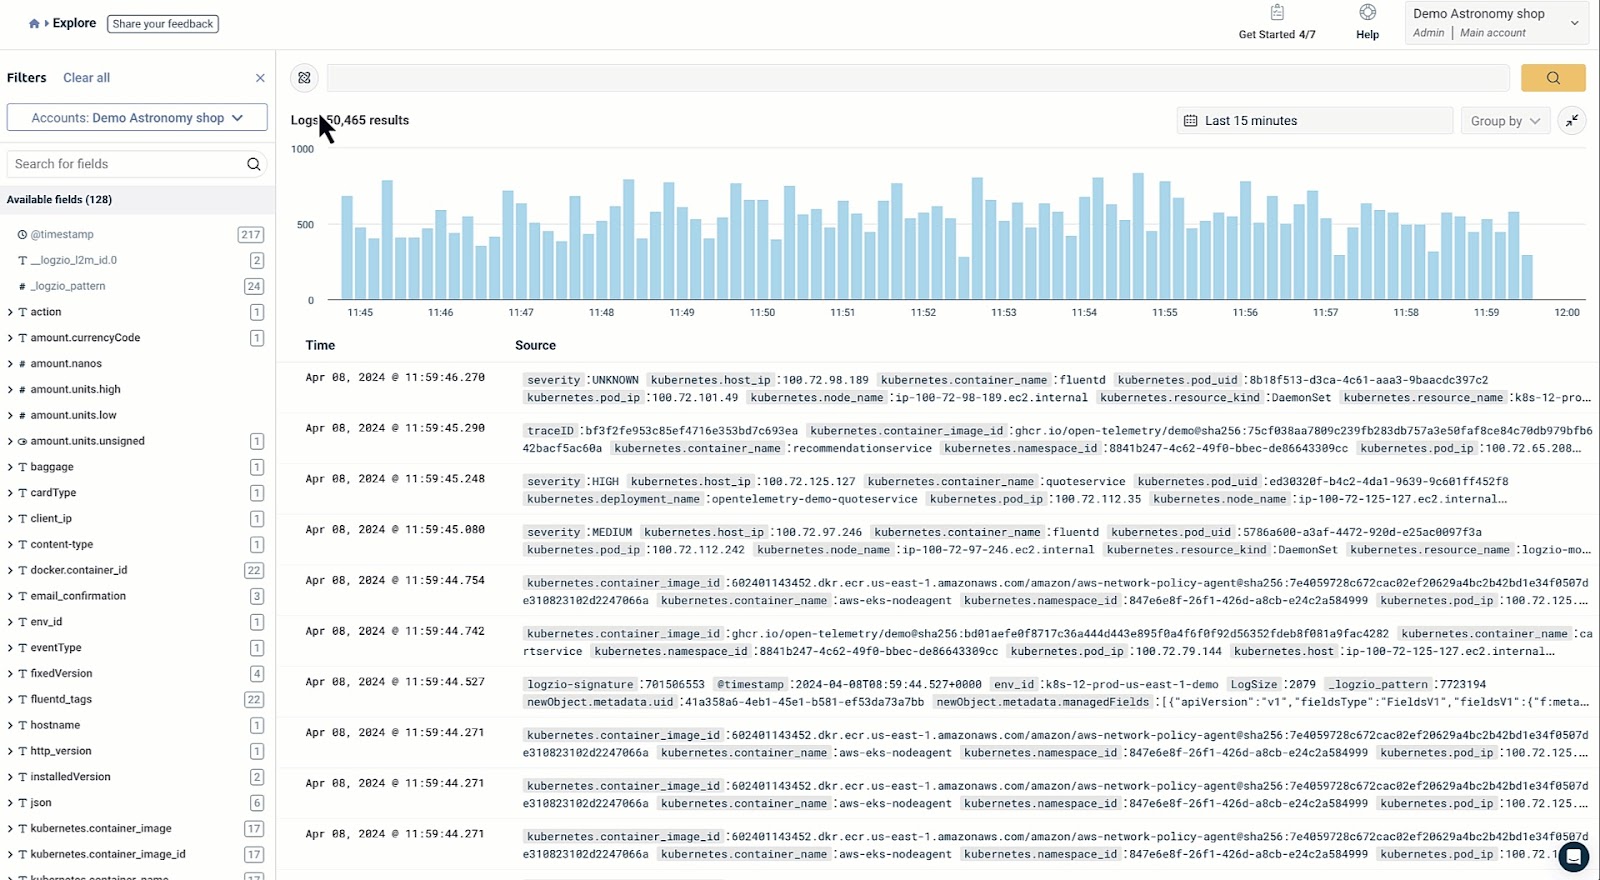
5. OpenSearch—Analyzing Kubernetes Logs
OpenSearch is a community-driven, Apache 2.0-licensed open-source search and analytics suite that makes it easy to ingest, search, visualize, and analyze data. It is the open source successor to ELK Stack and started as a fork from Elasticsearch and Kibana.
OpenSearch works nicely in Kubernetes, but is even more streamlined by Logz.io. Using the Logz.io Open 360™ platform, your teams will get more Kubernetes analytics and our tools and features than from OpenSearch alone.
- Alerting—Identifying changes in your data that are interesting to you.
- Monitoring—Keeping a pulse on the performance of OpenSearch
- Security—Integrating with a number of industry standard identity management systems.
The Role of OpenTelemetry in Kubernetes Observability
An additional open source tool in the arsenal of practitioners trying to get a foothold in Kubernetes is OpenTelemetry. Informally called OTEL or OTel, OpenTelemetry is an observability framework – software and tools that assist in generating and capturing telemetry data from cloud-native software in a uniform and vendor-agnostic manner.
OpenTelemetry aims to address the full range of observability signals across traces, metrics and logs. OpenTelemetry is now expanding to support Continuous Profiling as a fourth signal.
OpenTelemetry offers several components, most notably:
- APIs and SDKs per programming language for generating and emitting telemetry
- Collector component to receive, process and export telemetry data
- OTLP protocol for transmitting telemetry data
Logz.io’s Telemetry Collector, based on an open source distro of OpenTelemetry Collector, provides an out-of-the-box configuration for monitoring your Kubernetes workloads, whether managed or self-hosted Kubernetes. You can learn more about that in our advanced demo portion of our guide on how to run OpenTelemetry Demo with Logz.io.
Conclusion
Implement Kubernetes Observability with Logz.io’s Open 360
Because of the scale of modern infrastructure and the dynamic nature of Kubernetes, observability — understanding the characteristics and performance of your application — has become increasingly important.
The three pillars of observability—metrics, logging, and tracing—will not only help you increase observability in your Kubernetes environment, they will also provide you with insights into your underlying infrastructure, regardless of the technology stack you currently use. Using discrete open source software can help you get started, but a unified solution to support those tools can help you reach observability goals more effectively.
With Logz.io Open 360, built on the above best of breed open source observability stack, you can gain an even deeper view of your Kubernetes environment. Part of the platform is Kubernetes 360, where you’ll get a single view into application health and debug issues faster with automatic data correlation and detailed microservices topology mapping.
You’ll connect the dots across different signals to troubleshoot faster than ever, and understand how changes in your environment — such as new deployments and configurations — impact all your services. If you’re in need of a managed Kubernetes observability service, Kubernetes 360 is something you need to experience.
Want to see more? Sign up for a free trial of Logz.io Open 360 today and see how you can transform your Kubernetes observability in minutes.

You Might Also Like

Observability Into Your Containerized Workloads with AWS and Logz.io

