DevOps and SRE Metrics: R.E.D., U.S.E., and the “Four Golden Signals”
May 29, 2024

In the fast-paced realm of DevOps and Site Reliability Engineering (SRE), success starts with effective monitoring. Understanding the fundamental metrics is crucial for identifying and mitigating issues proactively.
In this article, we’ll delve into the leading metrics frameworks — R.E.D., U.S.E., and the “Four Golden Signals” — which will provide you with a solid foundation to enhance your monitoring practices.
R.E.D. Metrics: Rate, Errors, and Duration
The R.E.D. metrics framework focuses on three critical aspects: Request rate, Error rate, and Duration (latency). These metrics provide a comprehensive view of your application’s health.
- Request Rate: Measure the frequency of requests or events within your system. Monitoring the rate helps understand workload and traffic patterns, with unexpected spikes or drops serving as early indicators of issues or anomalies.
- Error Rate: Keep an eye on error rates to identify and address issues impacting the user experience. Tracking errors helps quickly detect and resolve problems, ensuring a seamless user experience and minimizing disruptions.
- Duration: Also known as latency, this metric measures how long it takes for a request to be processed. Monitoring duration helps identify performance bottlenecks and optimize critical components, enhancing overall system responsiveness.
Implementing R.E.D. metrics offers a holistic view of system health on the application level, enabling the detection and response to issues before they escalate. These metrics are typically monitored for each service (in a microservices architecture), and even individual operations or endpoints of the service, to support drilling down during root-cause analysis.
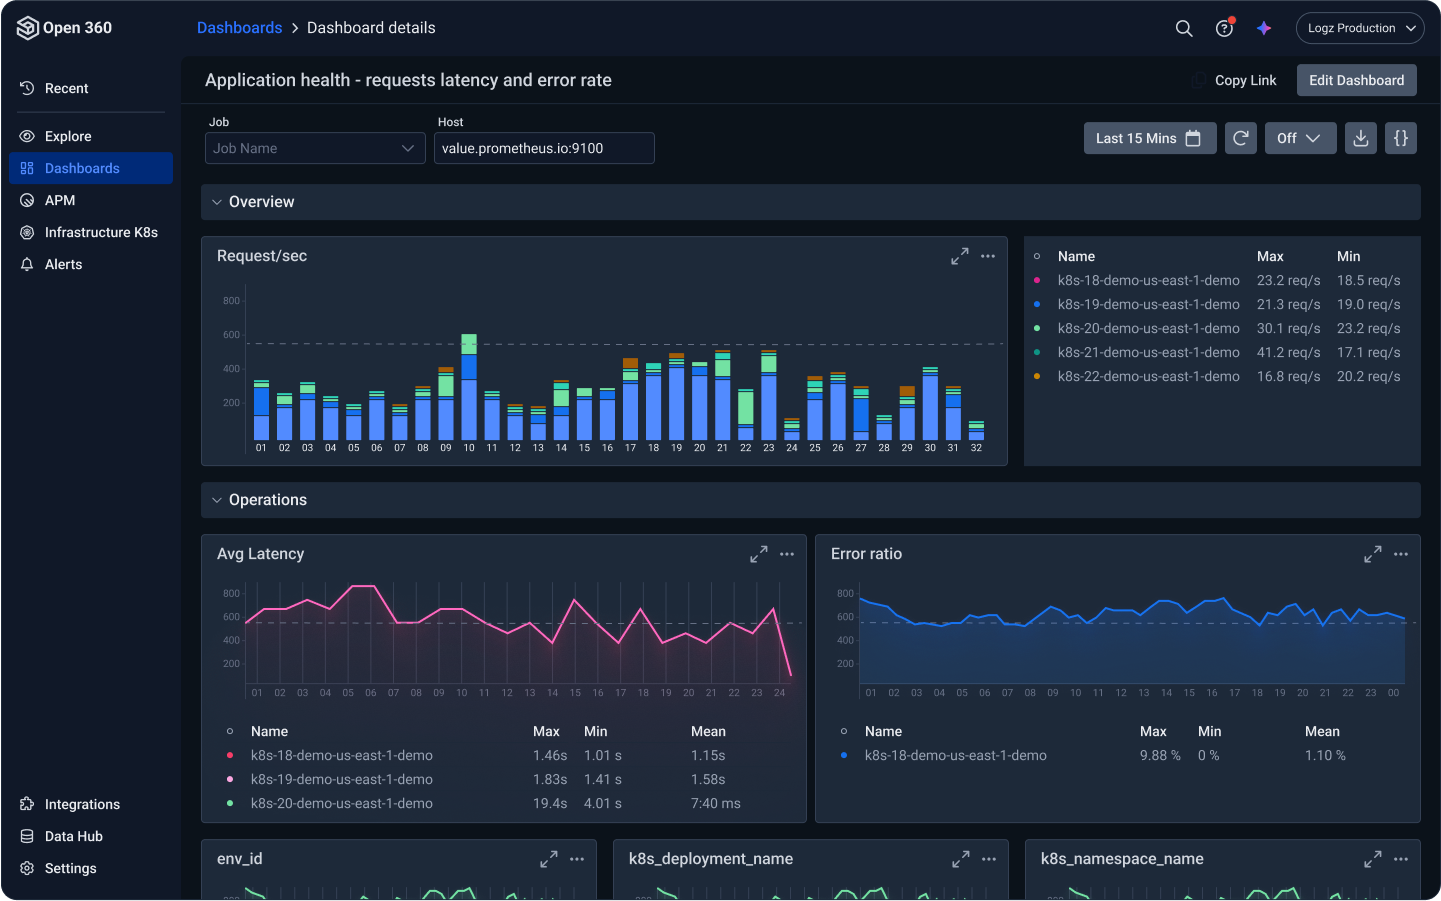
In the example below, taken from Logz.io’s App 360, we can see the R.E.D. metrics for the frontend microservice and its individual operations, plotted over time. In this case, we can also see the line graph of the HTTP status code, which gives another view of the errors (namely 300’s and 500’s codes versus the overall requests). Plotting different views can help the root cause analysis.

U.S.E. Metrics: Utilization, Saturation, and Errors
The U.S.E. method is another valuable framework focusing on three core metrics: Utilization, Saturation, and Errors, providing insights into infrastructure resource usage and system performance.
- Utilization: Measure the percentage of a resource being used. Monitoring utilization helps identify resource bottlenecks and optimize infrastructure, ensuring efficient resource usage.
- Saturation: This metric measures the degree to which a resource is busy. Identifying points of saturation helps proactively address capacity issues and maintain optimal performance.
- Errors: This metric helps to track errors. Monitoring error rates helps detect and address issues affecting resource availability and performance.
Combining R.E.D. and U.S.E. metrics provides a comprehensive monitoring strategy addressing both application-specific and infrastructure-related aspects of system performance, and is commonly accepted in the DevOps domain.
In the example below, taken from Logz.io Kubernetes 360, we can see the example of a specific Kubernetes pod with its CPU, memory and network utilization, as well as error information such as log error rate and container restarts.

The “Four Golden Signals” Metrics: Latency, Traffic, Errors, and Saturation
The “Four Golden Signals” represent a set of four key metrics offering a high-level overview of system health. Introduced by Google in the context of Site Reliability Engineering (SRE) practices, these signals are:
- Latency: Measures the time it takes to process a request. Monitoring latency ensures applications meet performance expectations and deliver a positive user experience.
- Traffic: Represents the volume of requests or transactions. Monitoring traffic helps understand the overall workload on the system, allowing anticipation and scaling of resources accordingly, in a similar fashion to the Request Rate metric of the R.E.D. system.
- Errors: Tracks the rate of errors occurring in the system. Monitoring errors is essential for identifying and resolving issues impacting reliability and user satisfaction.
- Saturation: Similar to the U.S.E. method, saturation measures the degree to which the system or resources are overloaded. Monitoring saturation allows optimization of resource allocation, preventing performance degradation.
The Four Golden Signals frameworks has gained popularity in the sre community You may treat the Four Golden Signals as an extension to the above U.S.E. method.
Endnote
Mastering these monitoring frameworks—R.E.D., U.S.E., and the “Four Golden Signals”—empowers practitioners to build robust, reliable, and high-performance systems. Incorporating these metrics into monitoring strategies ensures proactive issue identification and resolution, guaranteeing a seamless user experience and maintaining the overall health of applications. These frameworks are not mutually exclusive, and are complimentary in many senses.
On top of these monitoring foundations, the next level can be built, by defining the Service Level Objectives of your system, and ensuring proper metering of their respective Service Level Indicators to ensure the central flows and user journeys through your system work as expected.
More advanced layers can then be added to monitor essential SaaS metrics to support product-led growth, as well as FinOps metrics to better control the infrastructure cost.
You can try out Logz.io App 360 and Kubernetes 360 with a free trial.


