
Installing the ELK Stack on Windows
August 7, 2017
A while ago, I wrote down some instructions on how to install ELK on Windows. Truth be told, I was pretty surprised by how popular that blog post was, since I was doubtful about how popular an “ELK-on-Windows” stack was.
That piece was written using Elasticsearch 2.3.5, Logstash 2.3.4 and Kibana 4.5.4. A lot of water has passed under the bridge since then, with the birth of the “ELK Stack” and versions 5.x of the stack’s different components being released. But it was the recent release of Elasticsearch 5.5 and the new .msi installation option that pushed me to try out installing the stack on Windows again.
The setup of the Windows environment I’m using is the same — a Windows Server 2012 R2 instance on Amazon Web Services. Of course, Java remains a basic requirement for installing the stack, Java 8 to be more precise. If you’re not sure what version you’re using, use java -version in PowerShell.

Installing Elasticsearch
You can still install Elasticsearch on Windows using the .zip archive, but as mentioned above, for this tutorial we will be using the new .msi package and the supplied installation wizard.
So first, download the .msi package for Elasticsearch v5.5.0 at: https://artifacts.elastic.co/downloads/elasticsearch/elasticsearch-5.5.0.msi
Then, open the .msi package you just downloaded to launch the installation wizard (you can install the .msi via CLI as well).

The first step allows you to play around with directories for the installation and Elasticsearch data, logs and config files. In our case, we can just click Next to go with the default configurations and proceed.

In the second step you can decide how to install and start Elasticsearch – whether to install it as a service or whether to start it manually.
In our case, we will opt for the former and run with the default running settings, using the local Windows system account and starting the service once the installation is over and each time Windows is started.
Moving on, the third step displays some Elasticsearch configuration options.

We can define the cluster and node name, assign a role to the node (Data/master/Ingest), assign memory and configure network settings. As before, we will make do with the default settings.

The final step allows us to select which plugins to install (e.g. X-Pack or the Ingest GeoIP Processor). We will go for the slimmest option and hit the Install button to install Elasticsearch.
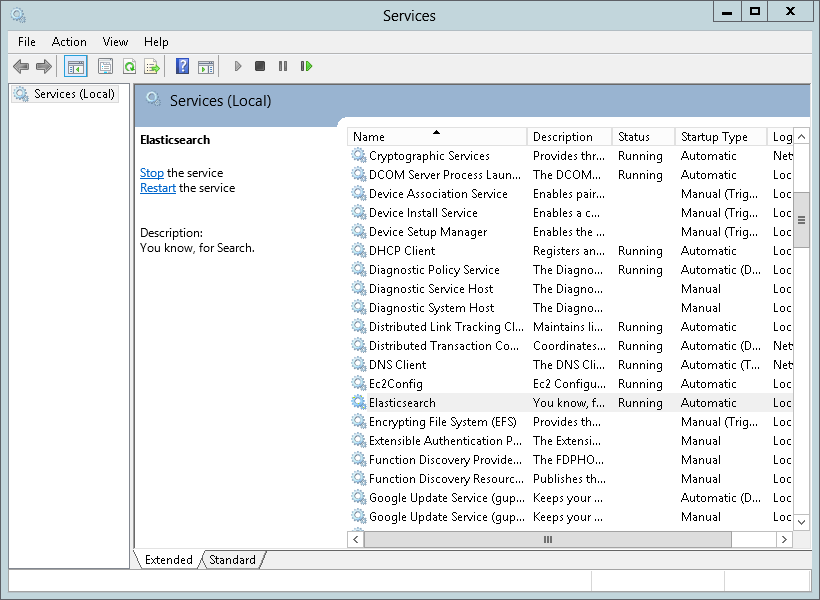
And voila! Elasticsearch is then installed as a service and started. You will see a nice success message at the end of the process.
If you open your browser at http://127.0.0.1:9200, you should see the following output:
{
 "name" : "WIN-I31HT4I8PDM",
 "cluster_name" : "elasticsearch",
 "cluster_uuid" : "B2K9AthnRDqCTTag7yAc2Q",
 "version" : {
 "number" : "5.5.0",
 "build_hash" : "260387d",
 "build_date" : "2017-06-30T23:16:05.735Z",
 "build_snapshot" : false,
 "lucene_version" : "6.6.0"
 },
 "tagline" : "You Know, for Search"
}
The service is displayed in the Services dialog:
Installing Kibana
Next up, let’s install Kibana.
You can download the KIbana 5.5 .zip archive from: https://artifacts.elastic.co/downloads/kibana/kibana-5.5.0-windows-x86.zip
Extract the .zip file into a folder of your choice (e.g. c:\Program Files (x86)\ELK), and for the sake of simplicity, rename the parent folder ‘kibana’ instead of the default ‘kibana-5.5-0-windows-x86’.
Open Windows PowerShell, cd into the folder and start Kibana as follows:
cd c:\Program Files (x86)\ELK\kibana
.\bin\kibana
If all proceeds as expected, the command output will display only GREEN info messages with the last message reporting:
[info][status][ui settings] Status changed from yellow to green - Ready
To verify, open Kibana in your browser at: http://127.0.0.1:5601.

As you will see, Kibana is running as expected but since we have not yet shipped any data, we have no defined index pattern.
We’ll take care of that now.
Installing Filebeat
The process for installing your log shippers is almost identical to the procedure described above for Kibana but also varies depending on what log shipper you want to use.
If you are looking to analyze Windows event logs for example, your next step would be to install and run Winlogbeat, a Windows-specific log shipper.
In this tutorial though, I’m going to describe how to install and run Filebeat as a Windows service.
Filebeat can be downloaded from this Downloads page: https://www.elastic.co/downloads/beats/filebeat
Once downloaded, extract the .zip file into your ELK folder and as before, rename the directory ‘filebeat’.
Then, in PowerShell, cd into the directory and use the command below to run Filebeat as a service:
cd c:\Program Files (x86)\ELK\filebeat
.\install-service-filebeat.ps1
The script might fail in case script execution is disabled. If this is the case, use the following command to set the execution policy for the session:
PowerShell.exe -ExecutionPolicy UnRestricted
-File .\install-service-filebeat.ps1
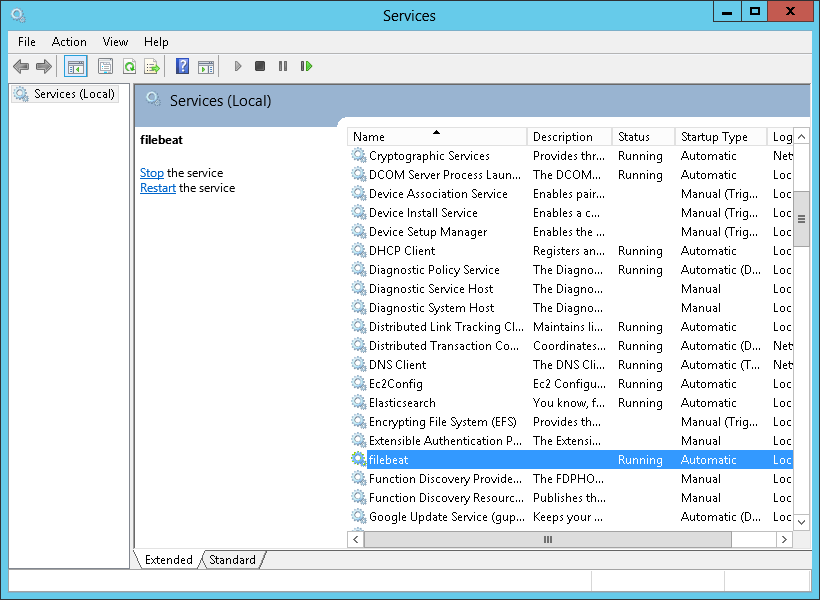
Filebeat is installed as a service, but is not yet running.
Before we run Filebeat, you will need to configure the ‘filebeat.yml’ configuration file located in the root directory of the Filebeat installation.
Change the supplied prospector settings to track Elasticsearch logs instead of Linux logs:
filebeat.prospectors:
- input_type: log
 - C:\ProgramData\Elastic\Elasticsearch\logs\*.log
We can leave the output settings as-is since they are correctly defined to send the data to our local Elasticsearch instance, and open the Services window to start the Filebeat service.
If you query Elasticsearch indices, you should see a Filebeat index created:

Back in Kibana, you can now define the filebeat-* index pattern:

Logs belonging to the Filebeat index will then appear in the Discover page and all that’s left to do is analyze away!

Endnotes
The new .msi package and supplied GUI for the installation process make installing Elasticsearch on Windows extremely simple.
More on the subject:
Executing the Kibana binary is one way to start Kibana, but you will most likely want to install Kibana as a service for more efficient handling and management. Also, if you’re interested in more advanced processing of the data, or aggregating logs from multiple data sources, you will most likely need to install Logstash. This adds a certain layer of complexity into the stack and it’s a shame both Kibana and Logstash lack a .msi installer.

You Might Also Like

What’s New at Logz.io – January 2026

