
Speeding up Security Investigations with Drilldown
May 16, 2019

At RSA this year, we introduced a series of new enhancements to Security Analytics – our new app for helping organizations combat security threats and meet compliance requirements. We are now happy to announce the official release of one of these features — Drilldown!More on the subject:
Multi-dashboard investigations
Dashboards are an extremely useful tool to use for security analytics. If properly constructed, dashboards can provide us with deep insight into events taking place in our environment, pointing us to suspicious behavior and helping us with the next step in our investigation.
Often enough, we will have a series of dashboards we use to monitor our environment. A common best practice is to have one primary dashboard that provides us with a general view of the system and a series of secondary dashboards that aid us in gaining more granular insight into a specific element.
But switching back and forth between these dashboards is not very user-friendly. Not only that, I might not even know that a secondary dashboard exists unless I actually created it. Wouldn’t it be cool if we could easily move from one dashboard to another to help us drill down into specific elements displayed in the dashboard?
Building interactivity into dashboards
This is where Drilldown comes into the picture — allowing Logz.io Security Analytics users to map specific log fields to target dashboards. This enables jumping from one Kibana dashboard to another, and makes dashboards more interactive and investigation simpler!
This is done on the Drilldown Settings page (Cogweel → Tools → Drilldown settings):
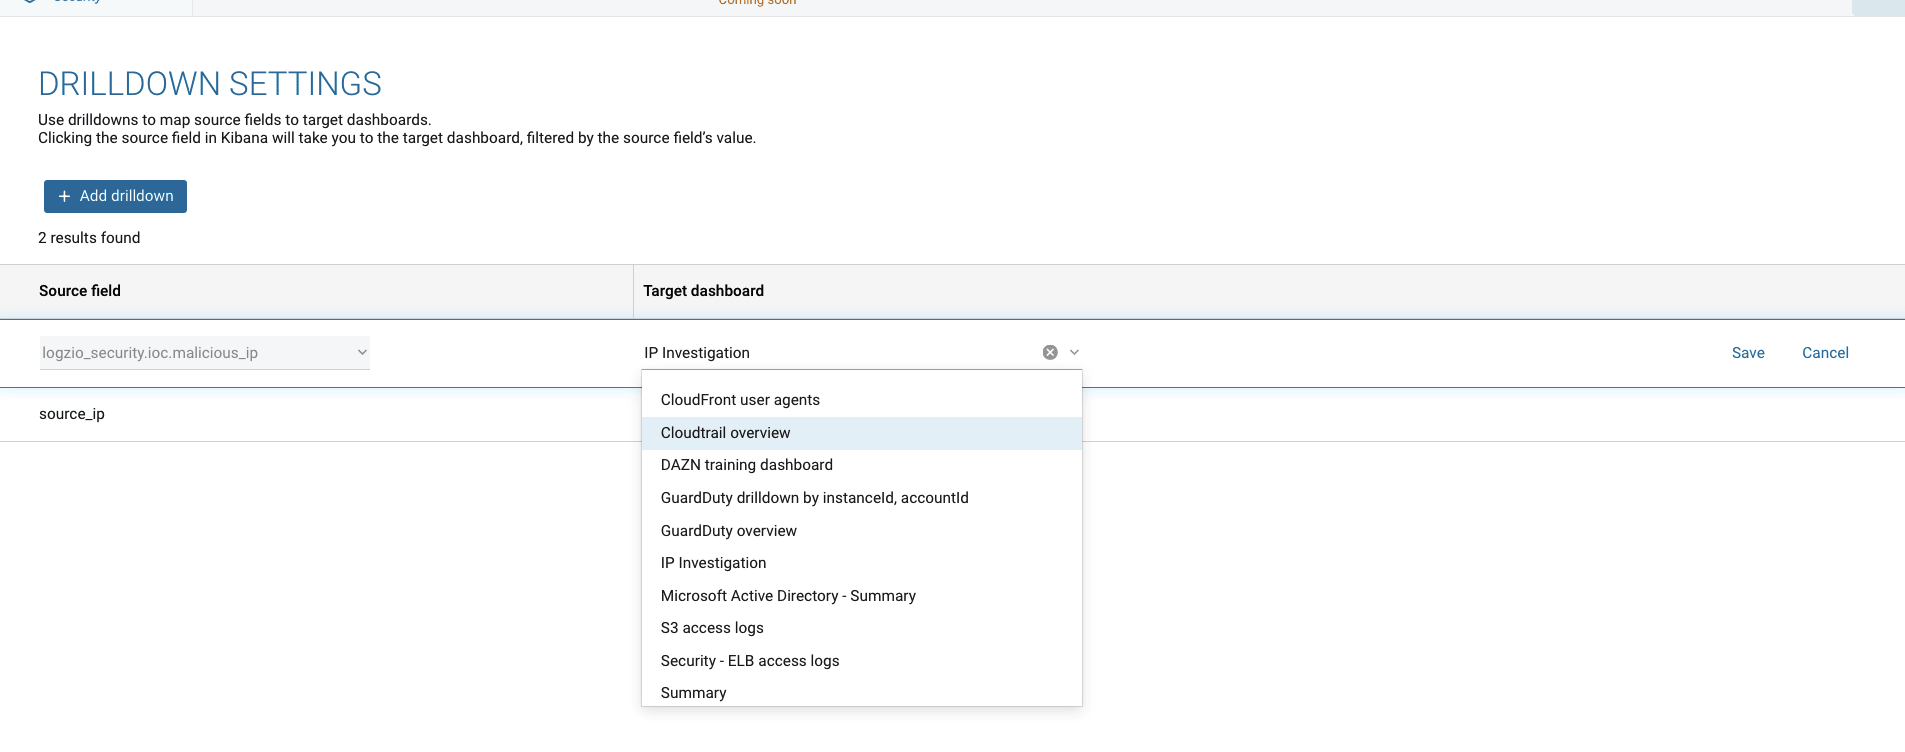
All you have to do is select the source field you want to map and the target dashboard you want it to link to.
Example – IP investigation
In the dashboard below, we’re monitoring our environment for potential threats. The dashboard is comprised of a series of visualizations, each depicting these threats in a different manner.

In the Threats by attacker visualization, we’re displaying a list of attacks per IP, and as you can see, the IPs are hyperlinked:

Clicking on an IP leads us to another dashboard that helps us dive deeper into the rabbit hole and investigate that specific IP:
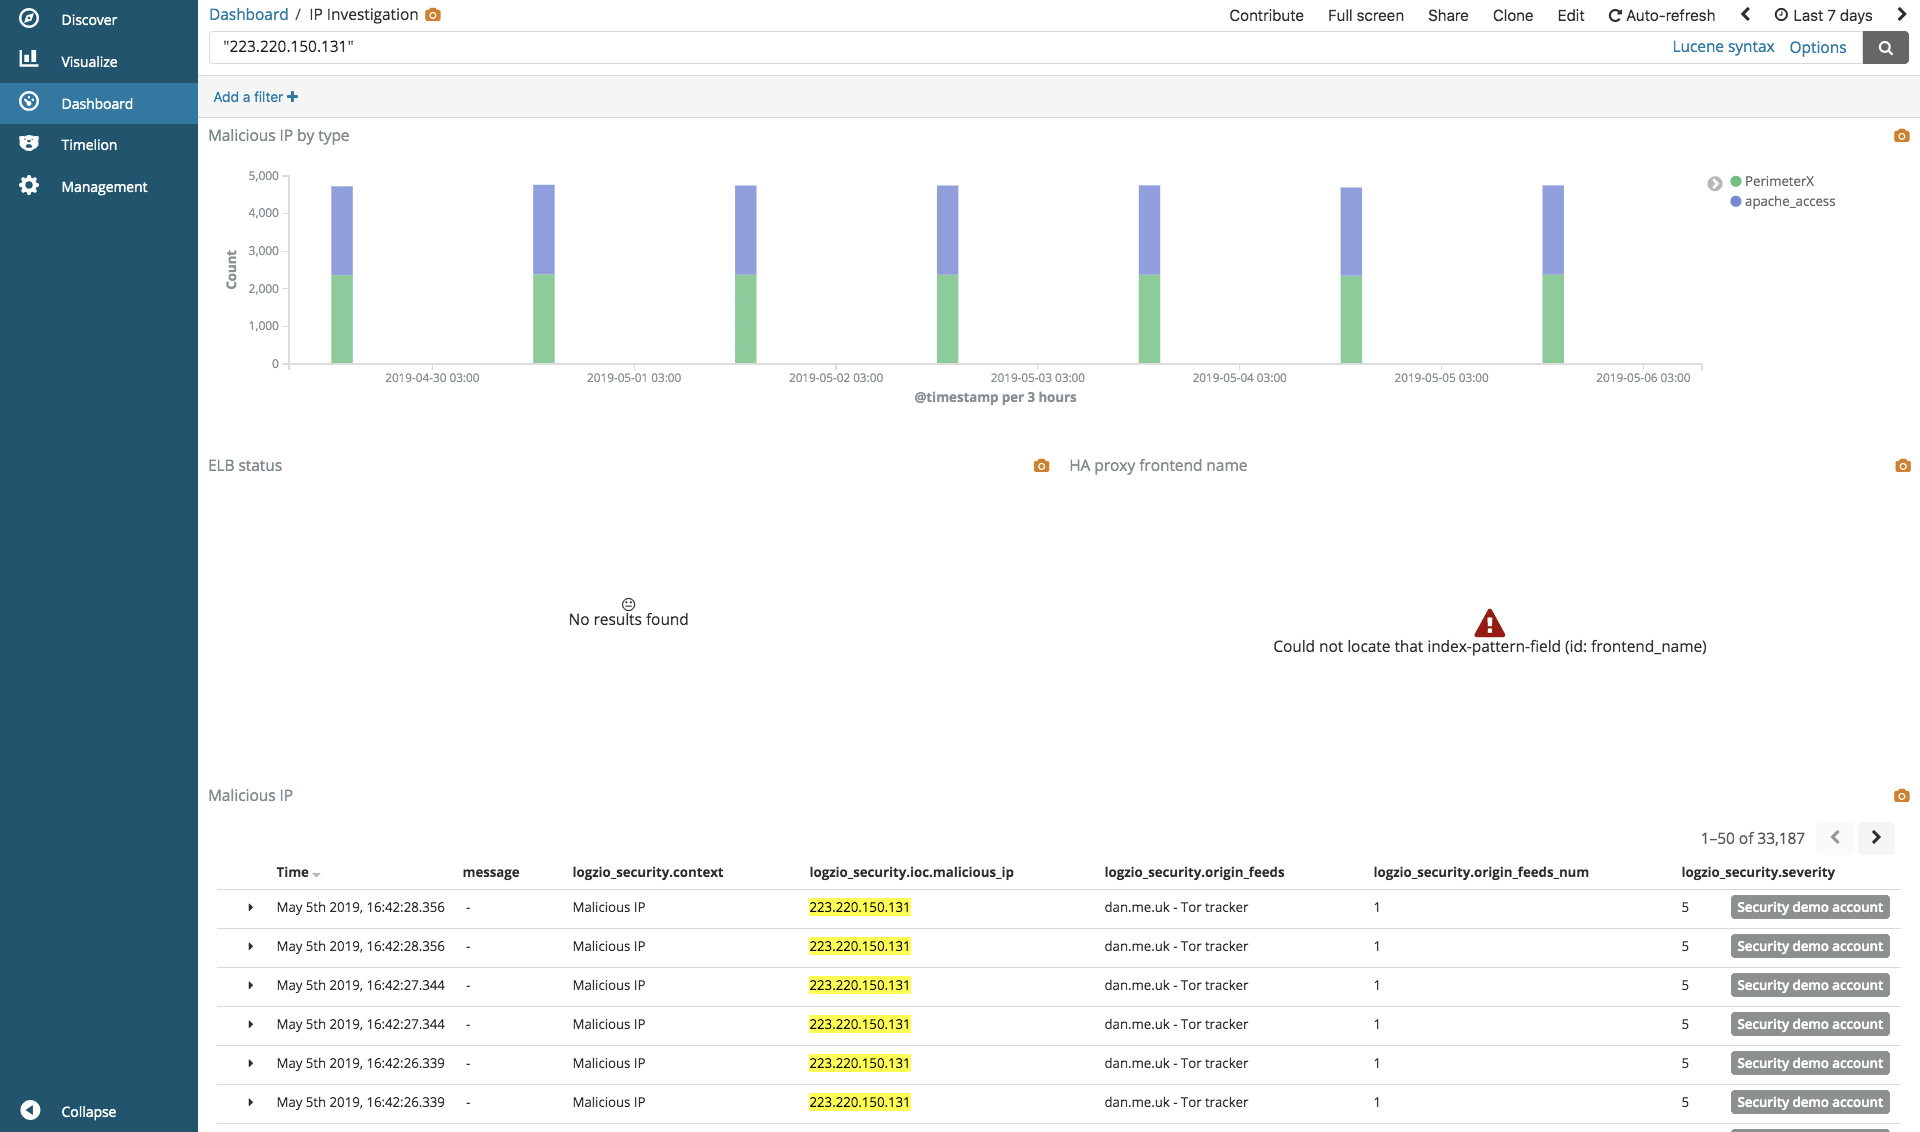
This linkage was achieved using Drilldown. We mapped the source_ip field to the IP Investigation dashboard.
Endnotes
The ability to jump from one dashboard to another is a hugely sought-after feature in Kibana and we are proud to provide our users with an easy and simple way to do this. Drilldown will make your dashboards more interactive, and your investigation workflows more simpler.
Drilldown is enabled for all our Security Analytics users and we will be rolling this out for Operations users in the near future. As always, we’d love to get your feedback. So if you have any comments or questions, feel free to reach out to info@logz.io.

You Might Also Like

A Guide on Log File Parsing Tools

