First Steps to Building the Ultimate Monitoring Dashboards in Logz.io
March 5, 2023

Cloud infrastructure and application monitoring dashboards are critical to gaining visibility into the health and performance of your system.
But what are the best metrics to monitor? What are the best types of visualizations to monitor them? How can you ensure your alerts are actionable?
We answered these questions on our webinar Build the Ultimate Cloud Monitoring Dashboard. We focused on how you can use Logz.io’s Open 360™ platform to get to where you want in your cloud infrastructure monitoring data visualization journey.
How to Collect Monitoring Data with Logz.io
There are different ways customers can collect data in Logz.io. We recently launched Telemetry Collector, a tool based on OpenTelemetry and Fluentd. This collects logs, metrics and traces in one installation and only takes a few minutes to do.
Additionally, customers can use open source offerings like Grafana and Prometheus that easily integrate with cloud architecture to collect data that can then be sent to Logz.io.
Another way is through cloud integrations that stream data from AWS, Microsoft Azure and Google Cloud Platform directly to Logz.io. Customers can also use libraries to send custom metrics directly from their code if they choose.
We recommend using Telemetry Collector if it’s supported, because it’s very easy to configure and install. The question then becomes: what’s the best way to set up your cloud monitoring dashboards?
What to Do Before Creating Dashboards
Making the ultimate monitoring dashboard doesn’t just happen with a snap of your fingers. It takes planning in advance. With that in mind, we recommend two specific actions to take before getting into building your dashboard.
The first step is to do research. It may sound trivial, but discovering more about the service for which you’re building the dashboard is an incredibly important component to building effective dashboards. If it’s an application, learn more about the kind of data and metrics the app is creating. It’ll be hard to build the dashboard without knowing that information.
The second step is to understand the data structure with which you’re going to work. Explore your metrics. What kind of data do they hold? What are their labels? For example, if you’re going to look at Kubernetes data, understand the structure of the specific metrics from Kubernetes so that you can effectively monitor it through your dashboard.
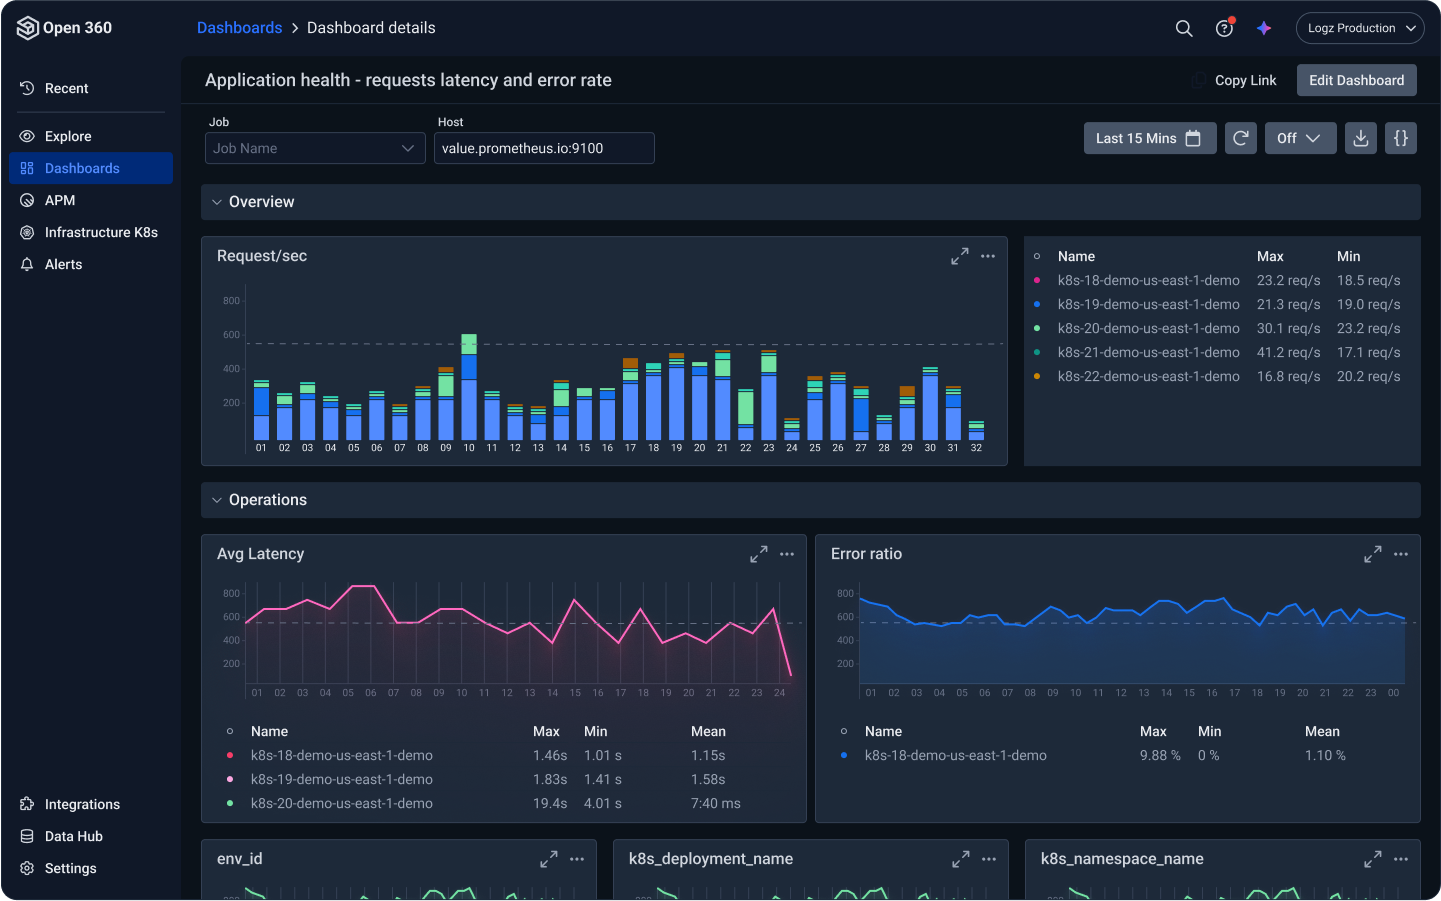
Here’s one additional tip for when you actually start making your dashboard: make sure your most urgent visualizations are represented at the top of your dashboard, so you need to decide what those should be. Whether you’re making the dashboards for yourself or your colleagues, you want to ensure you get a summary glance right at the top.
People tend to overcomplicate dashboards and forget about presenting the most important stats right away. Don’t let that happen.
To see in action how to create the best dashboards for infrastructure monitoring, and how Logz.io can help you, watch the full webinar replay above. To see more about what you can do with Logz.io’s full open source observability platform, sign up for a free trial today.


