Sysdig and ELK: A Match (Potentially) Made in Heaven
October 19, 2016

Sysdig is a powerful tool for Linux system and container monitoring. Capturing system activity directly from the kernel, Sysdig allows process tracing and analysis and includes both a CLI and UI for user interaction. As the folks at Sysdig themselves put it: “Think about sysdig as strace + tcpdump + htop + iftop + lsof + …awesome sauce.”
Of course, the challenge is how to extract insights from this rich data once it is captured. We’re talking about thousands of messages logged per minute from the various processes that are running. How does one successfully monitor and analyze all of this information?
Sysdig’s cloud solution includes various visualization and analysis features such as dashboards and alerts, but if you opt for the open source Sysdig, you’re going to need to tap into an external data aggregation and analysis tool.
In comes the ELK Stack (Elasticsearch, Logstash, and Kibana).
This post checks out the integration between Sysdig and ELK and details how to set up a local logging pipeline from Sysdig to Logstash to Elasticsearch and Kibana.
My setup: Ubuntu 14.04, Java SDK 1.7, Elasticsearch 2.4, Logstash 2.4, and Kibana 4.5.
Installing Sysdig
There are a number of ways to install Sysdig — either manually, automatically, or in a Docker container. In this case, I used the following automatic installation script:
$ curl -s https://s3.amazonaws.com/download.draios.com/stable/install-sysdig | sudo bash
To verify Sysdig was installed correctly, simply run it with:
$ sudo sysdig
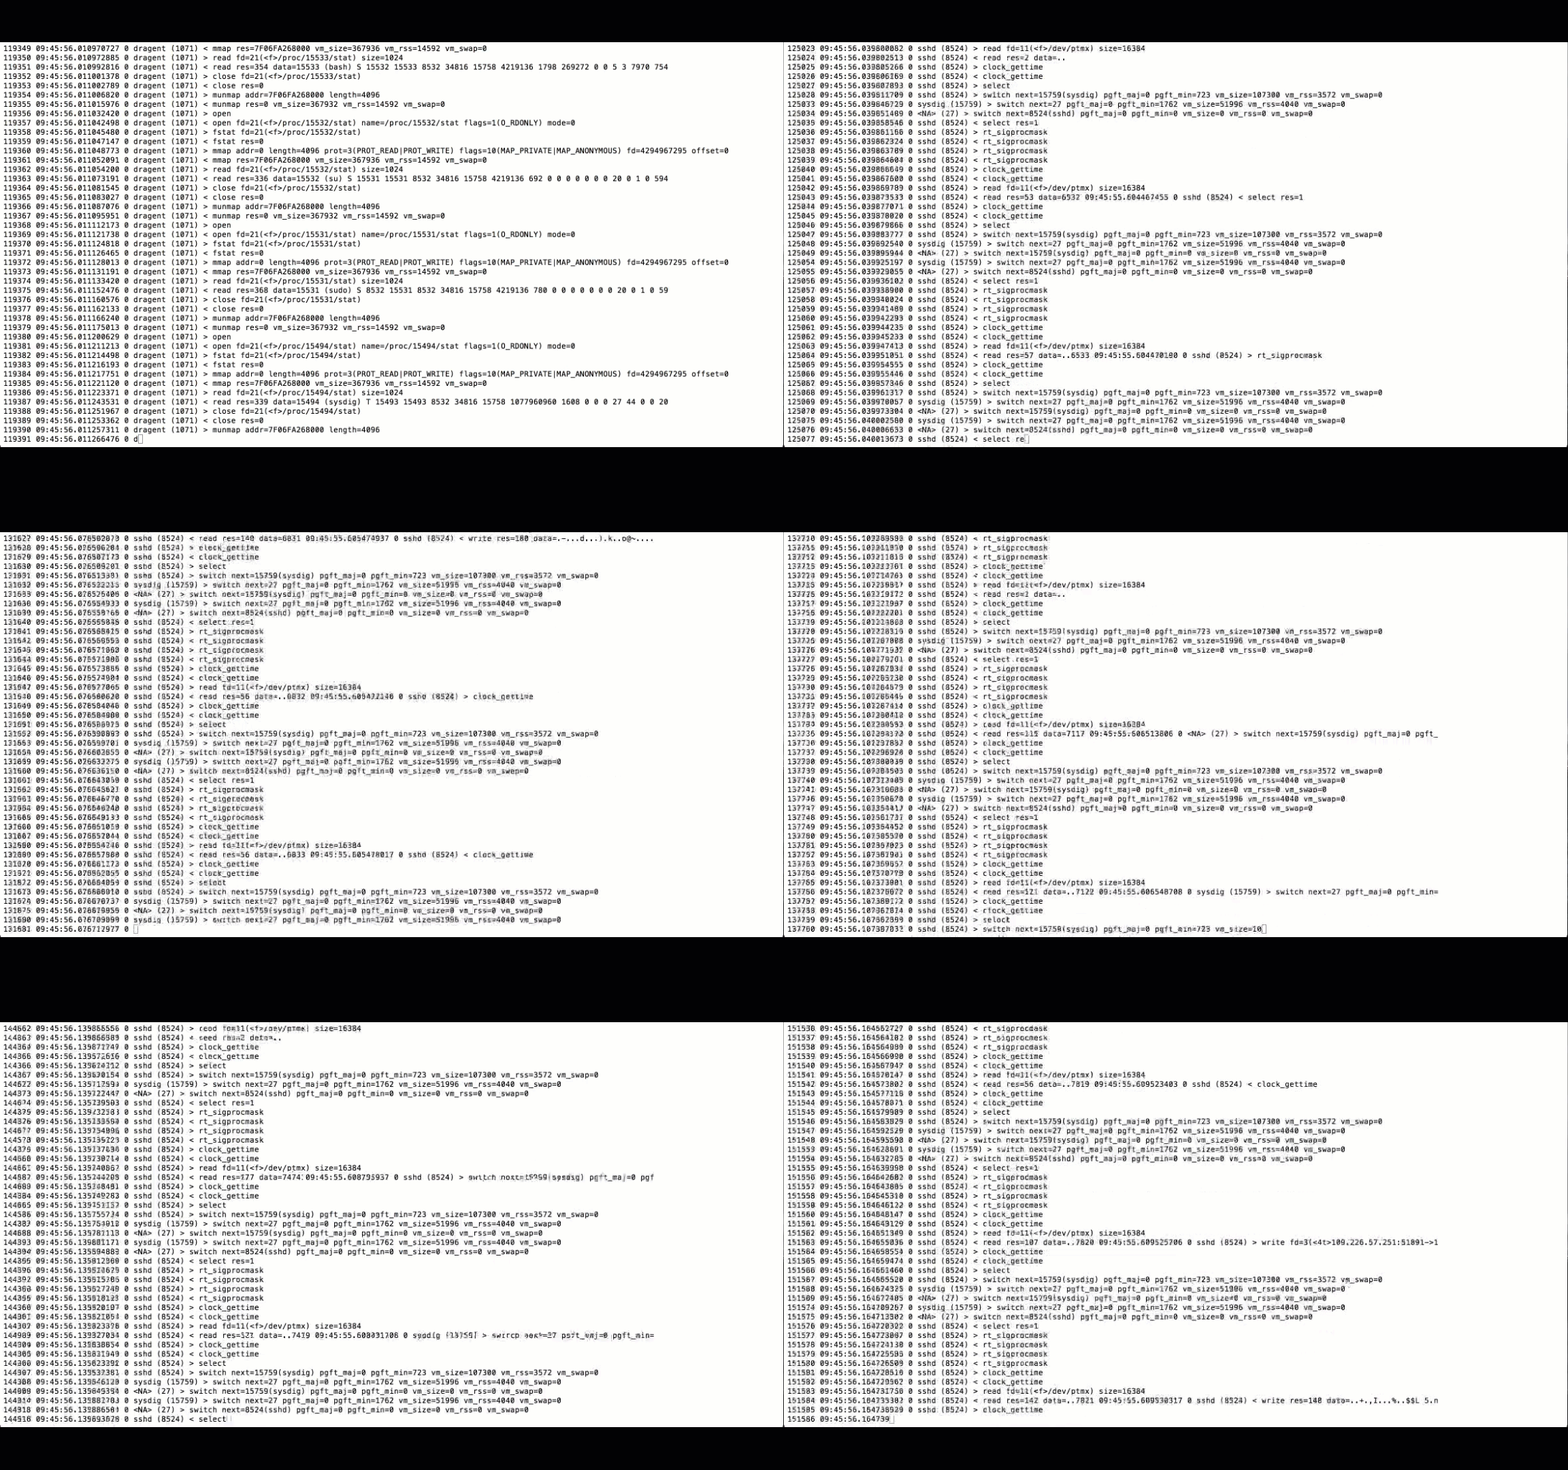
You should be seeing a live tail of all the messages being traced by Sysdig:
Configuring Logstash
The next step is to configure Logstash to pull the Sysdig output and forward it to Elasticsearch for indexing.
To do this, I’m first going to create a new ‘sysdig-logstash.conf’ file:
$ sudo vim /etc/logstash/sysdig-logstash.conf
Then, I’m going to use the following Logstash configuration:
input {
   stdin { }
}

filter {
      grok {
        match => {"message" => "^%{NUMBER:num:int} %{NUMBER:time:float} %{INT:cpu:int} %{NOTSPACE:procname} %{NOTSPACE:tid} (?[<>]) %{WORD:event} %{DATA:args}$"}
     }
   }

date {
   match => [ "time", "UNIX" ]
}

   if [args] {
      kv {
         source => "args"
         remove_field => "args"
      }
   }
}

output {
   #stdout { codec => rubydebug }
   elasticsearch {
      }
}
This configuration defines stdin as the input, applies a grok filter to the data, and sets a locally installed Elasticsearch instance as the output. Of course, if you’re using a remote deployment of Elasticsearch, you’ll want to add a “hosts” configuration line in the output section.
After I save the file, I will then enter the following commands to run Sysdig and Logstash with the configuration file above (before you run this command, verify the path to both the binary and configuration files):
$ cd /opt/logstash

$ sysdig -t a "not(proc.name = sysdig)" | bin/logstash -f /etc/logstash/sysdig-logstash.conf
You should see Logstash output with the following message:
Settings: Default pipeline workers: 1
Logstash startup completed
Analyzing and visualizing the data
Our next step is to begin analyzing the data in Kibana, ELK’s user interface.
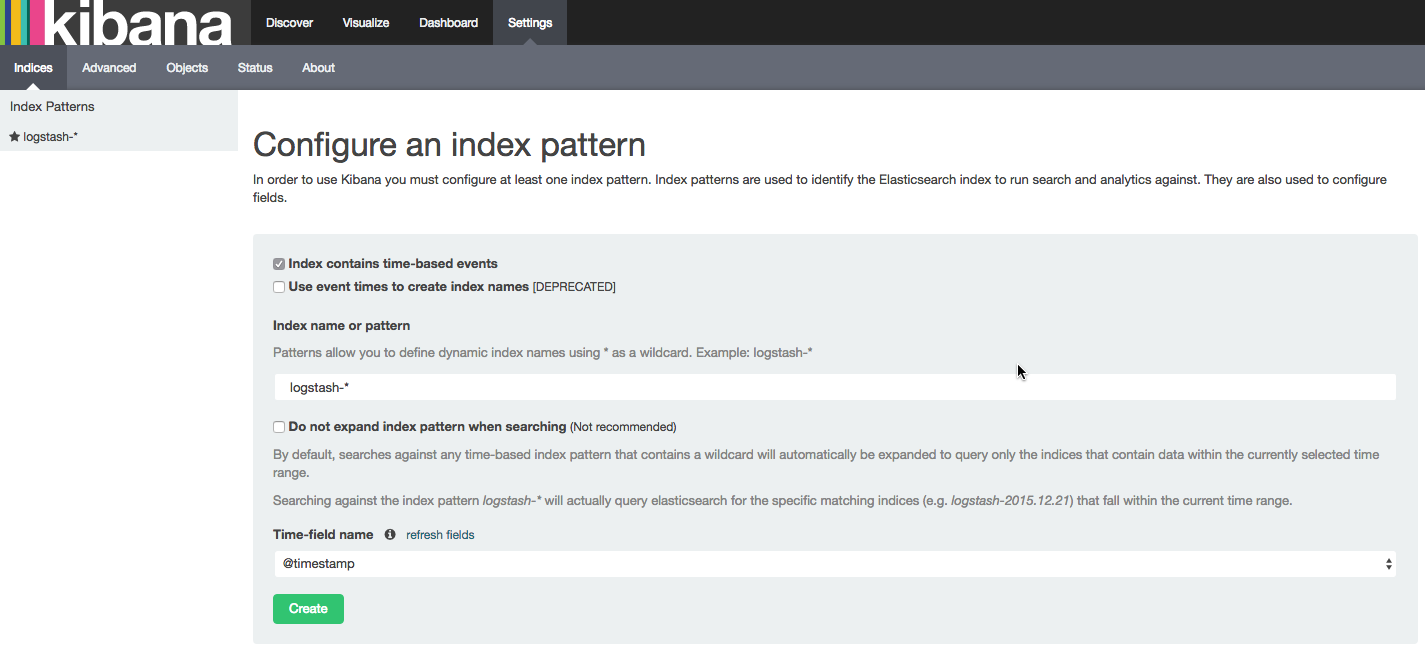
In a vanilla installation, and if this is the first time you are defining a logstash index, the Settings tab will be displayed, in which the logstash-* index should already be identified by Kibana:
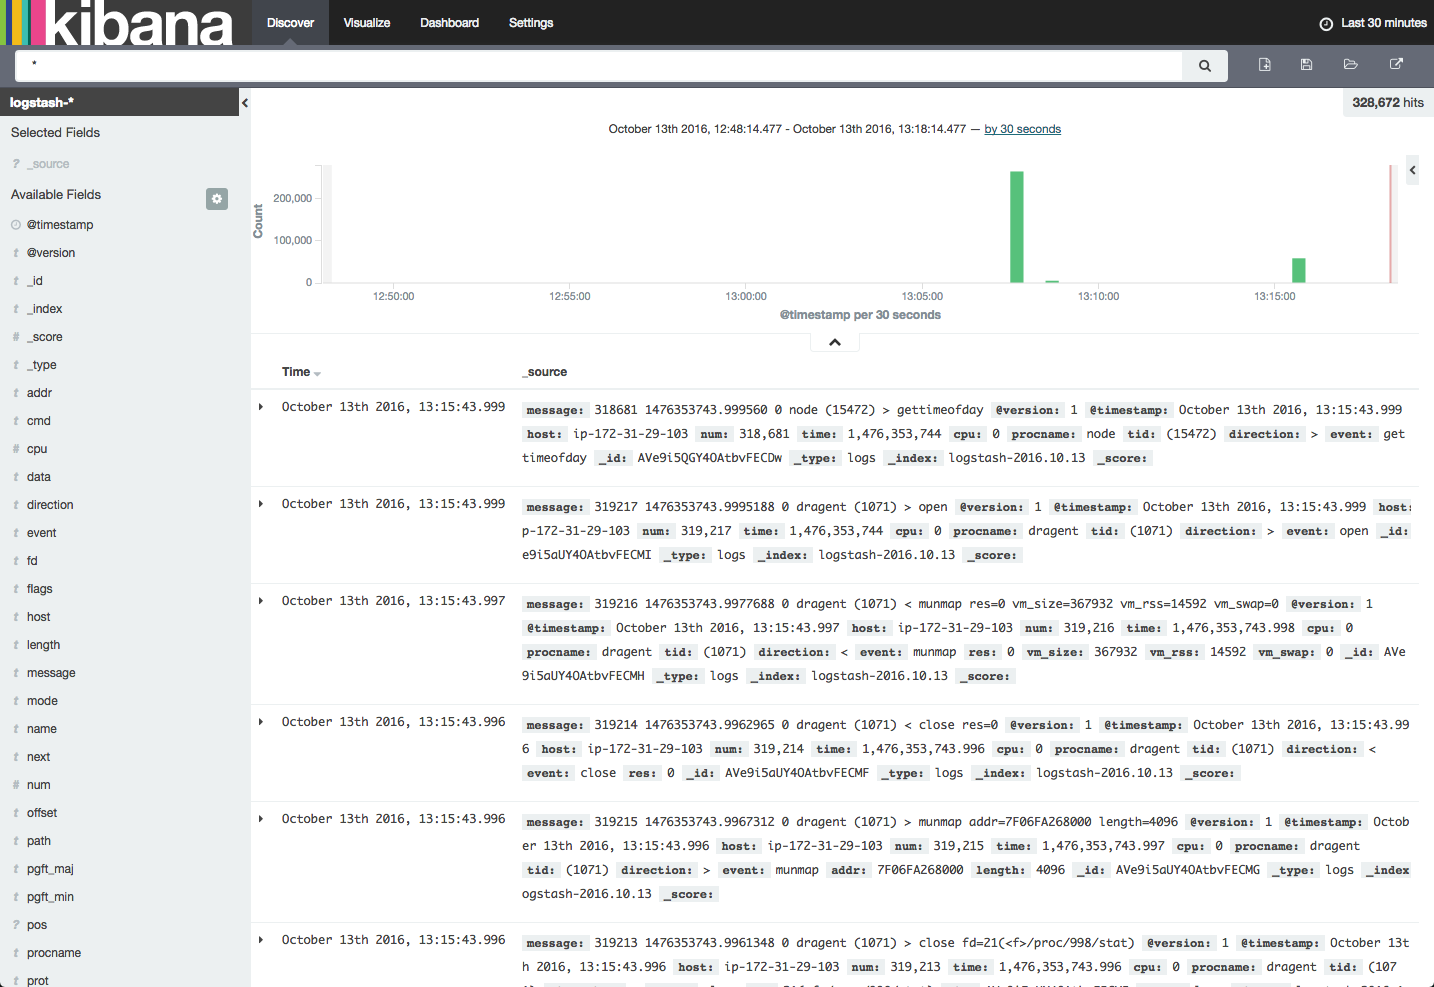
After creating the new index, and opening the Discover tab in Kibana — you should be seeing all the data traced by Sysdig and outputted to stdin:
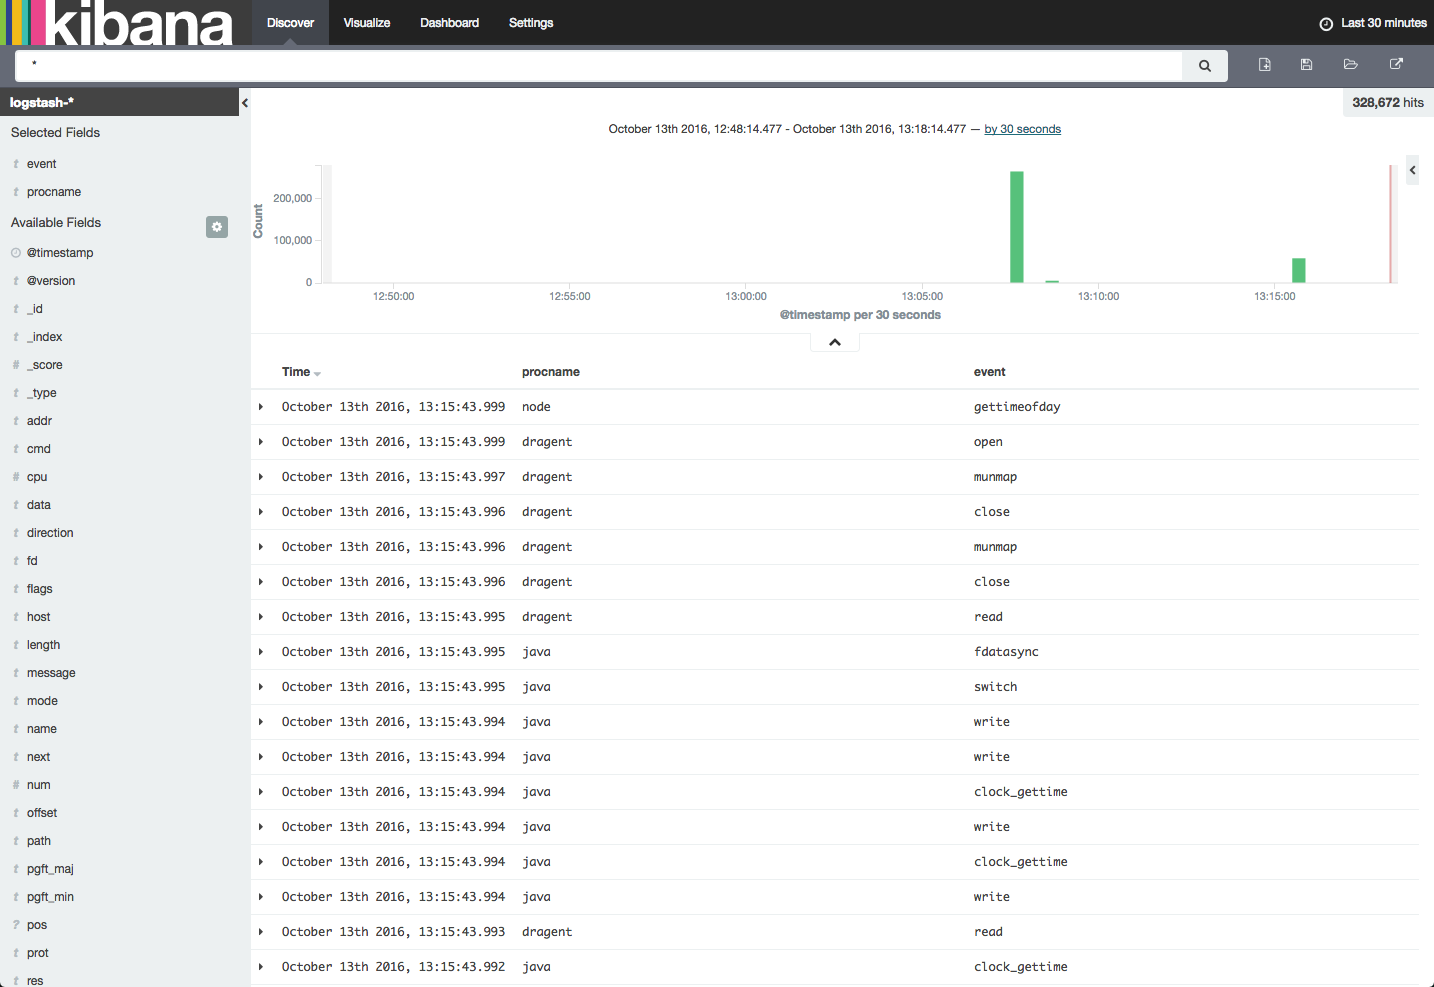
To start to understand the potential of using Sysdig with ELK, let’s begin by adding some fields to the log display. I’m going to select the “procname” and “event” fields from the list of available fields on the left:
We can now see the different processes being traced and which event they triggered. I recommend reading up on how to interpret Sysdig data before you begin analysis.
Next up — visualizing the data. This is where the fun starts. Kibana is renowned for its visualization features, but the truth is that it’s not always easy to fine-tune the visualizations to reflect exactly what we want to see in them (here’s a useful guide on how to create visualizations in Kibana).
Number of messages
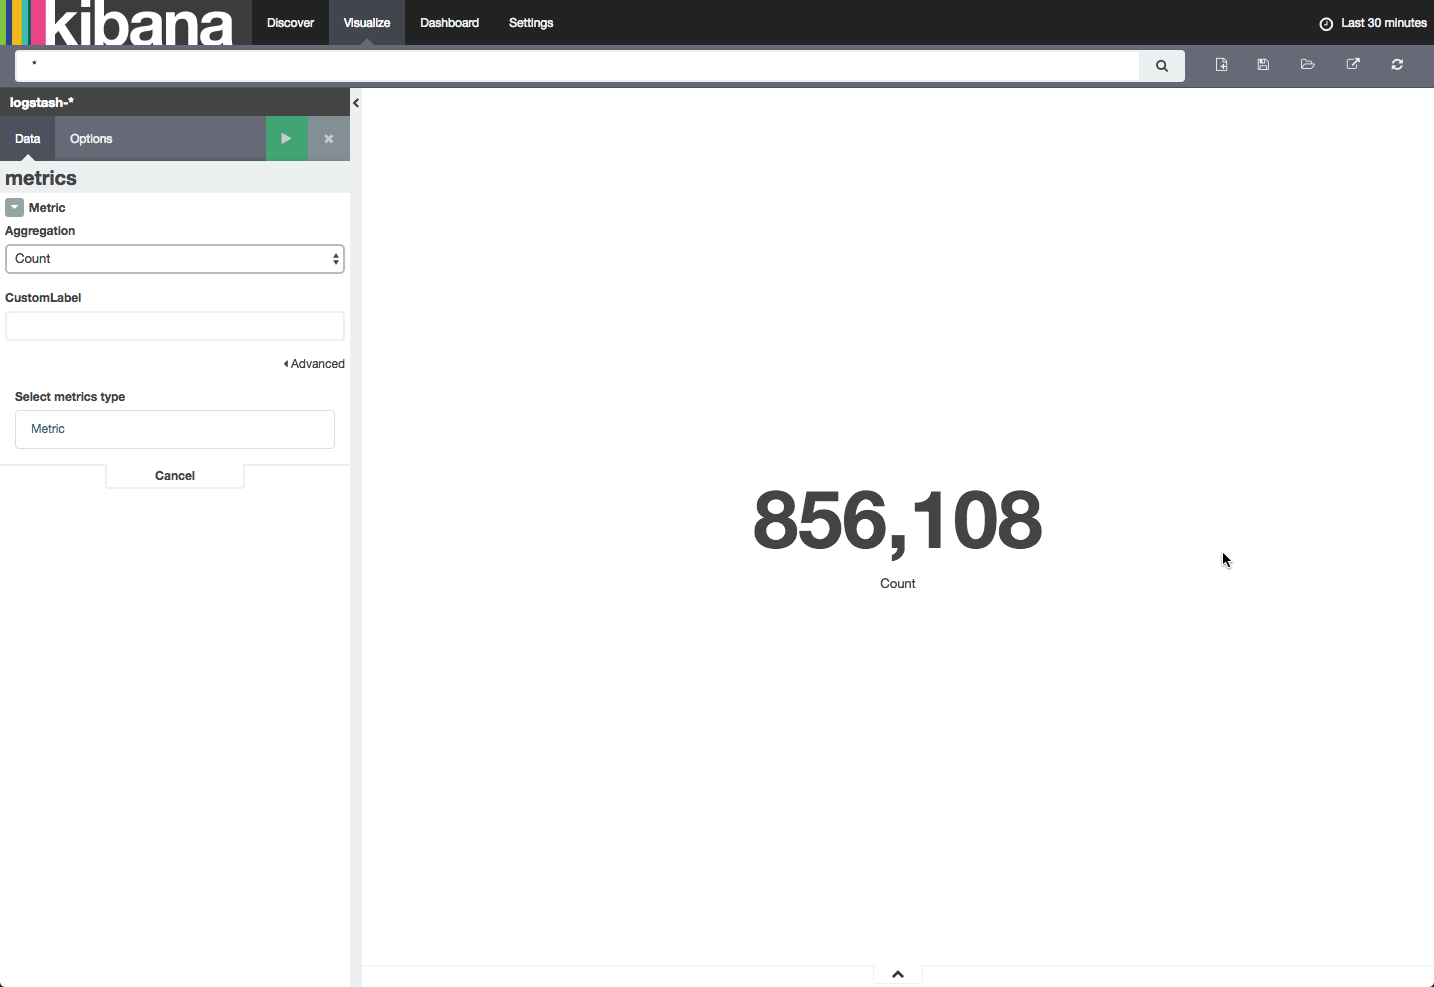
Let’s start with something simple. I’m going to create a simple metric visualization, showing the number of messages being traced by Sysdig in my machine.
To do this, I’m going to select the Visualize tab, select the Metric visualization type, use a new search, and then select Count as the aggregation type:
Top processes
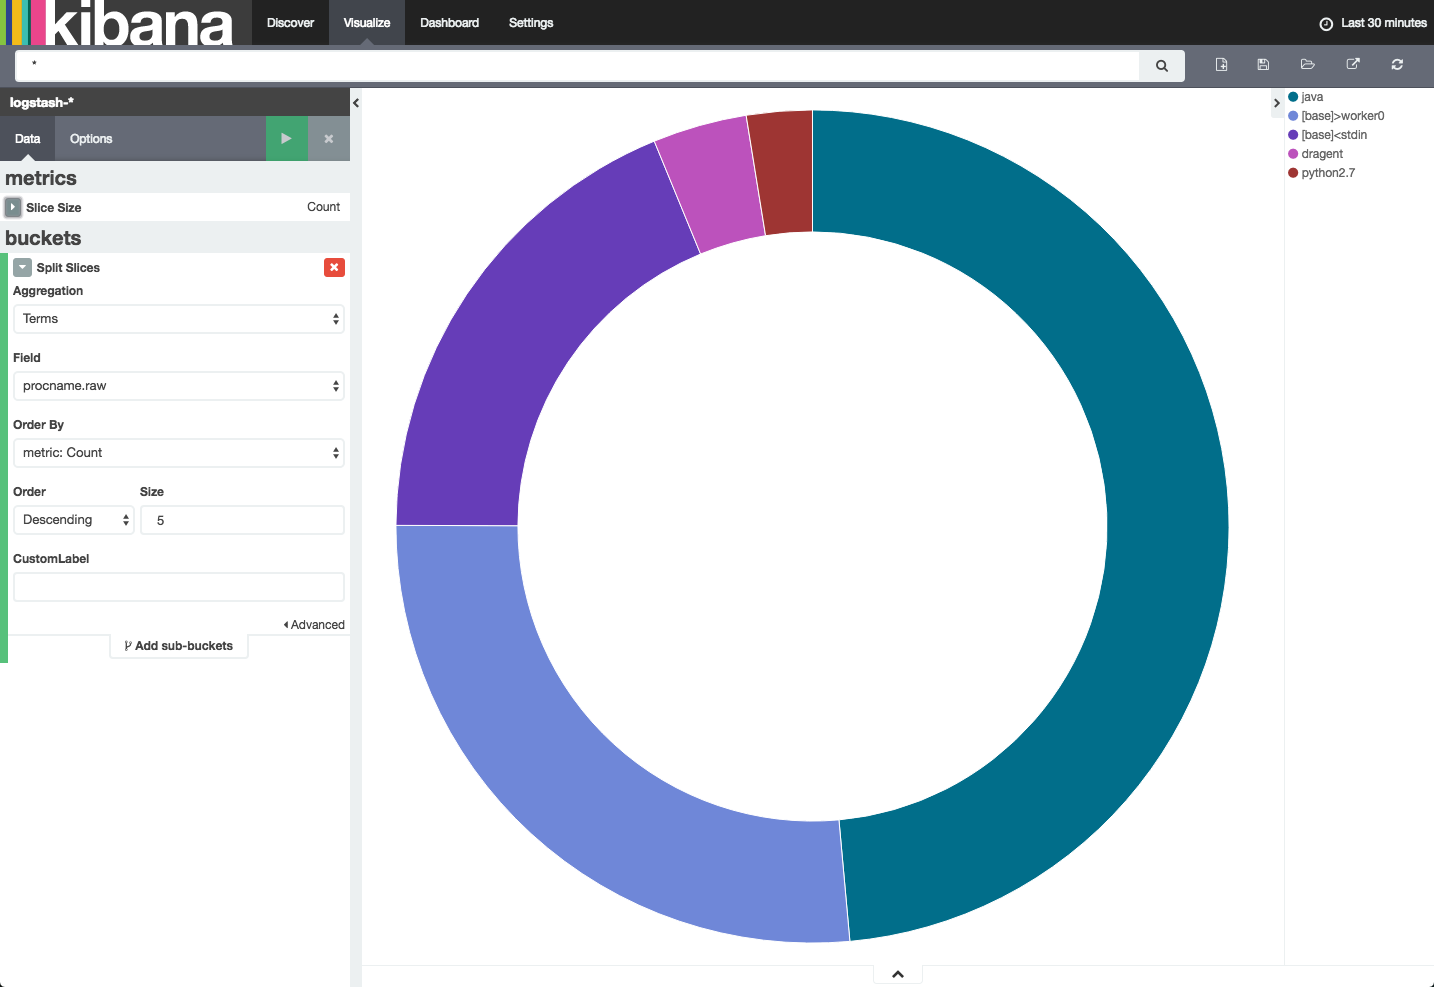
Another easy example is a pie chart that depicts the top processes that are taking place in one’s system. To create this visualization, select the pie chart visualization type and use the following configuration using the ‘procname.raw’ field:
Not surprisingly, with both Elasticsearch and Logstash running on the same system, Java is ranking first at the top of the list.
And so on. Once you have a series of these visualizations, collect them into one comprehensive dashboard for real-time system monitoring.
Reservations
Before I sign off, here are a few reasons why the title of this post contains the word “potentially.”
Logstash parsing errors
After logging Sysdig output into ELK for a while, I noticed this parsing error being reported:
"error"=>{"type"=>"mapper_parsing_exception", "reason"=>"Field name [.....Y....5.k.../.......e,..D...............] cannot contain '.'"}
This is because some of the fields outputted by Sysdig contain a dot ‘.’ A way around this is to install the Logstash de_dot plugin, a process not described here.
Logstash performance
The amount of data being shipped by Sysdig is quite large, and Logstash is prone to caving under heavy loads. In a sandbox type of environment, you can afford to ignore this. But if you scale the setup upwards a bit, you’re going to need some kind of buffering system.
Analyzed fields
Elasticsearch mapping configurations are recommended to enhance the analysis of Sysdig data in Kibana.
Out of the box, many Sysdig fields such as “procname” are reported as analyzed, meaning that they contain analyzed strings. These, in turn, consume a lot of memory and also do not visualize as expected (please note that in the pie chart visualization above, I used the ‘prodname_raw‘ field instead of ‘procname‘).
Summary
Despite these reservations, there’s no doubt that with a bit of fine-tuning and the application of extra configurations, the combination between Sysdig and ELK offers great potential for a powerful solution that monitors systems and containers.
More on the subject:
With the soaring popularity of ELK and the growing need for effective system and container monitoring, I’m sure a tighter integration between the two is forthcoming.
Anyone picking up the gauntlet?
