Taking a First Look at Amazon X-Ray
Back at AWS re:Invent in November, one could not help but feel overwhelmed by the amount — and the potential impact — of the new features and services announced. I covered some of these new features in this blog post, but one announcement I missed out on was Amazon X-Ray.
X-Ray, as its name implies, allows you to get visibility into the performance of your deployed applications by providing traces of requests as they are routed through the different service waypoints. It can thus be used to not only monitor the performance of the requests but also to identify bottlenecks and errors.
X-Ray works by adding HTTP headers to each request and passing on those headers to request handlers. At each waypoint, data “segments” are collected and then later aggregated into individual traces.
The service is currently in preview mode and supports only .NET, Java, and Node.js apps running on EC2, ECS, Elastic Beanstalk, and API Gateway, and the X-Ray SDK captures metadata for a variety of databases.
Let’s take a closer look.
Getting Started
Since X-Ray is in preview mode, you have to sign up first.
Once you’re given access, head over to the X-Ray console, where you will be presented with two ways to get started:
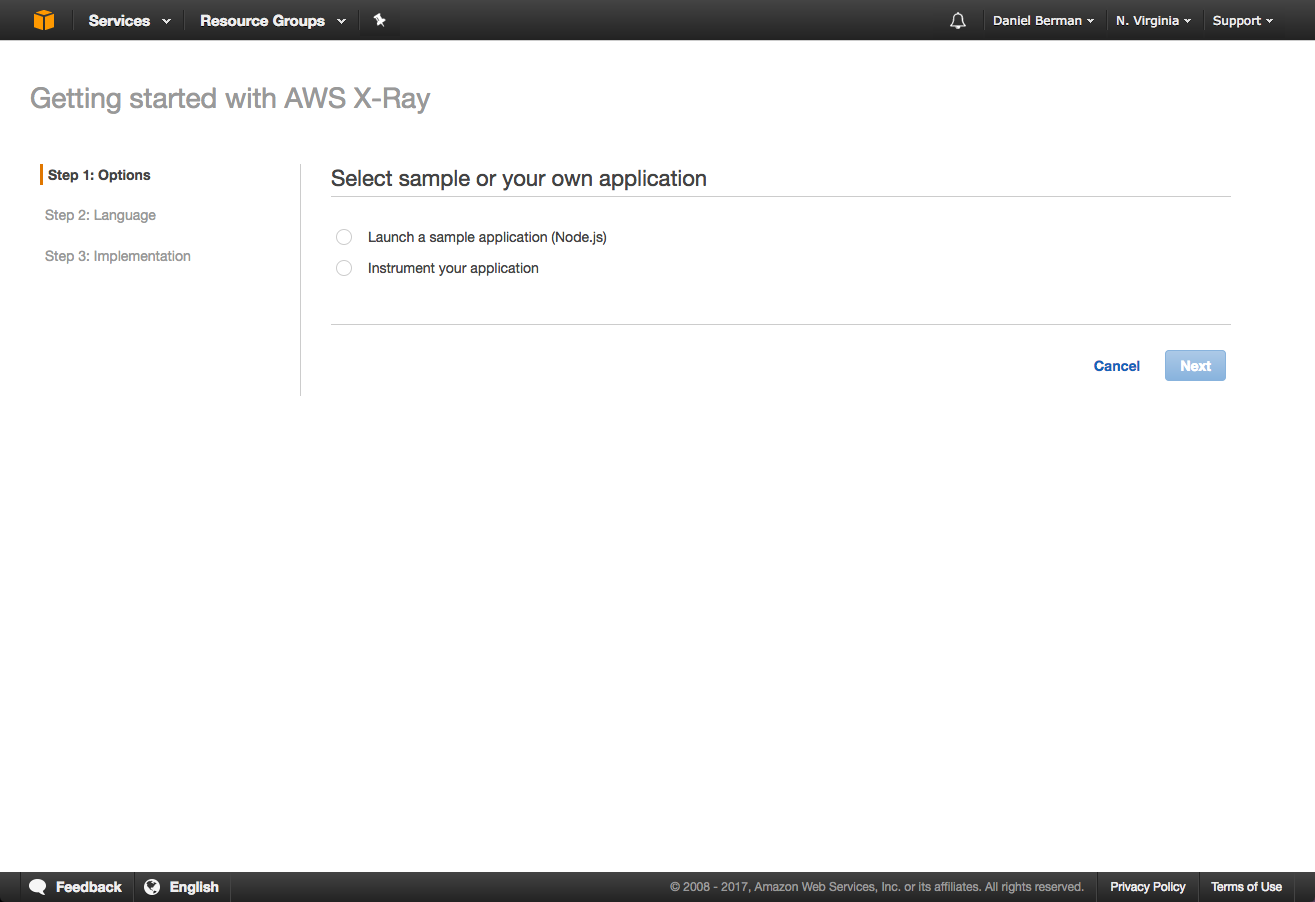
You can use your own application, and if that’s the path you’re interested in taking, you’re going to want to check out the documentation on the various available SDKs for Java, Node.js, and .NET applications.
However, the easiest and fastest way to get acquainted with X-Ray — and also the one used for the purposes of writing this post — is using the supplied Node.js demo application.
At the end of the detailed steps, you will have an Express (Node.js) app deployed on Elastic Beanstalk that serves a simple signup service that stores data on AWS DynamoDB and uses AWS SNS to send notifications.
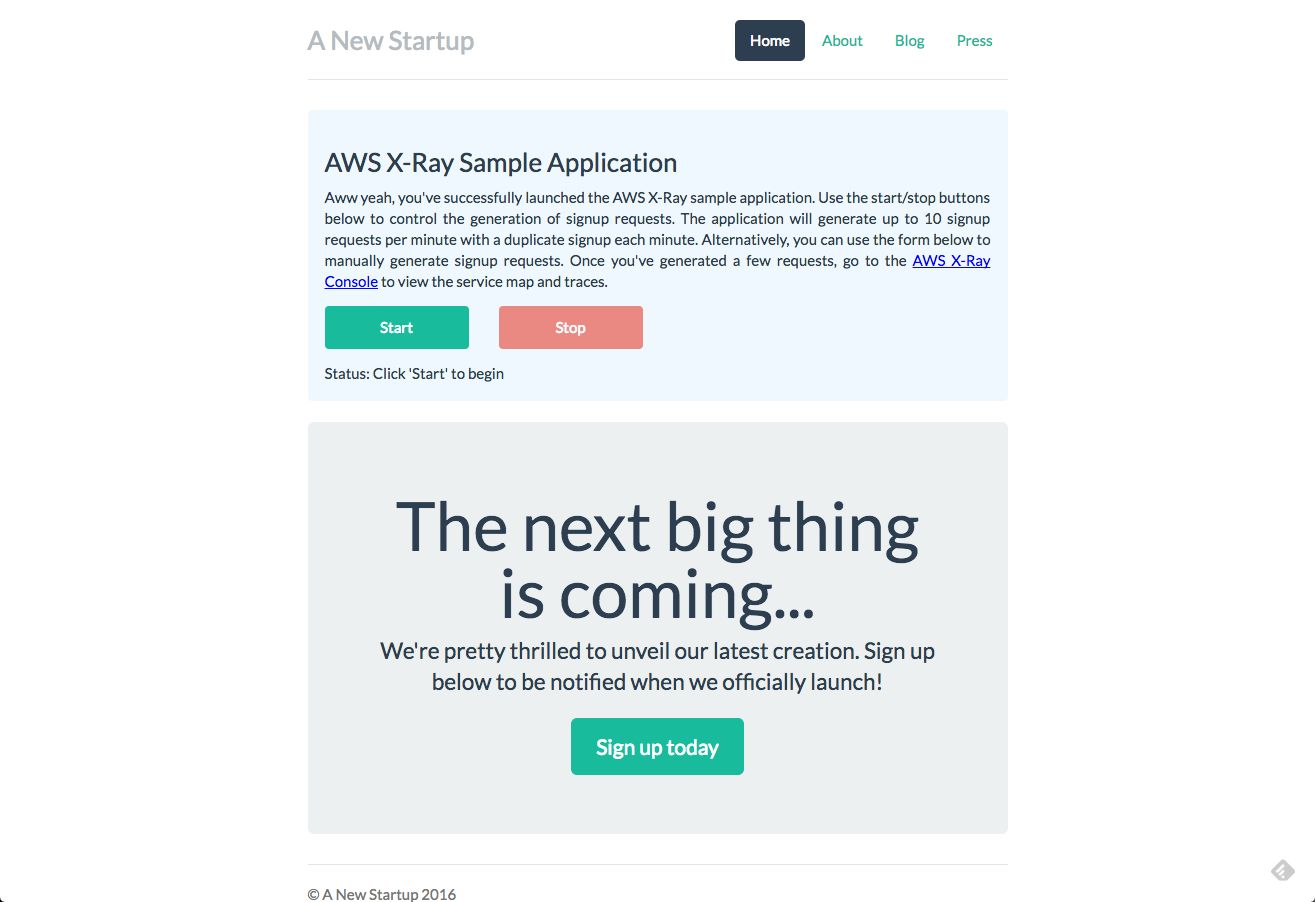
Next, start generating requests! As specified in the app, hitting the Start button will generate up to ten signup requests per minute with a duplicate signup each minute.
After a while, stop the requests and open the Service Map tab in the console. As you can see, it now starts to get interesting:
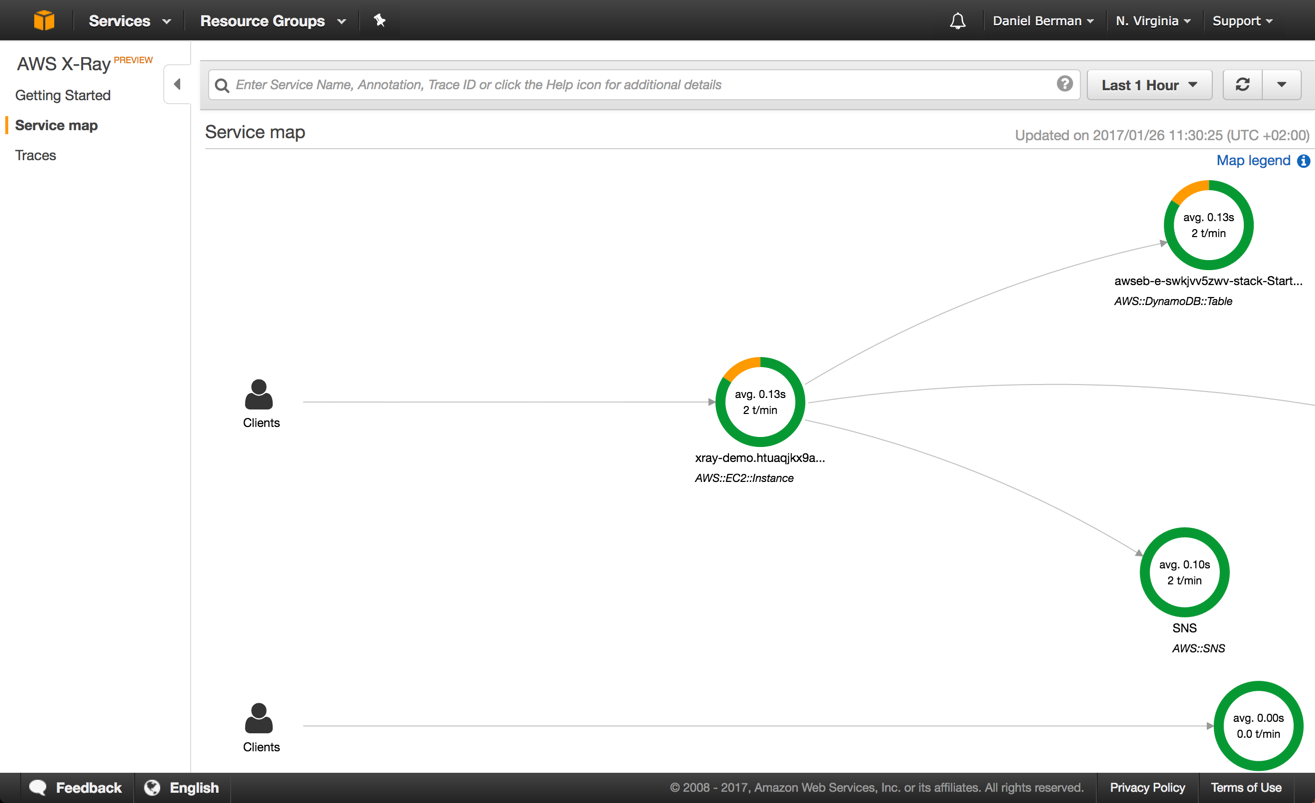
What you see is a nice map of all the requests routed between the different AWS service endpoints. In the case of the demo app, we can see requests coming from the client, to EC2, and then on to DynamoDB and SNS.
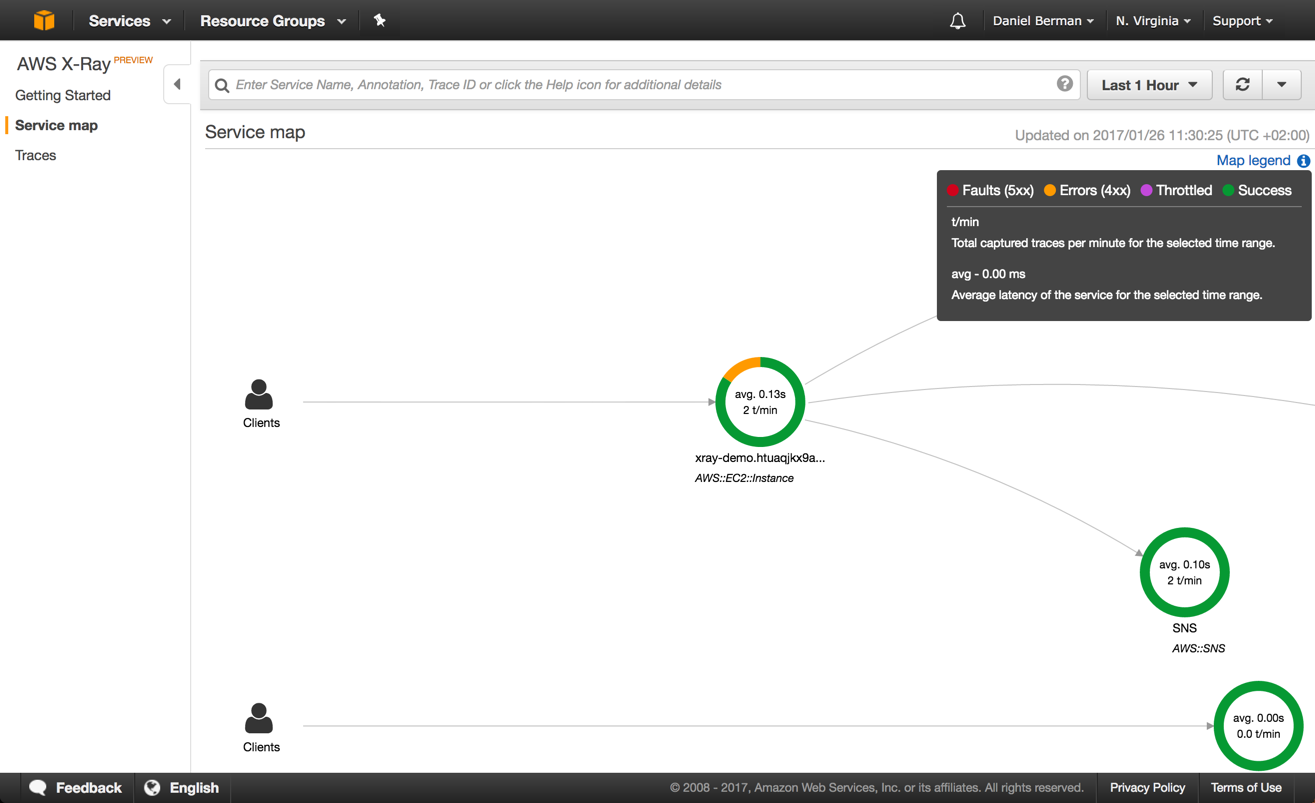
As you can see, the folks at AWS made sure our data contains some warnings. Opening the legend on the right gives us insight into the meanings of the different colors:
Each of the nodes in the map represents a request waypoint, and behind them are tracked traces. Clicking any of the nodes will lead you to these traces:
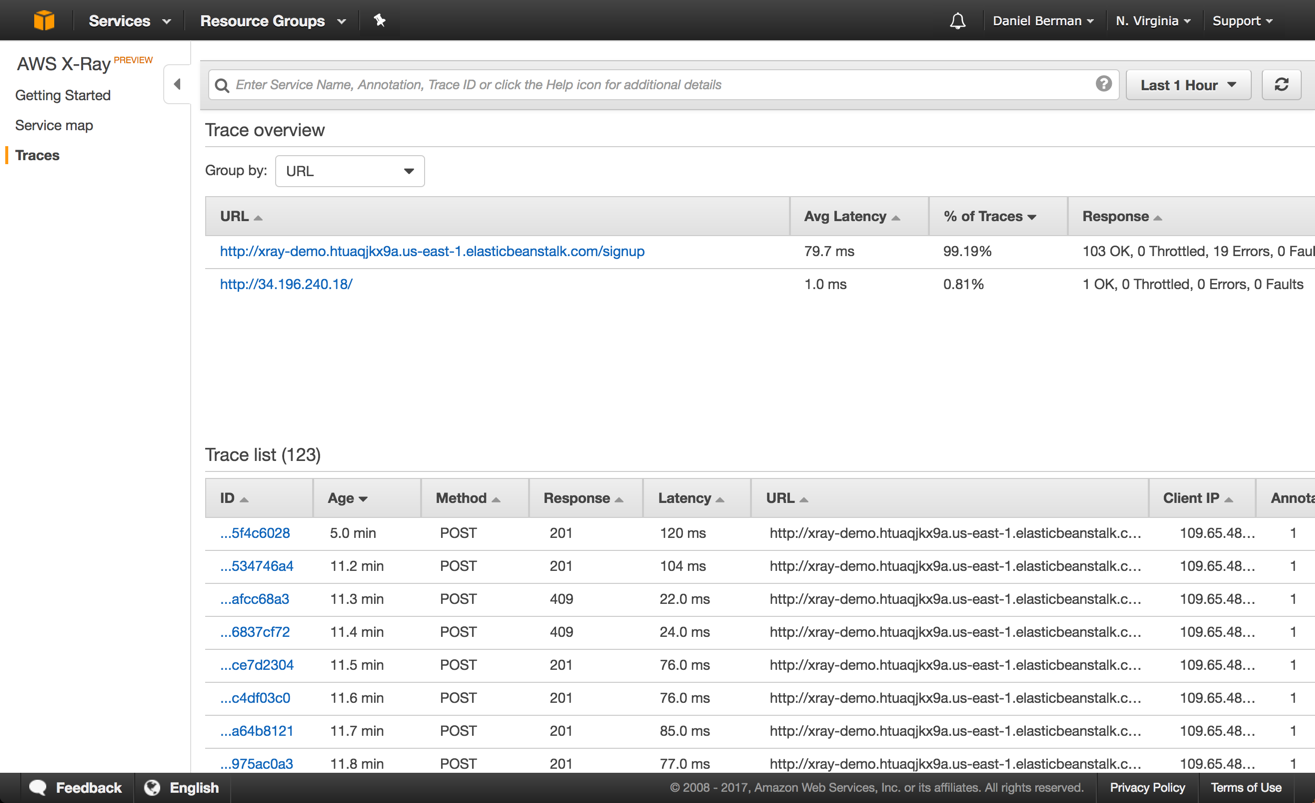
Note the Filter field at the top of the console — this field allows you to search traces using a simple filtering syntax. You can build your own custom filter or use the provided filters.
For example, say we want to narrow down the list of service requests to only those with errors:
service("xray-demo.htuaqjkx9a.us-east-1.elasticbeanstalk.com") {error = true}
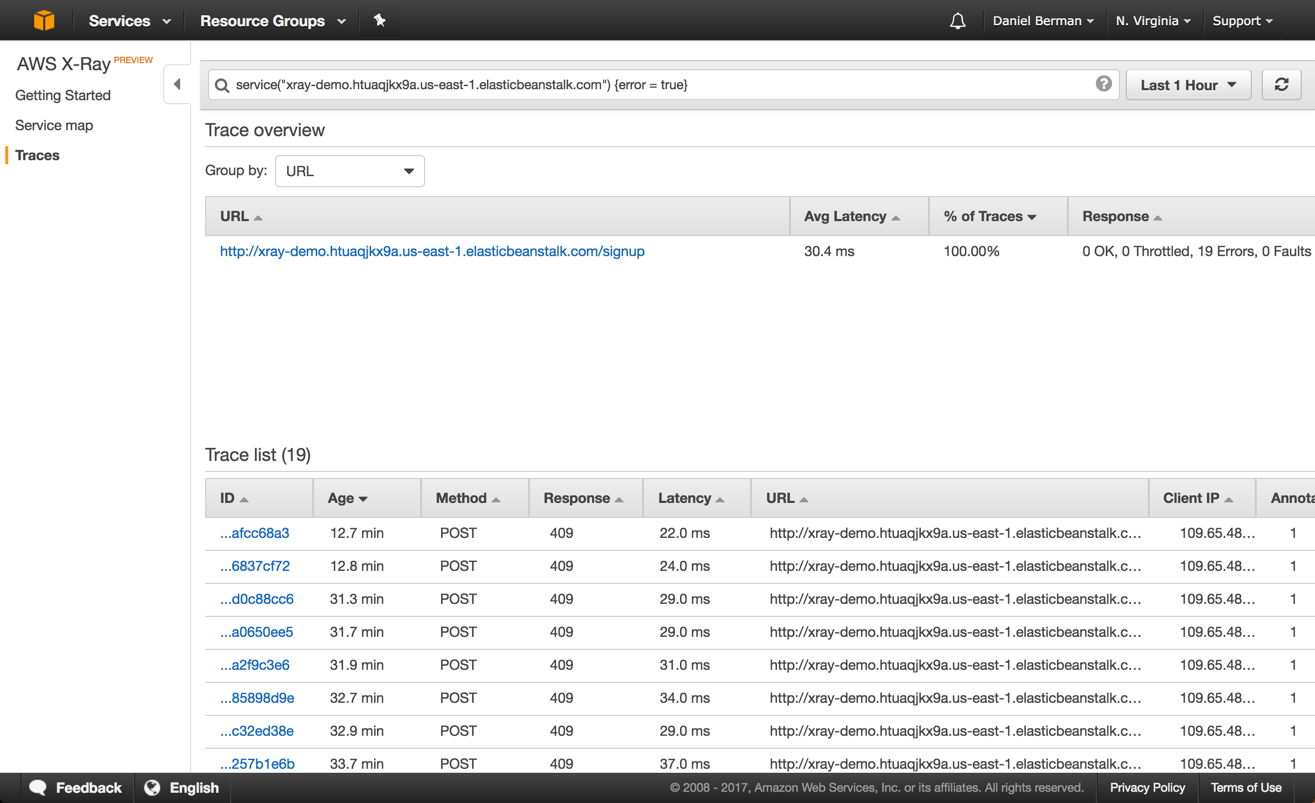
We can see that POST requests originating from the signup page are triggering 409 errors. To troubleshoot the root cause, we’re going to open one of the available traces:
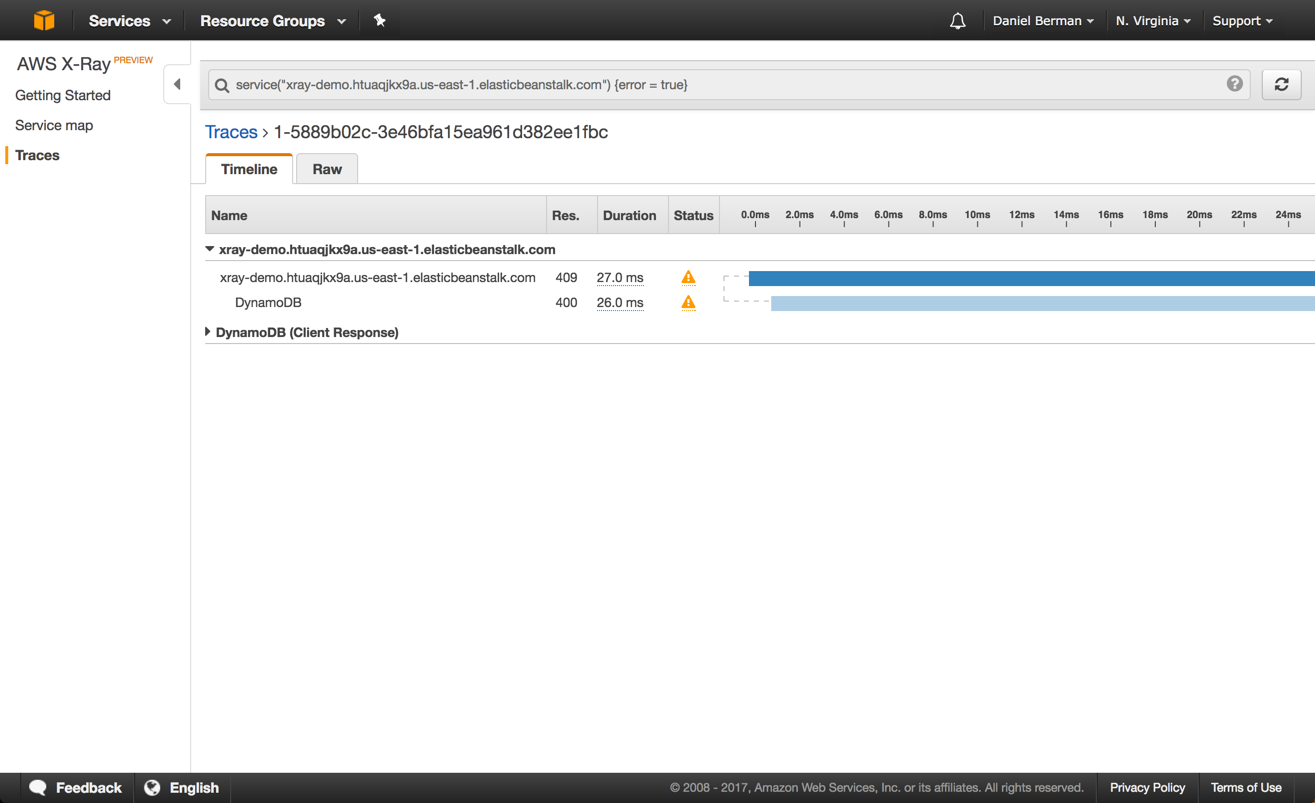
What we see is a timeline of the request — and we can see that calls to DynamoDB are failing, for some reason.
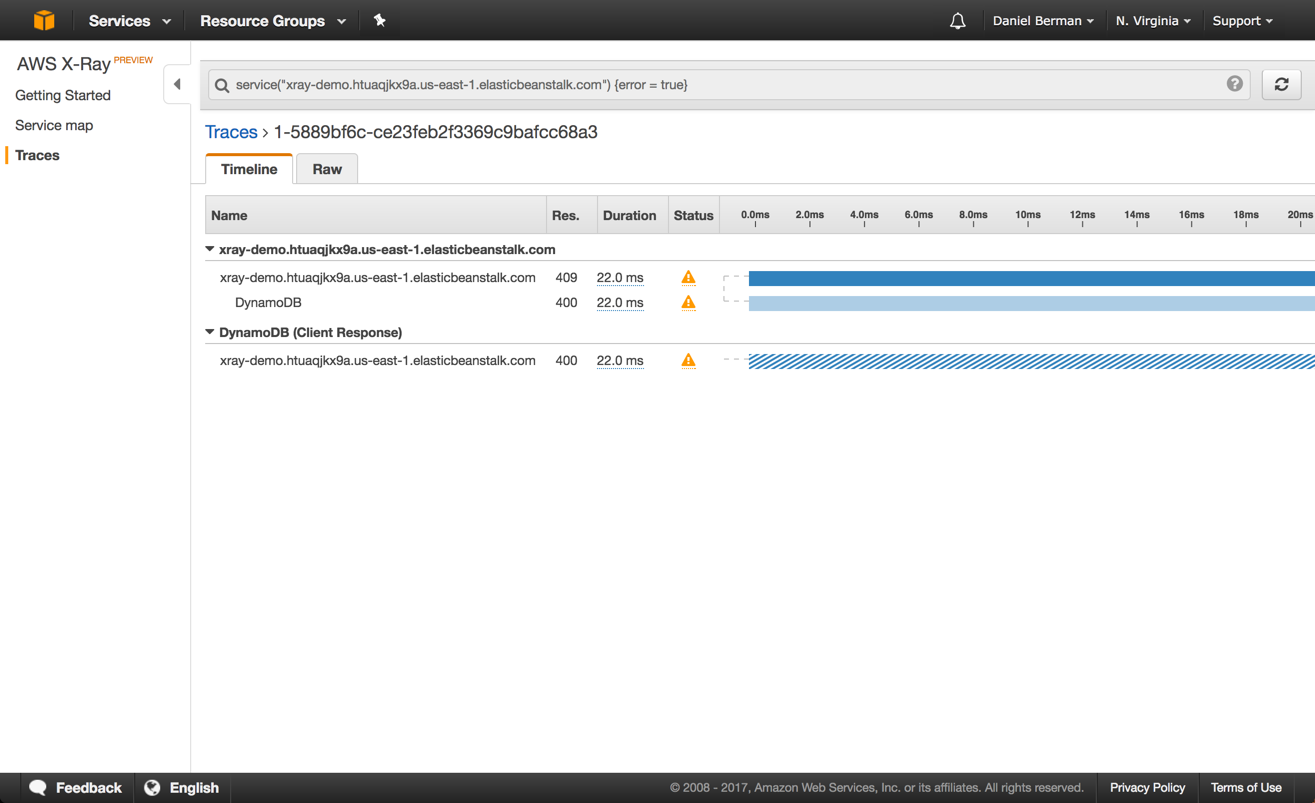
Clicking on the DynamoDB segment provides us with additional insight — we can see that the request to DynamoDB is resulting in a 400 response:
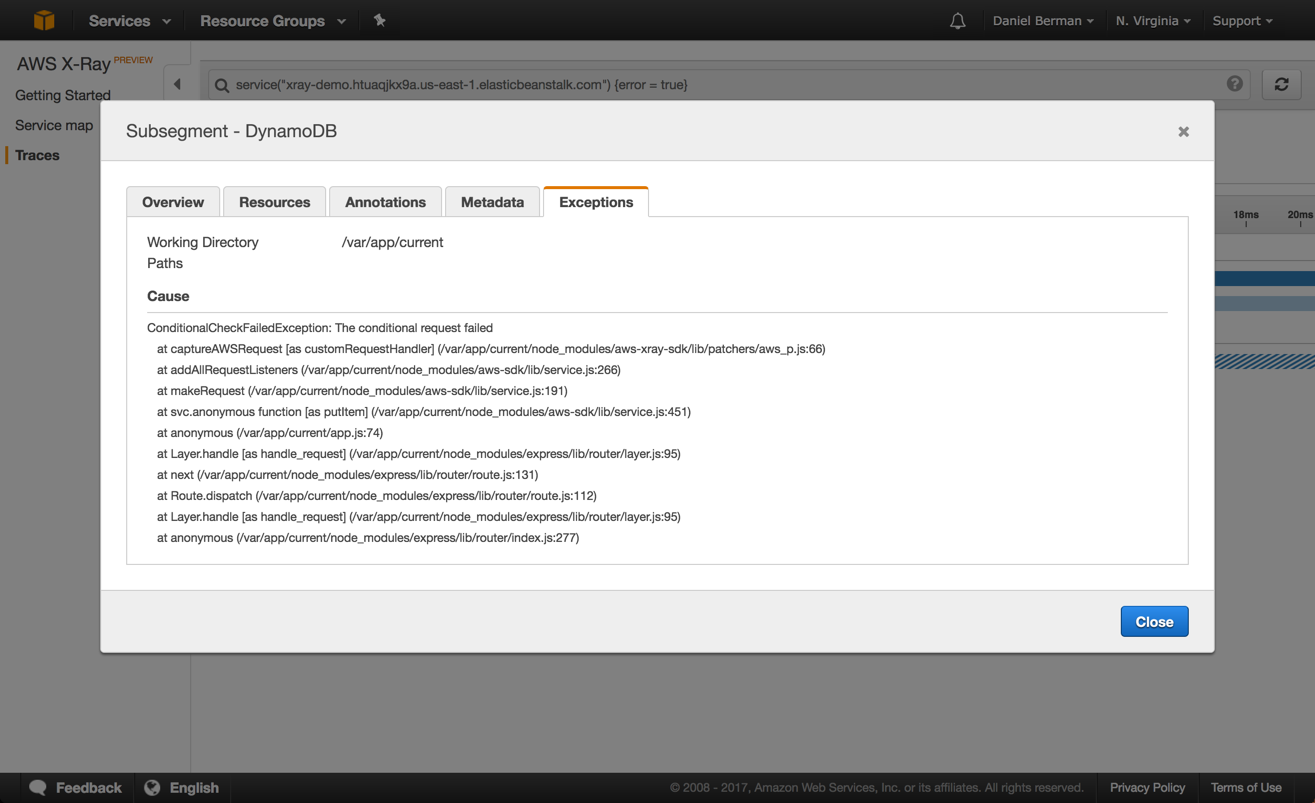
Taking a look at the DynamoDB subsegment traced by X-Ray, we can see that a ‘ConditionalCheckExceptionFailed’ exception was triggered by the request:
Summary
With the growing adoption of microservices and as IT as a whole becomes more distributed, the case for distributed stack tracing for application performance monitoring is obvious. The ability to trace requests from clients to the various the services running behind the scenes is crucial to be able to troubleshoot issues and identify bottlenecks in real-time.
More on the subject:
AWS did not invent the wheel in this case — there are some big players in the space that do an exceptionally good job at APM and stack tracing. Being only a preview, X-Ray still has some way to go before it can take on these players.
The ability to seamlessly access logs for the services represented in the Service Map is one missing feature, for example, as is support for other languages and frameworks. But X-Ray is indeed huge news for DevOps crews building their apps on AWS, and there is little doubt AWS will make sure the folks at New Relic start sweating.

You Might Also Like

Open 360TM Platform Overview Webinar

Automate Observability Tasks with Logz.io Machine Learning
Get started for free
Completely free for 14 days, no strings attached.
