Announcing Service Map: Troubleshoot With Context and Confidence
November 28, 2023

Logz.io is excited to announce Service Map, a new way to visualize the data flow, dependencies, and critical performance metrics throughout your microservices architecture, which makes it easy to gather critical troubleshooting context as you investigate production issues.
After sending your trace data to Logz.io Open 360™, Service Map automatically discovers and maps your services and the interconnections between them – providing a single view of your entire distributed system within the context of service performance.

Visualize your microservice architecture within the context of service performance
Modern cloud environments are defined by hundreds – if not thousands – of distinct components that constantly interact and communicate to respond to requests. The scale and complexity of these systems can make it extremely difficult to pinpoint the root cause of a production issue when something goes wrong.
To troubleshoot production issues quickly, engineers need to understand how their microservices behave within the context of millions of interactions with other microservices.
This is why we built Service Map.
Service Map automatically maps the dependencies, data flow, and intercommunication throughout microservice architectures – quickly providing the context engineers need to understand system behavior.
With Service Map, engineers can immediately visualize the dependencies and downstream impact of their services, which could hold the critical clues during incident investigations.
How to get started with Service Map
To get started with Service Map, the first step is to install Logz.io’s agent – which we call the Telemetry Collector – to collect your logs, metrics, and traces from your microservices.
Once you have your application telemetry data flowing into Logz.io, you can find Service Map in the product. Starting today you can navigate to Service Map from our Traces interface to view all of your Kubernetes services. Then, in just a few short weeks, you’ll find Service Map under a new App 360 navigation launched in the main nav—stay tuned for more information on this exciting new Open 360 capability soon. This will bring you to a catalog of your services, select the “Map” view in the top right corner to see your Service Map.
After sending your trace data to Logz.io, Service Map will automatically populate without requiring any additional configuration (note: if you’re sending traces via OTEL, then you will need to add additional configuration to your OTEL Collector. Learn more here.). Just by opening up the “Map” view, you’ll have a complete picture of your distributed application architecture, as well as the latency, error rates, and request rates across each service.
By filtering these metrics in the top left corner, the services with the highest values for each metrics will be highlighted. You can see a closer view of these metrics over time by hovering over each service.

After surfacing a potential issue in your performance metrics and understanding how the issue could impact the rest of the system, we can quickly dive into root cause analysis by hitting the ‘Drilldown’ option after hovering over the service of interest.
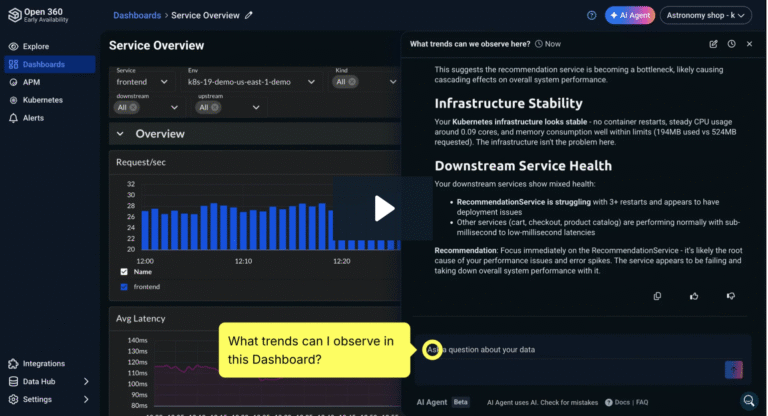
This takes us to the Service Overview, which provides critical performance metrics for the service and each transaction it executes, as well as correlated log and trace data to provide contextual troubleshooting information in a click.

View application and infrastructure performance metrics above, as well as full log search capabilities in the screenshot below – both are within the Service Overview page.

With a unified view of monitoring and troubleshooting data in one place, we can significantly reduce our MTTR for production issues.
To try Service Map and Service Overview, start by sending your trace data to Logz.io. From there, go to Traces to see a full map of your application architecture and the performance of your services.
You can also sign up for a free trial of Logz.io Open 360 to see more of our essential observability platform today.

You Might Also Like
The Open 360 AI Experience

