OpenTelemetry Metrics: Types, Examples, and Proven Best Practices for Success
October 16, 2025
Key Takeaways
- OpenTelemetry metrics measure how services perform at runtime and over time.
- Counters track totals, UpDownCounters measure fluctuating quantities, Gauges capture real-time state, and Histograms analyze distributions like latency or payload size.
- When exported to Logz.io, OpenTelemetry metrics can trigger alerts and AI investigations that accelerate root-cause analysis.
What Are OpenTelemetry Metrics?
OpenTelemetry metrics are measurements of services performance at runtime. For example, request counts, error rates, memory usage, or latency.
Here’s how they compare to logs and traces, which are other types of telemetry data instrumented by OpenTelemetry:
- Metrics – Numerical measurements collected over time that quantify system performance or resource usage. Provide a high-level view of how your system is performing.
- Logs – Detailed, time-stamped records of events that show what happened in a system.
- Traces – End-to-end records that follow a single request or transaction as it flows through multiple services.
With metrics, teams monitor trends and patterns in their system performance. For example:
- Increase in average response times are increasing
- CPU utilization reaching the max
- How traffic volumes fluctuate during peak hours
This allows DevOps teams to monitor system health and availability in real-time, and also strategically plan capacity needs.
Types of OpenTelemetry Metrics
OpenTelemetry uses metric instruments to capture different aspects of system performance. Each type serves a specific purpose to achieve observability:
- Counter – A running total. Can be used to track events or operations that accumulate over time, such as the number of HTTP requests served, jobs processed, or errors encountered.
- Asynchronous Counter – A counter collected once for each export.
- UpDownCounter – A counter that can both increase and decrease. It is used to track values that fluctuate in both directions, such as the number of active connections, queue sizes, or users logged in.
- Asynchronous UpDownCounter – The UpDownCounter collected once for each export.
- Gauge – Captures the current value at a point in time. Used for reporting system state or instantaneous measurements like CPU usage, memory consumption, or temperature.
- Asynchronous Gauge – A Gauge that is collected once for each export.
- Histogram – The distribution of values over time, typically with buckets. Used to measure latency, response times, payload sizes, or any metric where distribution and percentiles (p95, p99, etc.) matter.
Now let’s see how logs and traces are measured:
Logs
- Structure: Timestamp + message + optional key-value fields (e.g., severity, service name, request ID).
- Examples of measurements:
- Count of error logs over time (error log frequency)
- Log severity distribution (INFO, WARN, ERROR, CRITICAL)
- Log volume (e.g., GB/day) for system health/cost tracking
Traces
- Structure: A trace is made up of spans, each with:
- Start & end timestamps
- Operation name
- Attributes (metadata like service name, endpoint, DB query, etc.)
- Parent/child relationships (to link spans together)
- Examples of measurements:
- Request latency (trace duration)
- Span counts per trace (complexity of a request)
- Error percentage within traces
- Service-to-service hop counts (number of microservices a request touches)
Real-World Examples of OpenTelemetry Metrics
Here are some real-world use cases where OpenTelemetry metrics provide observability into production systems:
1. Web Application Performance
- Metric:
http_request_duration_seconds(histogram) - Use: Tracks how long HTTP requests take. Teams monitor p95/p99 latencies to detect slowdowns before users complain.
- Example: If checkout response times spike above 500ms for 5% of requests, SREs get alerted.
2. Service Reliability & Availability
- Metric:
http_requests_total(counter) +http_requests_failed_total(counter) - Use: Measures request volume and error rate. Forms the basis for SLA.
- Example: An MSP uses OTel metrics to prove they maintain 99.9% uptime for client services.
3. Database Health
- Metric:
db_connections_active(updowncounter) - Use: Monitors active DB connections, ensuring the pool isn’t exhausted.
- Example: When connections approach the pool limit, alerts trigger scaling actions.
4. Infrastructure & Resource Monitoring
- Metric:
cpu_usage_percent(gauge) andmemory_usage_bytes(gauge) - Use: Keeps track of resource consumption on VMs, containers, or Kubernetes pods.
- Example: Teams use these metrics for capacity planning. When CPU usage averages above 80% for a week, they provision more nodes.
5. Queue & Streaming Systems
- Metric:
queue_length(updowncounter) +message_processing_duration_seconds(histogram) - Use: Ensures message brokers (Kafka, RabbitMQ, SQS) are processing messages fast enough.
- Example: If queue length grows without matching throughput, teams know consumers are lagging.
Exporting and Visualizing OpenTelemetry Metrics
OTEL Metrics can be exported and visualized to gain real-time insights into system performance, resource utilization, and application health.
Collected metrics are sent to the OpenTelemetry Collector, which can process, transform, and enrich the data. Logz.io provides a collector built on the OTel foundation, which enables exporting metrics to Logz.io in a streamlined and scalable manner.
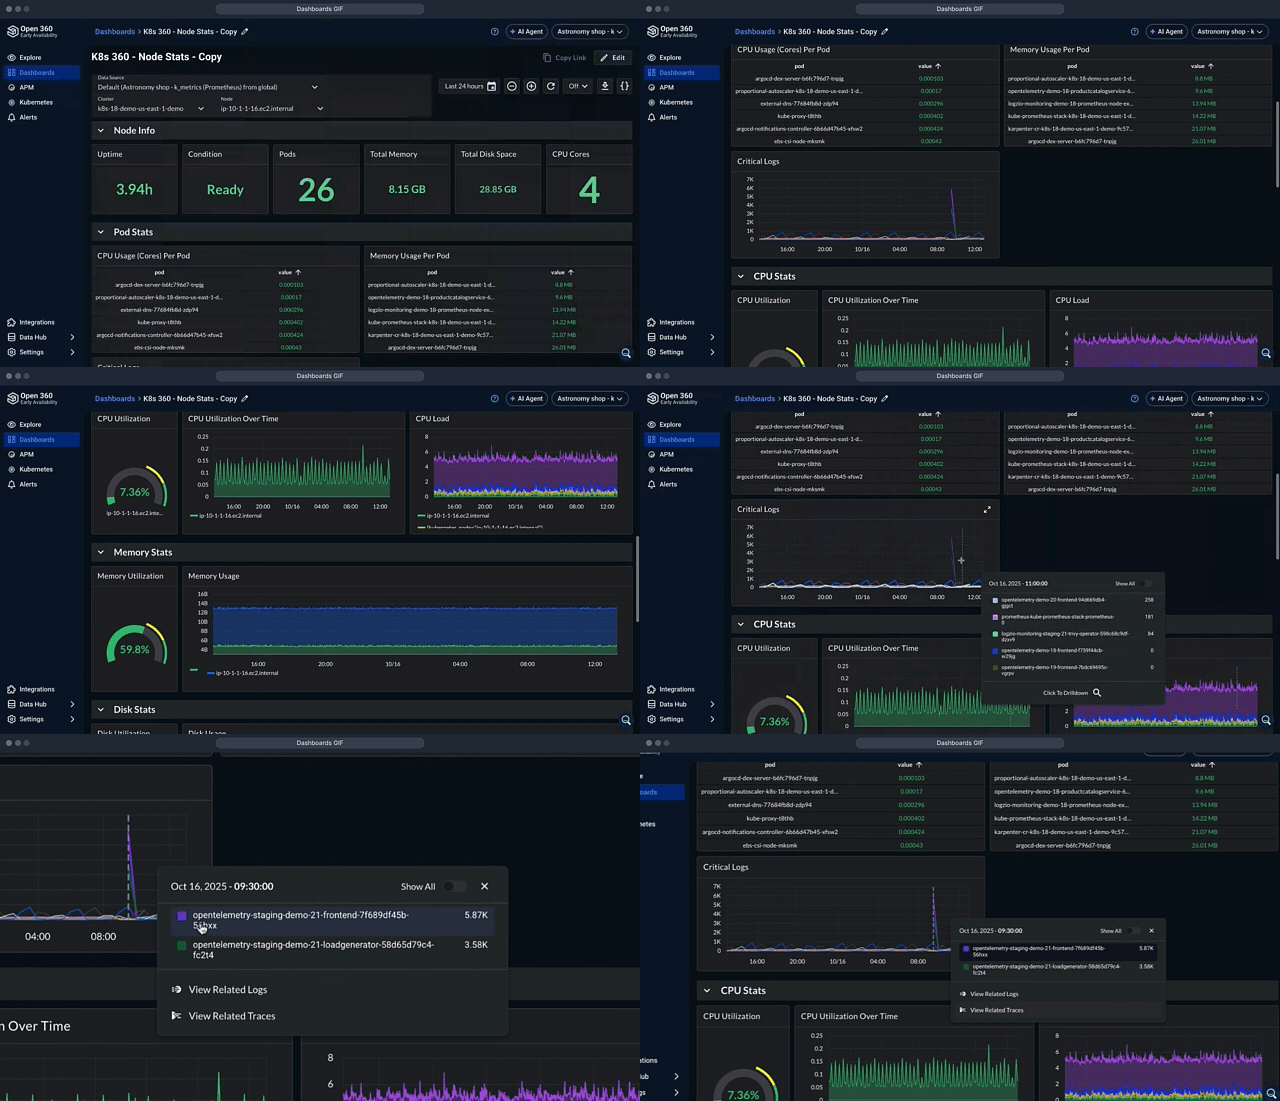
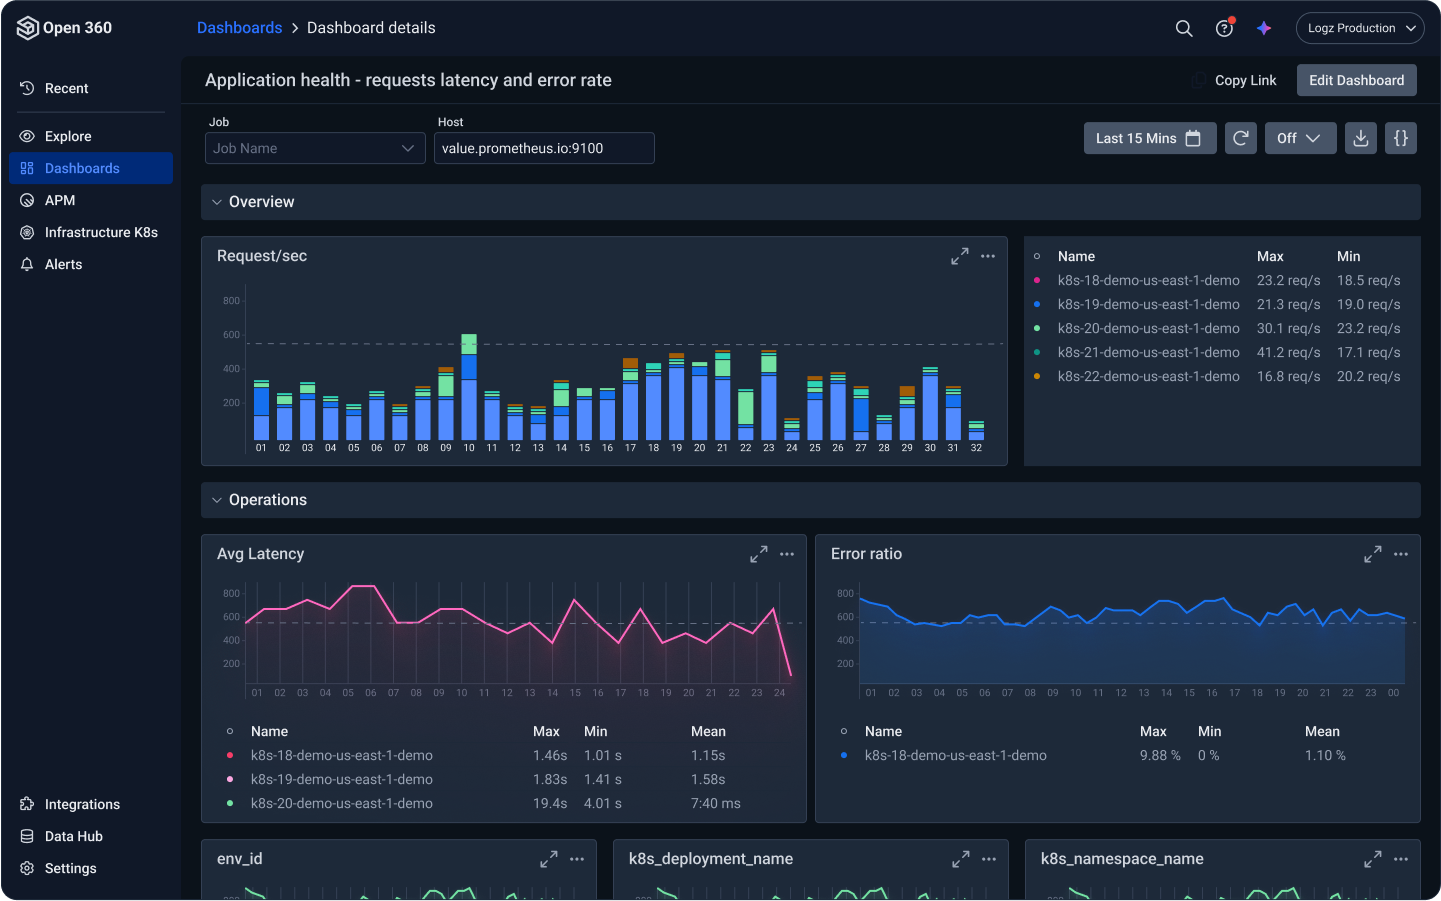
Once exported, metrics are aggregated and displayed in dashboards. Logz.io provides unified dashboards where OTel metrics can be correlated with logs and traces in one place, simplifying root-cause analysis and reducing MTTR.
Then, teams define thresholds and anomaly detection rules (e.g., alert if error_rate > 5% for 5 minutes). These connect to incident management tools like PagerDuty or Slack and to Logz.io AI agents.

AI agents automate and enhance RCA by investigating root causes when an alert fires. They also enable interacting with the captured data and creating dashboards based on natural language prompts.
Best Practices for Using OpenTelemetry Metrics
Here’s a practical checklist to keep your OpenTelemetry metrics reliable, scalable, and useful in production:
- Instrument with the right types – Use the proper instrument for the metric’s lifecycle and behavior. Counters for totals, OpenTelemetry histograms for distributions, up/down counters for concurrency, etc. And avoid redundant instrumentation.
- Control cardinality – Keep label sets small and predictable; unbounded label values (like user IDs or URLs) will destroy your backend’s scalability.
- Follow semantic conventions – Adopt OpenTelemetry’s standard metric names, units, and attributes to keep your telemetry portable and interoperable across ecosystems.
- Design histograms intentionally – Define bucket boundaries that align with your SLOs and use examples for trace correlation; don’t rely on defaults that blur latency insights.
- Stabilize resource attributes – Resource attributes define where data comes from. Keep them accurate (service name, version, environment) and free from volatile values.
- Push complexity to the Collector – Centralize metric transformations, filtering, and routing in the Collector so application code stays clean and telemetry remains consistent.
- Wire metrics to SLOs, not dashboards – Start from business or user outcomes; metrics should explain why an SLO burns, not just feed pretty graphs.
- Test telemetry like code – Validate that instruments exist, values make sense, and schema changes don’t break alerts. Treat telemetry contracts as part of CI/CD.
- Optimize export paths – Batch efficiently, minimize network hops, and monitor your exporter’s performance to avoid telemetry-induced noise or drops.
- Plan for schema evolution – Version metric names, publish schema URLs, and manage deprecations carefully. Your observability data is a long-lived API.
Common pitfalls to avoid
- Counters that go down (use UpDownCounter instead).
- Attributes with unbounded values (URLs with query strings, dynamic IDs).
- Overlapping metrics that double-count (two layers recording the same event).
- Silent breaks from renames/unit changes (treat as migration with parallel emit + cutover).
OpenTelemetry and Logz.io
Using OpenTelemetry with Logz.io gives DevOps and engineering teams a unified, cloud-native way to collect, process, and visualize observability data at scale. OTel acts as the open standard for instrumenting code and generating telemetry across metrics, logs, and traces, while Logz.io provides the managed backend to store, correlate, and analyze that data in real time.
Once OpenTelemetry data is ingested into Logz.io via the Collector, teams can apply advanced analytics, set up dashboards, and trigger alerts on performance anomalies. When an alert fires, AI agents perform RCA and provided remediation guidance. The result is full-stack observability powered by open standards and enhanced with Logz.io’s AI-driven insights and collaboration tools.
FAQs
How are metrics collected within the OpenTelemetry Metrics API?
Developers define instruments such as counters, gauges, and histograms, which record measurements when specific events occur in the application. These instruments feed data into a metrics SDK that aggregates, samples, or batches measurements before exporting them to observability platforms.
What are Gauges in OpenTelemetry, and what do they monitor?
A value that can go up or down over time, reflecting the current state of a system rather than a cumulative total. They are useful for monitoring things like CPU utilization, memory consumption, queue length, or active connections.
How to visualize OpenTelemetry metrics?
Once collected, OpenTelemetry metrics are exported to observability backends where they can be queried and visualized. Visualization involves plotting counters, gauges, and histograms in charts, heatmaps, or dashboards that highlight trends, anomalies, and correlations across systems. These visualizations help teams quickly spot performance issues, monitor SLAs, and track capacity planning over time. Popular tools like Logz.io leverage AI to create and query visualizations.
What is the difference between OpenTelemetry tracing and metrics?
Metrics provide aggregated, numerical data about system behavior. For example, request rates, error counts, or latency distributions. Tracing captures detailed, end-to-end information about individual requests as they flow through services. Traces offer contextual insights into bottlenecks or failures. Metrics give the “what” (performance trends), while traces explain the “why” (the specific sequence of events behind an issue).
How can OpenTelemetry metrics help in understanding application performance and behavior?
OpenTelemetry metrics reveal patterns and anomalies in application performance that are otherwise invisible. KPIs such as throughput, latency, and error rates enable identifying performance regressions, resource exhaustion, or traffic spikes before they impact users. Metrics also support proactive capacity planning and SLA monitoring. When combined with traces and logs, metrics act as an early warning system, enabling faster root cause analysis and improved resilience in complex, distributed environments.


