Best Practices for MongoDB Monitoring with Prometheus
February 16, 2023

The MongoDB document-oriented database is one of the most popular database tools available today. Developed as an open-source project, MongoDB is highly scalable and can be set up in your environment in just a few simple steps.
When running and managing databases, monitoring is a key requirement. In this article, we’ll review monitoring MongoDB using Prometheus, and provide a detailed “how to” for streamlining your metrics management, and increasing scalability through integration with Logz.io. If you’re just getting started with Prometheus, you can visit our beginner’s guide.
Used as a document store, MongoDB is easy to scale for read/write operations. Data can be saved as a JSON schema, making it easy to work with programming languages offering native support for JSON, like JavaScript. MongoDB relies on replication to scale for reads, and sharding for writes.
Replication in MongoDB
Replication allows you to copy your data at multiple instances in order to configure your application to read from multiple places. This helps to scale your reads, and can be achieved easily by following MongoDB documentation.
Sharding in MongoDB
Sharding is a method to split your data and save it into different MongoDB instances, rather than keep all of the data at each instance. This ensures that you will be able to write the data in multiple places, yielding increased write performance. MongoDB offers additional information about sharding and its implementation.
How to Monitor MongoDB with Prometheus
MongoDB does not offer native support for Prometheus. Instead, you need to use a MongoDB exporter that can talk to the database, query the status and data from MongoDB, and then present it as a metric in Prometheus format. You can run it either as a container or as a process, feed it the MongoDB URL, and it will then start emitting the metrics.
There are two ways to run the MongoDB exporter: You can run it as a container in Kubernetes or as a process in a native VM. Let’s explore both methods and how to implement them.
Native VM Installation
With native VM installation, the MongoDB exporter will run as a process and expose a port for the metrics to be collected. To run it as a process, follow these steps:
1. Download the compatible binary from this repository.
2. Execute the binary with below command:
mongodb_exporter_linux_amd64/mongodb_exporter
--mongodb.uri=mongodb://127.0.0.1:17001
--mongodb.collstats-colls=db1.c1,db2.c2
3. Verify that the exporter is running as expected and that you are able to see the metrics. To verify this, open https://localhost:9216/metrics in your machines, and you should see the Prometheus metrics.
Docker/Kubernetes Installation
You can easily run this exporter as a Docker or Podman container. To do so, export the port or the container with the -p option and supply the MongoDB URL as follows:
# with podman
podman run -d -p 9216:9216 -p 17001:17001
percona/mongodb_exporter:0.20
 --mongodb.uri=mongodb://127.0.0.1:17001
# with docker
docker run -d -p 9216:9216 -p 17001:17001
percona/mongodb_exporter:0.20
--mongodb.uri=mongodb://127.0.0.1:17001Once you have the exporters running, you will have to configure your Prometheus server to start scraping the metrics from these exporter URLs. If you are running Prometheus in Native VM, you can add the below mentioned scrape configuration in the Prometheus configuration file and then verify the metrics:
scrape_configs:
  - job_name: mongo_exporter
    static_configs:
    - targets: ['<<MONGODB-EXPORTER-HOSTNAME>>:9216]
After configuring this, restart your MongoDB server and you should start seeing the metrics flowing into Prometheus.
Running Prometheus in Kubernetes
There are two ways to deploy Prometheus in Kubernetes. The first is through Helm Chart, which requires you to define annotations on the exporter boxes so that Prometheus can understand which pods to pull the metrics from.
To do so, add the below configurations to your pod annotations:
annotations:
    prometheus.io/path: /metrics
    prometheus.io/scrape: "true"
The second option is the operator method. In this case, you will have to define the service monitor object that helps the Prometheus operator define the config.
Add the below yaml to create the service monitor object:
apiVersion: monitoring.coreos.com/v1
kind: ServiceMonitor
Metadata:
  labels:
    app: prometheus-mongo-exporter
    name: redis-exporter-prometheus-mongo-exporter
  namespace: monitor
  spec:
  endpoints:
  - interval: 15s
    port: mongo-exporter
  selector:
    matchLabels:
      app: mongo
Best Practices and Key Metrics for Monitoring in MongoDB
Now, we’ll discuss the most important metrics to keep an eye on in MongoDB to help identify issues with function and performance.
1. Health Check
Health check indicates that the process is working as expected and should be constantly monitored for any application, not just MongoDB.
2. Operation Execution Time
This is the average execution time of each read or write operation over a given interval. An increase could indicate performance issues with MongoDB.
3. Queues
These are the reads or writes waiting in queue for a lock, which could indicate issues with the schema or a conflicting writing path, thus leading to a scarcity of database resources.
4. Connected Clients
These are the number of connected clients within your MongoDB server. Keeping close watch on this is important, as any sudden increase could harm the performance of MongoDB. This is because the number of connections made to a MongoDB instance is restricted by the resources allocated.
5. Replication Lag
This measures the time in seconds between writes from the primary node until it is propagated to the secondary node. High replication could signal that a secondary node is facing problems in replicating data from the primary node.
6. Replication Oplog Window
This is the number of hours in the primary node’s replication oplog.
7. Replication Headroom
This represents the difference between the replication oplog window and the secondary node’s replication lag. If the headroom drops to zero, the secondary nodes go into recovery mode.
8. Opscounter
This metric represents the average rate of operations executed per second, or in a given timeframe. It can be useful for identifying various types of operations being performed and their rates in different MongoDB instances.
9. Network I/O
Network I/O indicates the network bandwidth usage in your MongoDB machines. It is a key metric, as it indicates whether you need to increase machine size or shard data.
10. Memory Utilization
This indicates the amount of memory used by your MongoDB instances. MongoDB keeps a large amount of data in the memory for performance reasons—such as serving the reads faster—making memory a critical resource to monitor. Memory usage exceeding 90% could indicate problems, especially in cases where memory usage continues to increase at a steady or exponential rate.
11. Disk Latency
A higher disk read and write latency could directly impact MongoDB performance, making it important to monitor disk latency.
12. Slow Logs
Configuring MongoDB to log slow queries helps to identify operations that are exceeding the defined threshold.
Integrating MongoDB Metrics with Logz.io Using Prometheus
Prometheus is a fast and easy way to get started monitoring MongoDB. After MongoDB metrics are scraped by Prometheus, you can use Grafana to plot the metrics, and then add alerting using Alert Manager or Grafana.
Prometheus, however, can be difficult to scale in large cloud environments. Maintaining a scalable Prometheus architecture can require tedious cluster management, upgrades, performance tuning, and other tasks. You may end up using a number of different tools like Thanos or Trickster in an attempt to keep up with the increasing number of Prometheus metrics samples.
Plus, Prometheus is a dedicated metrics collection and storage solution – meaning your metrics will be siloed from your log and trace data, which can hinder troubleshooting efforts.
Logz.io offers easy, hassle-free scaling with Prometheus-as-a-service, replacing the need to monitor many different tools and a growing number of metrics. By simply adding three lines of code to your Prometheus config files you can begin forwarding your metrics to Logz.io for storage and analysis – which also unifies your metrics with your log and trace data.
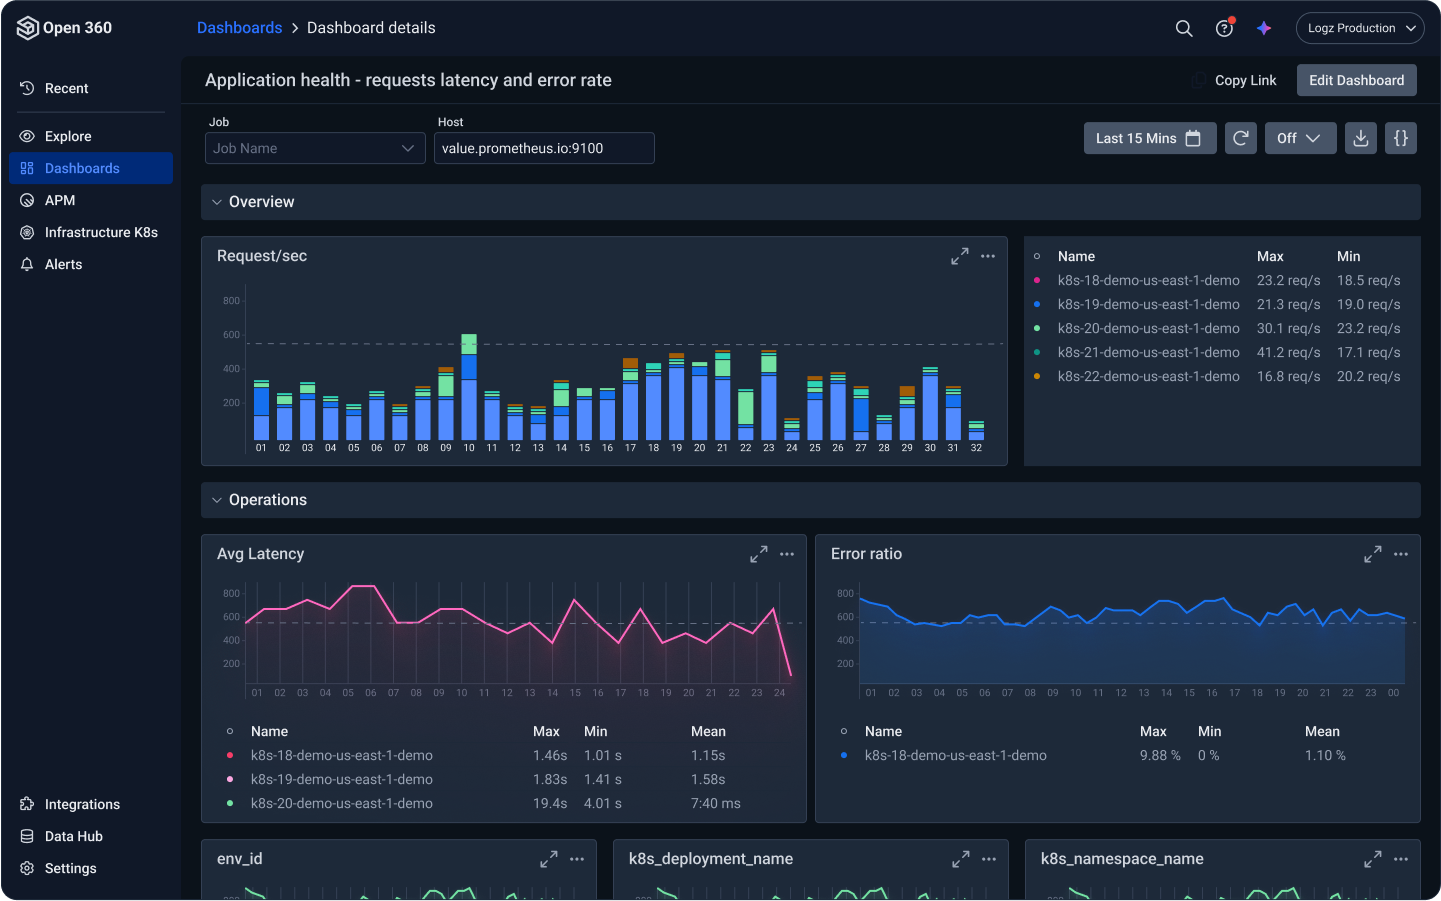
Further, Logz.io enables you to build and customize MongoDB data visualizations using PromQL and subsequently drill down into emerging trends with filters and a drag and drop interface. You can also migrate existing Grafana dashboards into Logz.io.
Follow these steps to integrate your MongoDB Prometheus metrics with Logz.io using the Prometheus remote write functionality:
1. Create a Logz.io account, and find the appropriate region and listener for your needs.
2. Get the authorization information to push the metrics to Logz.io servers using the Logz.io metrics token, by going to: Settings > Manage tokens > Data shipping tokens > Metrics.
3. Configure your Prometheus to remote write the metrics to the Logz.io servers, using the below configurations:
global:
  external_labels:
    p8s_logzio_name: <labelvalue>
remote_write:
  - url: https://<<LISTENER-HOST>>:8053
    bearer_token: <<PROMETHEUS-METRICS-SHIPPING-TOKEN>>
    remote_timeout: 30s
    queue_config:
      batch_send_deadline: 5s  #default = 5s
      max_shards: 10  #default = 1000
      min_shards: 1
      max_samples_per_send: 500 #default = 100
      capacity: 10000  #default = 500
4. Restart your Prometheus server in order to see the metrics flowing into the Logz.io dashboard. You can then use the Logz explorer feature to start building the dashboards.

There are two ways to create dashboards. You can either create your own dashboard, or you can import any open-source Grafana dashboard directly.
Import Grafana Dashboard
To import the Grafana dashboard:
1. Download the JSON of the Grafana dashboard.
2. Navigate to the metrics section in Logz.io, and then click on “import” in the dashboard section.
3. Upload the downloaded JSON, and you will then be able to see your dashboards.
You can also follow this link to learn more about importing dashboards in Grafana.
Create a Custom Dashboard or Metrics Panel
1. To create a new dashboard, click on “Dashboard” and then the “+” sign.
2. Add the desired metrics panels to this dashboard by adding your query and type of visualization.
You can follow this documentation to create a new dashboard in Grafana or Logz.io.
Conclusion
As the most fundamental component of your system, you can’t risk your databases experiencing poor performance or going into an unreliable state. Recovery capabilities for your databases are also critical in case something goes awry, since all of your data is stored therein. It is obviously important to understand how your databases operate, as well as how replication and sharding work, so that you can keep your databases healthy and performing optimally.
Together, the MongoDB exporter and Prometheus enable required metrics monitoring, helping to identify issues with your MongoDB servers. Logz.io helps to overcome the challenges of managing Prometheus at scale by handling all management and operations of Prometheus, and its supporting tools. It also makes it easy to run, operate, visualize, and add alerting for the metrics you’re shipping – providing deep insights into your MongoDB cluster and easing overall management.


