
How to Migrate from Splunk to the ELK Stack
September 20, 2017
You can read all about ELK vs. Splunk in this article, but if you’re already using Splunk, there will come a time when you might be interested in switching systems.
Why? Good question.
For starters, let’s think about how we measure things – a number in itself is useless unless we have a basis for comparison. This basis can be achieved by determining what is “normal.” This is true for logs as well. Extracting stats from logs can be valuable in determining what should be the default or base number. The more data you collect (your sample size), the more accurate the “normal” mark becomes, and the more an anomaly would stand out.
More on the subject:
Therefore, it’s important to collect as much data as possible. Splunk’s “pay by log data volume” use model, however, where costs can add up quickly, encourages exactly the opposite. In ELK, on the other hand, you’re limited only by your own storage; meaning, you don’t pay for every log.
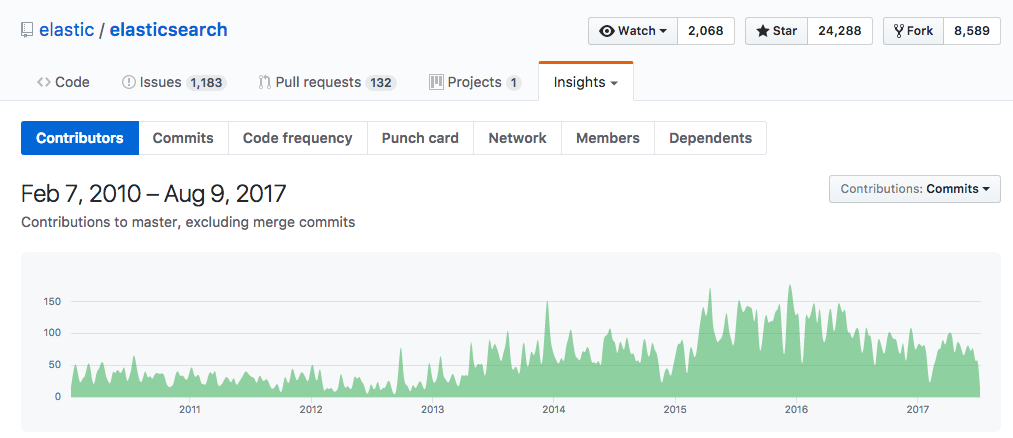
Of course, the cost is important, but the quality of service is also a matter of grave concern. And here Splunk enjoys the reputation of being the “de facto Google of log searches.” But this is changing as well. A few years back ELK was a niche product, but interest is growing as the product matures, as is prevalence of use, as shown in the graph below.
Another consideration is that businesses are aspiring to be more flexible. This, combined with the enormous amounts of data collected and stored, makes the actual process of switching between services highly complex, and leads, especially in cases of enterprise services, to vendor lock-in. This brings us back to the topic of this article: how to migrate from Splunk to ELK.
Export Your Splunk Log Data
One of the first challenges users face (especially those who have been using Splunk for years) is how to export and where to store data. In this section, we will describe different methods for exporting data from Splunk and how to use Logstash to import the data into Elasticsearch.
Exporting Data Using the UI
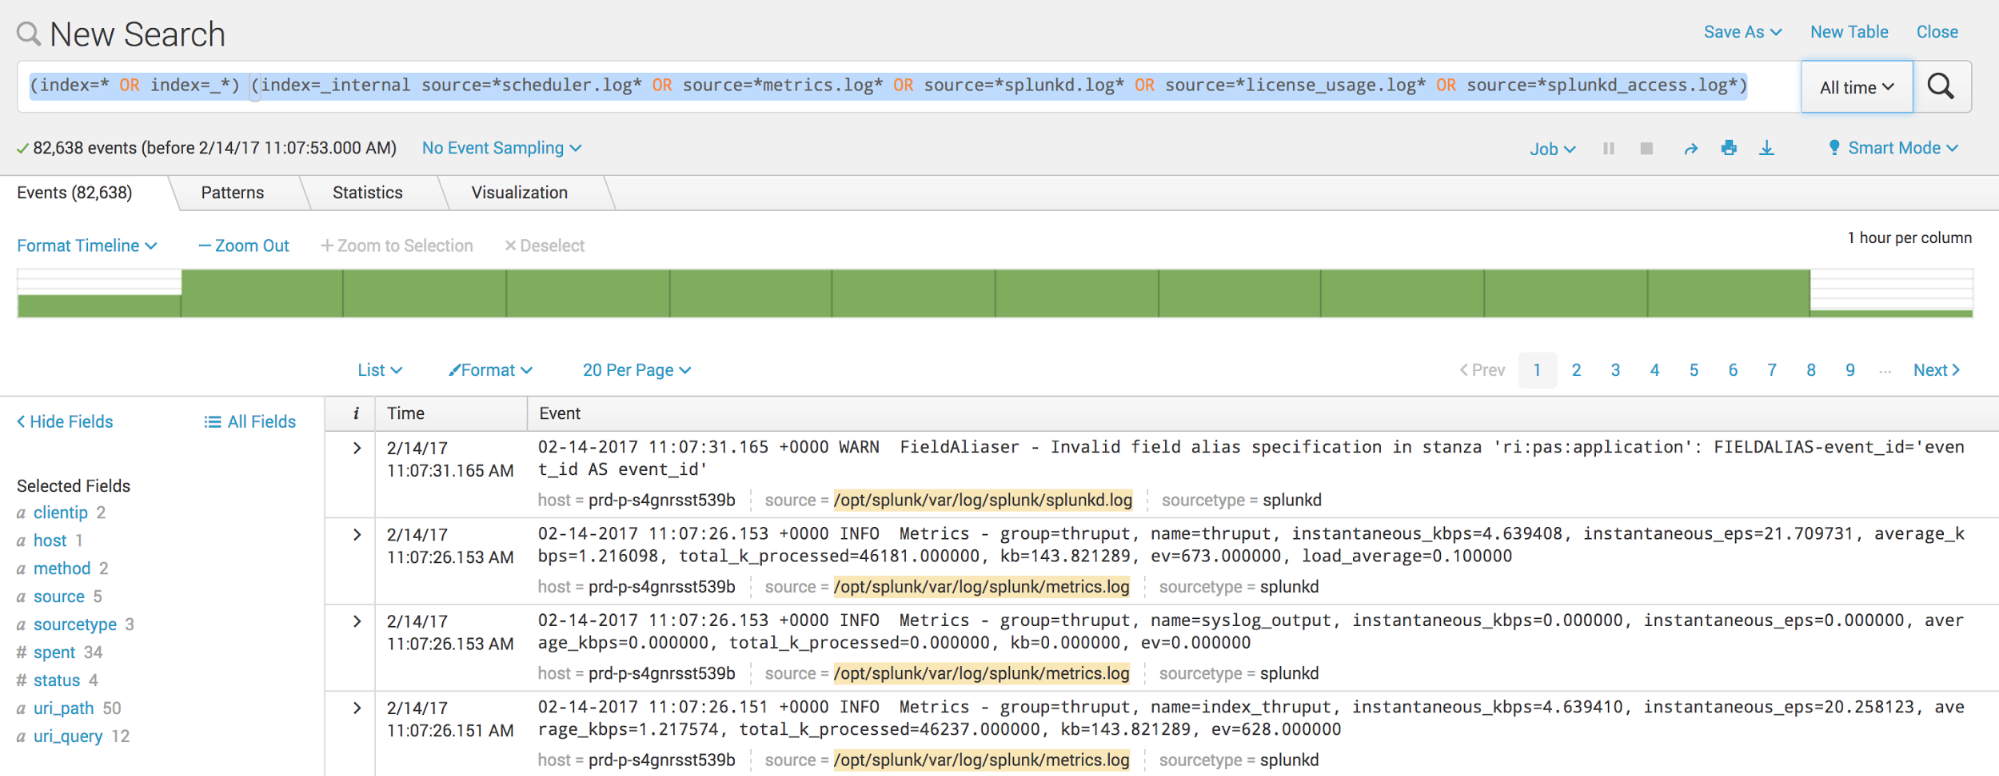
One of the easiest ways to export data from Splunk is using the Web UI. In the search text box, type a search query for the logs you want export. The query will search through the indexes containing the logs from this source files: metrics.log, splunkd.log, license_usage.log, splunkd_access.log and scheduler.log.
Then click the Export icon to display the Export Results dialog box.
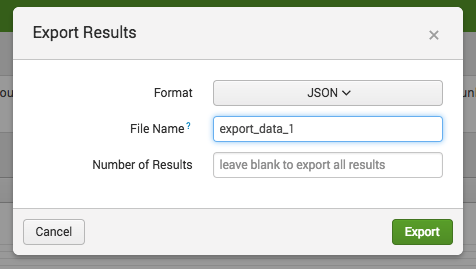
Specify the required file format, file name, and number of results, then click the Export button.
The supported file formats are CSV, XML, and JSON. For this example, we will use a JSON format because it’s easier to read when it’s opened in a text editor to manually validate the data.
It’s also easy to ingest via Logstash because the JSON property will be used during indexing where each property is marked as a searchable field. We will leave a blank field for the number of results in order to receive all results.
Next, in the Save dialog box, select the path where the data file will be saved in your storage.
Note: If you use the Web UI and the export result is large, go to Settings > Server Settings> General Settings, and increase the session timeout setting in the Splunk Web section.
Exporting Data Using the CLI
The Command Line Interface (CLI) can be used inside a script as part of your whole automated migration workflow.
The CLI can be used in this format:
splunk search [eventdata] -maxout 0 -output [rawdata|json|csv|xml] > [export_file_1.log]
where the maxout 0 is for an unlimited number of events, and output defines the format of the output. Here’s an example using the CLI to download all the events for a typed query as a parameter:
splunk search "(index=* OR index=_*) (index=_internal source=*scheduler.log* OR source=*metrics.log* OR
source=*splunkd.log* OR source=*license_usage.log* OR
source=*splunkd_access.log*)" -output json -maxout 0 > /path/export_data_1.log
Exporting Data Using Dump Command
For Splunk Enterprise deployment, exported search results can be saved on a local disk with the dump command:
dump basefilename= [rollsize=] [maxlocal=] [compress=] [format=] [fields=]
where the basefilename parameter is required, and the other parameters are optional.
Here’s an example that exports all events from a particular index to the local disk on path $SPLUNK_HOME/var/run/splunk/dispatch//dump/, with the file name defined in parameter basefilename:
index=bigdata | dump basefilename=export_data
Importing Data into Elasticsearch
Once the exported data is on disk, they can be imported into the Elasticsearch using Logstash configuration. Logstash supports a variety of data sources and one of them can be the files.
The Logstash configuration contains three parts: the input source, the filter, and the output destination. The input source is the section of the configuration where we define from which source the logs will be taken; the filter section of configuration is for transforming the data, and the output is the destination to where we want to send the logs. In our example, the source will be the files we exported from Splunk, the filter will be configured to take the data from the source and interpret it as JSON, and the output will be Elasticsearch.
input {
 file {
  type => "json"
  path => "/path/logs/export_data.*.log"
  start_position => beginning
 }
}
filter{
 json{
  source => "message"
 }
}
output {
elasticsearch {
  hosts => ["127.0.0.1:9200","127.0.0.2:9200"]
 }
}
In the example above, the path in the file section is defined to take all files that start with export_data and have the extension log, with a start position parameter that indicates we want to start processing from the beginning of the file. The filter section is there to transform data from input to output, because Logstash adds additional fields when it processes lines from the file; original data is located under source property following the input phase. The output section defines Elasticsearch as the destination for our data, where the nodes of the Elasticsearch cluster are located in the hosts array. If we have only one node, we can put it there.
Using Splunk Forwarders and Logstash
Splunk forwarders can also be used to forward raw data over a plain TCP socket or packaged in a standard syslog.
By configuring outputs.conf, props.conf, and transforms.conf, users can configure a heavy forwarder to route data outside of Splunk. This method is especially important when the user wants to continue indexing the logs during the migration process. The Logstash transforms the forwarder’s syslog messages into events. It filters part of the configuration to extract the data, then stores it to make it searchable.
Here’s an example of the configuration where the Logstash output destination is located under the path – $SPLUNK_HOME/etc/system/local/outputs.conf:
[syslog]
defaultGroup=syslogGroup

syslog:syslogGroup]
server = <;logstash_IP>:5000
The Logstash configuration is now defined as:
input {
 tcp {
  port => 5000
  type => syslog
 }
}
filter {
 if [type] == "syslog" {
  grok {
  match => { "message" => "%{SYSLOGTIMESTAMP:syslog_timestamp} %{SYSLOGHOST:syslog_hostname} %{DATA:syslog_program}(?:\[%{POSINT:syslog_pid}\])?: %{GREEDYDATA:syslog_message}" }
  add_field => [ "received_at", "%{@timestamp}" ]
  add_field => [ "received_from", "%{host}" ]
 }
date {
   match => [ "syslog_timestamp", "MMM d HH:mm:ss", "MMM dd HH:mm:ss" ]
  }
 }
}
output {
 elasticsearch {
        hosts => ["127.0.0.1:9200","127.0.0.2:9200"]
 }
}
In the input configuration file above, we defined tcp and udp plugins to listen on port 5000, which is our dedicated port for receiving data from Splunk forwarders. The filter parses the poorly unstructured messages that the forwarders sent into a structured and queryable log. We need a way to convert them into structured data that we can later query using Kibana. The best option for doing so it by using the grok plugin, which is included in Logstash as a pre-installed tool.
Migrating Visualizations
From Splunk, charts can easily be migrated to Kibana.
More on the subject:
Kibana, by default, supports a lot of charts which can be easily constructed from the Visualize sections. For example, timechart on Splunk can be converted to the Kibana line chart using an aggregation function.
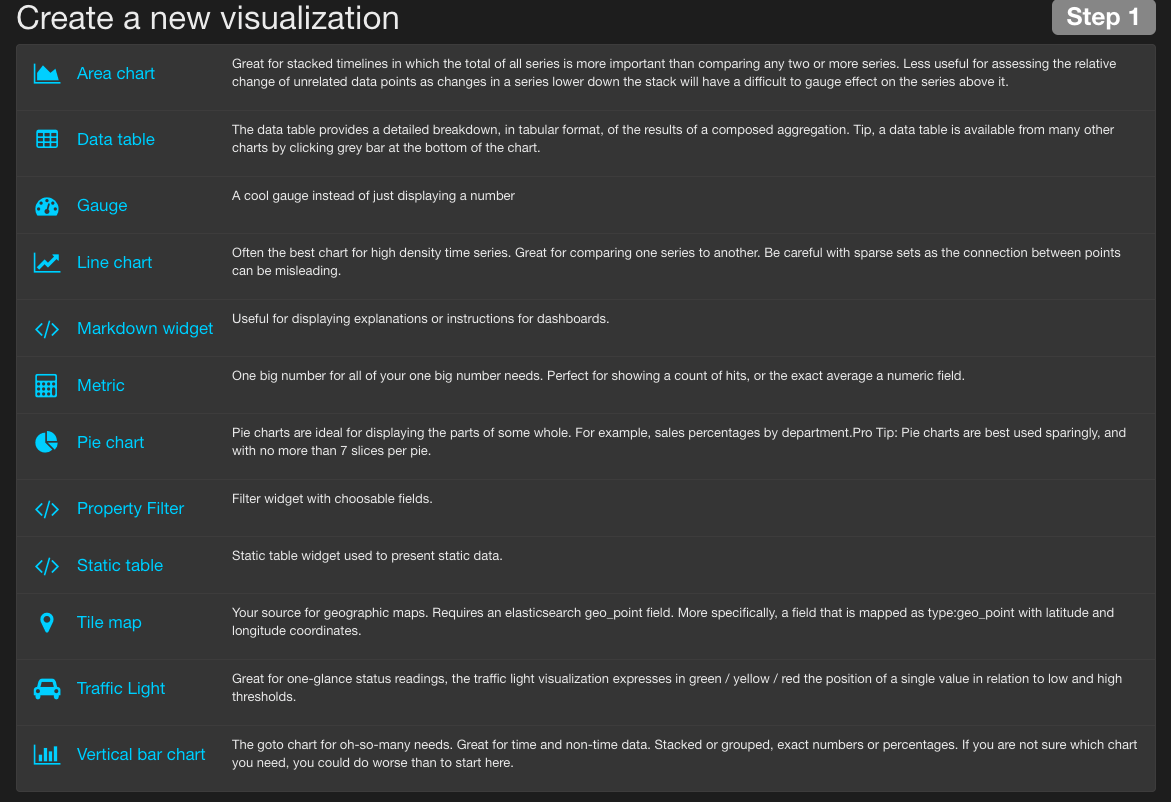
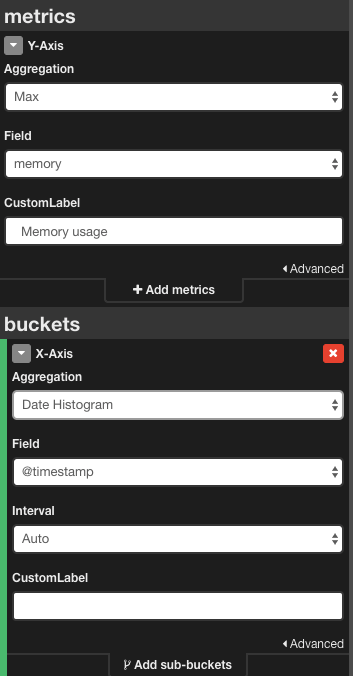
For example, the area chart created with Splunk:
... | timechart max(bytes) as “Maximum memory use”
…can be transformed in the Kibana area chart by selecting the aggregation function from the Y-axis section in the Kibana and selecting the X-axis representation.
All other charts supported in Splunk can be transformed in Kibana as described above. Like Splunk, Kibana allows for the addition of custom visualizations so those with basic developer skills can easily extend the built-in visualization functionality.
Final Notes
As a managed service, Splunk offers users enterprise features, such as security, high availability and scalability, that ELK, in its raw open-source form, does not. If you’re using Splunk, you don’t have to worry about growth and future expansion.
But, ELK has reached a level of maturity where managed enterprise-grade services based on the stack are available, making it a totally viable logging and monitoring solution for IT operations and DevOps teams. If “open source” does not frighten you, there is no real reason to take ELK off the “logging tools to check out” list.

You Might Also Like

Automatically Convert Grafana Dashboards from InfluxQL to PromQL with a New Open Source Tool

