
Metricbeat vs. Telegraf: Side-by-Side Comparison
June 20, 2019

Responsible for collecting various system and service metrics and forwarding them downstream to a backend storage system, the role metric collectors play in monitoring pipelines is crucial. Despite this fact, they often get left in the shadows cast by the beautiful frontend analysis tools like Kibana or Grafana.More on the subject:
In the world of open source monitoring stacks, Metricbeat and Telegraf stand out as the most popular metric collectors. The truth is that they do much more than simply collect metrics. They tap into a wide variety of systems and running services, collect metrics at set intervals, execute a variety of data processing and enhancements before shipping the metrics to various different output destinations.
But which one to choose? Both were designed as part of two very different stacks, so is there even a choice to make here? This article compares the two metric collectors in an attempt to answer these questions.
Introduction
While both these collectors are native to two different monitoring stacks, ELK (Elasticsearch, Logstash and Kibana) and TICK (Telegraf, InfluxDB, Chronograf and Kapacitor), they can and should be considered separately. Both integrate with different data sources and can output to different destinations and can therefore also be used for different use cases.
Let’s start with the basics.
About Metricbeat
Metricbeat is data shipper for collecting and shipping various system and service metrics to a specified output destination. Metricbeat (previously called Topbeat) belongs to the Beats family of data shippers (Filebeat, Heartbeat, Auditbeat, etc.) and is usually used in data pipelines based on the ELK Stack. Built upon Libbeat and written in Go, Metricbeat is extremely lightweight and nimble and was designed to be easily installed and configured on edge hosts in your architecture.
About Telegraf
Telegraf is also a data shipper for collecting and shipping metrics and is most commonly used as the first component in a TICK Stack. Telegraf is also written in Go and extremely lightweight in nature. As opposed to Metricbeat, Telegraf boasts an extensive plugin ecosystem that allows users to collect metrics from a wide variety of systems, process them in a variety of ways and ship them to datastores, services,
message queues and other destinations.
Installation
Both Metricbeat and Telegraf support almost all the common installation scenarios, including all Linux-based operating systems and Windows using files or package managers. Both can also be installed with Docker using an official Docker image.
One difference is that Telegraf support for Windows is still stated as being experimental. Another difference that might matter for Kubernetes users is the availability of an official daemonset configuration which Elastic provides for Metricbeat but is not available for Telegraf. This makes it much simpler to deploy Metricbeat in a Kubernetes setup since it deploys Metricbeat per node in the cluster automatically.
Installing Metricbeat
The instructions below are for installing Metricbeat on Ubuntu with apt.
First, add the beats repository.
wget -qO - https://artifacts.elastic.co/GPG-KEY-elasticsearch | sudo
apt-key add -

echo "deb https://artifacts.elastic.co/packages/7.x/apt stable main" |
sudo tee -a /etc/apt/sources.list.d/elastic-7.x.list
To install an alternative package licensed under Apache 2 license, use:
echo "deb https://artifacts.elastic.co/packages/oss-7.x/apt stable main"
| sudo tee -a /etc/apt/sources.list.d/elastic-7.x.list
Then, to install and start Metricbeat:
sudo apt-get update && sudo apt-get install metricbeat
sudo service metricbeat start
Installing Telegraf
The instructions below are for installing Telegraf on Ubuntu with apt.
First, add the InfluxData repository:
wget -qO- https://repos.influxdata.com/influxdb.key | sudo apt-key add
 -
source /etc/lsb-release
echo "deb https://repos.influxdata.com/${DISTRIB_ID,,}
${DISTRIB_CODENAME} stable" | sudo tee
/etc/apt/sources.list.d/influxdb.list
Then, to install and start Telegraf:
sudo apt-get update && sudo apt-get install telegraf
sudo service telegraf start
Configuration
Both Metricbeat and Telegraf are configured using a single configuration file that defines what data to collect, what to do with that data and where to ship it to. The main sections within this file follow a similar pattern, with a section for general settings and additional sections for handling inputs and outputs.
Let’s take a closer look.
Configuring Metricbeat
Metricbeat is configured using the metricbeat.yml configuration file located at:
- Linux (DEB/RPM) – /etc/metricbeat/metricbeat.yml
- MacOS – {extract.path}/metricbeat.yml
This file allows you to configure general Metricbeat settings as well as what modules to use. Modules define what metrics to collect and from what service. Each module specifies how to connect to the service, how often to collect the metrics, and which specific metrics to collect. Each module also has one or more metricsets which are responsible for fetching and structuring the data (see this article for a full list of these modules).
By default, Metricbeat is configured to use the system module to collect a variety of system metrics (e.g. CPU, load and memory), and ship them to a locally installed Elasticsearch instance. Additional modules can be enabled manually, using the metricbeat.yml configuration file, or using the metricbeat modules enable command. You can see a list of the modules and their default configurations under the modules.d directory (/etc/metricbeat/modules.d).
Other than defining what module to use, the metricbeat.yml configuration file can be used to tell Metricbeat how you want to handle the data. This is done using processors. For example, the drop_event processor you can drop an entire event based on an optional condition and a set of parameters.
The output section in the configuration file determines where you want to ship the metrics to. Currently, this includes Elasticsearch, Logstash, Kafka, Redis, File, Console and Elastic Cloud only.
General Metricbeat settings include a wide variety of options. You can set the name of the shipper, add tags, custom fields, and the maximum number of CPUs that can be executed simultaneously.
Metricbeat settings cannot be tested but you can use this full example of the Metricbeat configuration file can be used for reference.
Configuring Telegraf
The Telegraf configuration file is located in different locations depending on the operating system and installation type:
- Linux (DEB/RPM) – /etc/telegraf/telegraf.conf
- MacOS – /usr/local/etc/telegraf.conf
Telegraf also allows you to set the location of the configuration file using the –config flag and the directory of your configuration files using the –config-directory flag.
The main sections that can be configured in the Telegraf configuration file are the agent, processors, aggregators, inputs and outputs sections:
- agent – in this section, you can configure general Telegraf settings such as the data collection interval, the batch size for metrics sent to the output plugins, the metric buffer limit, a flush interval and more.
- processors – this section is used to define what processor plugin you want to use. Similar to Metricbeat, processor plugins in Telegraf determine how metrics are handled and processed.
- aggregators – this section is used to tell Telegraf what aggregator plugins you want to use. Aggregator plugins generate new aggregate metrics based on the metrics collected. For example, the ValueCounter aggregator plugin counts the occurrence of values in fields and emits the counter according to a defined schedule.
- inputs – like the modules in Metricbeat, the inputs section in Telegraf defines which service you want to collect metrics from.
- outputs – this is where you define what output plugin to use for shipping metrics to.
Other than the agent section, the other sections declare a specific Telegraf plugin to use, where each plugin includes specific configuration settings. Telegraf settings can be tested using the -test flag and you can use this full example of the Telegraf configuration file can be used for reference.
Pluggability
Both Metricbeat and Telegraf plug into the various systems they are monitoring and collect sets of metrics from them. Both can apply processing if required. And both then ship this data to a defined output.
The similarity ends here. The two collectors differ both in the variety of systems they can plug into and the supported output destinations with a clear advantage here for Telegraf, supporting over 200 different plugins for various systems and platforms as well as for executing processing and aggregation functions.
Inputs
Telegraf provides over 100 different input plugins whereas Metricbeat provides about 40 modules. Still, the most commonly used platforms are supported by both: containers — Kubernetes (still experimental for Telegraf) and Docker; message queues — Kafka, Redis and RabbitMQ; databases — MySQL, MongoDB, PostgreSQL and Prometheus; web servers — Apache, Nginx.
As can be expected from an ELK-native tool, Metricbeat allows users to monitor all the stack’s components — Elasticsearch, Logstash and Kibana, with dedicated modules. And vice versa, Telegraf provides an input plugin for InfluxDB.
While Metricbeat recently added support for collecting Amazon CloudWatch metrics, Telegraf has the upper hand here with support for other cloud services such as Google Pub/Sub and Amazon Kinesis.
Processors
Both collectors support multiple methods of processing, filtering and enhancing metrics before they are sent onwards to the defined output. In Metricbeat, these are called processors whereas in Telegraf they are simply processor plugins.
Both support the renaming, adding and dropping of fields. With the exception of the ability to add metadata to events using processors, it seems like Telegraf currently supports a wider variety of methods to play around with metrics.
For example, the REGEX plugin allows you to manipulate fields and change tags using REGEX expressions. The Parser plugin, in another example, allows you to parse defined fields and to create new metrics based on the contents of the field. Another interesting processor plugin is the TopK plugin, enabling users to collect the top series over a period of time.
Outputs
Here as well, Telegraf comes on top with almost 30 supported output destinations. Among these, are outputs for cloud services such as Azure Monitor, Google Stackdriver and Pub/Sub and AWS CloudWatch and Kinesis, as well as other time series databases such as Graphite, OpenTSDB and Prometheus.
As can be expected from an ELK-native tool, Metricbeat supports outputting metrics to both Elasticsearch and Logstash whereas Telegraf provides only an Elasticsearch output.
Both collectors support shipping to file and message queues — Metricbeat to both Kafka and Redis, Telegraf to Kafka only.
Performance and monitoring
Both shippers are extremely lightweight with a low resource footprint. It’s very rare, if not impossible, to encounter performance complaints.
Based on a very basic benchmark test performed on an EBS-optimized t3.2xlarge Amazon instance, with 8 vCPUs and 32 GiB memory, Metricbeat seems to have a larger footprint yet it’s still negligible in terms of overall performance. The Kibana dashboard below shows spent CPU and used memory by Metricbeat and Telegraf, both configured in this test to ship system metrics from a single host.
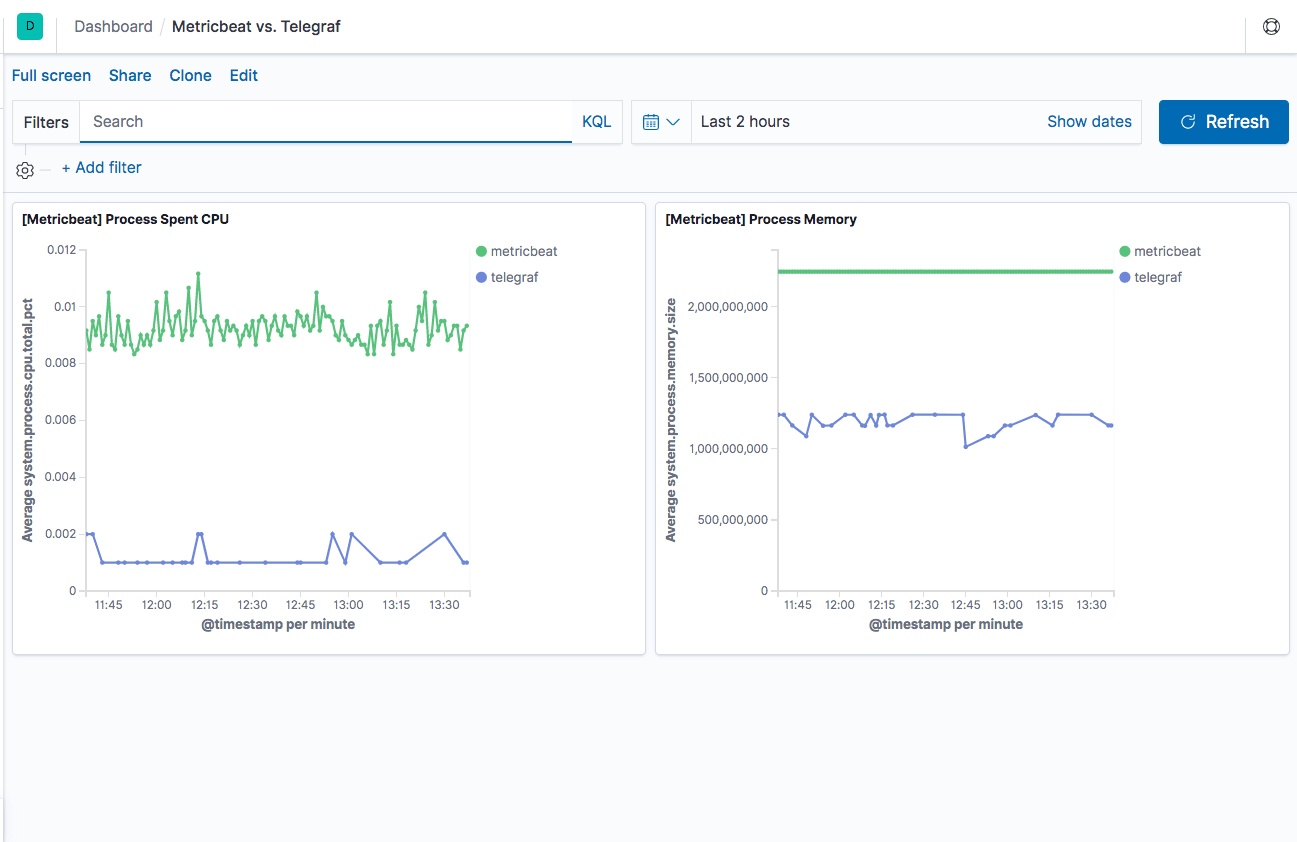
This is definitely not representative of how the two shippers would perform in a production environment but still might indicate a slight advantage for Telegraf.
For keeping tabs on performance, Metricbeat can be monitored using new monitoring features within Kibana (used to be an X-Pack feature). Telegraf does not provide any built-in monitoring capabilities so you are pretty much on your own here. Both shippers provide logging which can be used for troubleshooting.
Community & help
Both Metricbeat and Telegraf are pretty popular, each considered as a de-facto standard metric shipper for their respective stacks, ELK and TICK. Let’s take a look at some key indicators that can shed light as to how popular these two shippers are.
Metricbeat
The ELK Stack is today the world’s most popular open source log analytics and log management system and this popularity has helped Metricbeat become a widely-used metric shipper. Still, Metricbeat usage remains primarily within the framework of ELK-based pipelines.
Resources: Metricbeat offers users documentation and online forums.
Stats:
- GitHub (for all Beats): 2492 forks, 7370 stars, 9191 commits, 357 contributors.
- Docker pulls – N/A.
- StackOverFlow – 242 results.

Telegraf
Similar to Metricbeat, Telegraf’s wide usage and popularity stem from the stack it belongs to and specifically, InfluxDB. As opposed to Metricbeat though, Telegraf’s plugin ecosystem allows it to be integrated with a large number of platforms, thus extending its usage outside the TICK stack.
Resources: Telegraf offers users documentation, as well as online training, forums and a slack channel. A nice addition here is a live playground that allows users to play around with Telegraf and InfluxDB in a hosted demo environment.
Stats:
- GitHub: 2601 forks, 6870 stars, 3947 commits, 570 contributors
- Docker pulls: +10M pulls
- StackOverFlow – > 500

Summing it up
So what metric shipper to use?
From a performance perspective, both are extremely nimble with a low footprint. Both do a good job in collecting and shipping a variety of metrics, support almost the same data processing actions, and are relatively easy to configure and use.
Your decision as to which shipper to use will most likely be influenced from what monitoring stack you are using. If you’re an ELK user, Metricbeat will be the more natural choice. If you’re a TICK user, it’ll be Telegraf. However, Telegraf’s extensive plugin list makes it much more flexible, which means that you might end up using Telegraf and TICK for metrics, perhaps in combination with Grafana for analysis and visualization, and the ELK Stack for logging.
Telegraf’s Elasticsearch output plugin is limited to version 5.x so it can’t be considered for use with the ELK Stack if you’re using a current version of ELK.
Metricbeat
Telegraf
License
Apache 2.0
MIT
Size (compressed)
18.5 MB
20 MB
Modules/Plugins
40 (input only)
200+ (input, output, processor, aggregator)
Written in
Go
Go
Native stack
ELK (Elasticsearch, Logstash & Kibana)
TICK (Telegraf, InfluxDB, Chronograf and Kapacitor)
Supported OS
Linux, Windows, Mac, Docker
Linux, Windows, Mac, Docker
Build-in dashboards
Yes
No
Monitoring
Yes
No
Logging
Yes
Yes
Community & help
Docs, forums
Docs, forums, slack channel, online training, playground

You Might Also Like

The 2025 Wake-Up Call for Engineering Teams

