Integrating Logz.io with PagerDuty & Using Aggregations for Alerts
November 30, 2016

One of the most popular features Logz.io provides its users with is the built-in alerting mechanism. Coupled with the rich indexing and querying capabilities that are part and parcel of Elasticsearch and Kibana, Logz.io Alerts is a powerful tool to have on your side in day-to-day operations.
This article will introduce you to some of the latest updates to the feature applied over the past few weeks, namely — the ability to trigger alerts on field aggregations and the new integration with PagerDuty.
Integrating with PagerDuty
For starters, I’m going to describe how to integrate Logz.io with PagerDuty. The result of the steps described below is an ability to get alerted when specific conditions that you define are triggered in your ELK Stack environment via PagerDuty.
Retrieving a PagerDuty Service Key
We will start with a crucial element required for integrating Logz.io with PagerDuty — the service key. PagerDuty service keys are basically integration API keys that are required for integrating with PagerDuty services.
To retrieve a service key, first, log into PagerDuty and go to Configuration | Services.
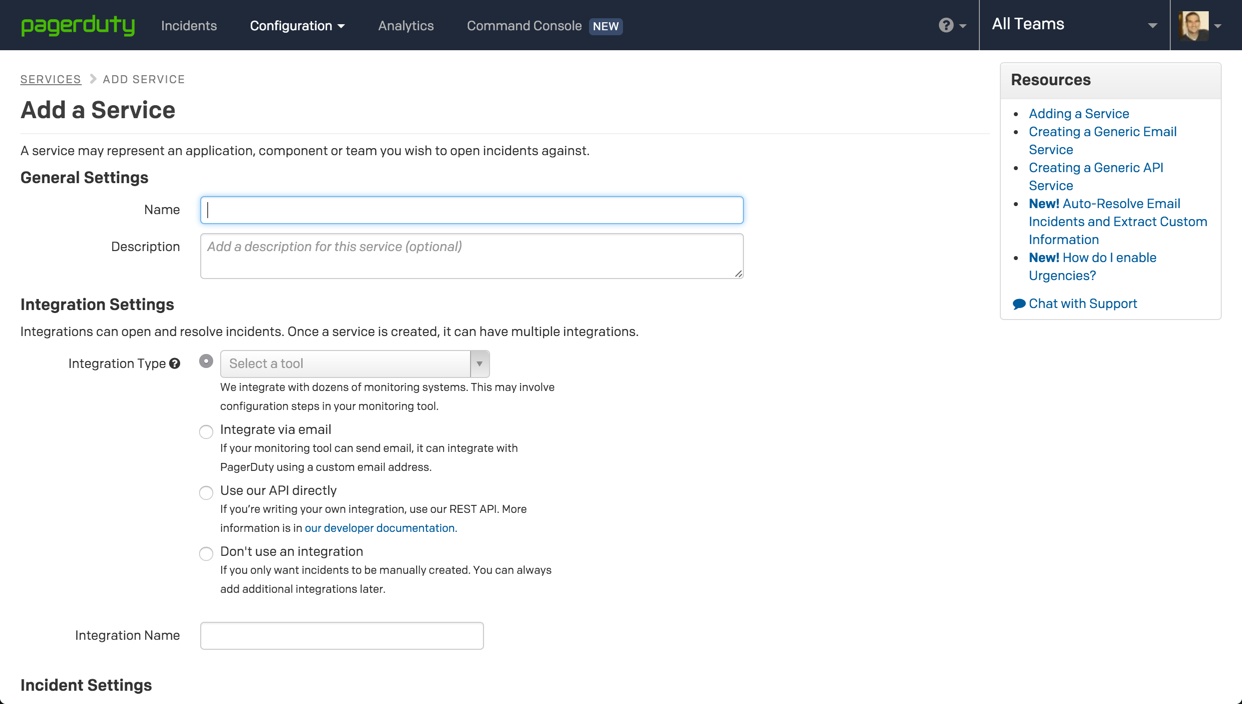
You now have the choice of either using an existing service or creating a new one. As a best practice and for the sake of order and segregation of services, I recommend creating a new service for integrating with Logz.io.
To do this, click Add New Service (if you want to add the Logz.io integration to an existing service, select it from the list of services, go to Integrations, and click New Integration).
Name the new service, and in the Integration Settings section select the Use our API directly option.
There are some additional settings to services, such as escalation policy and incident timeouts, but for now, you can do with the default settings.
To create the service, name the new integration, and hit the Add Service button at the bottom of the page.
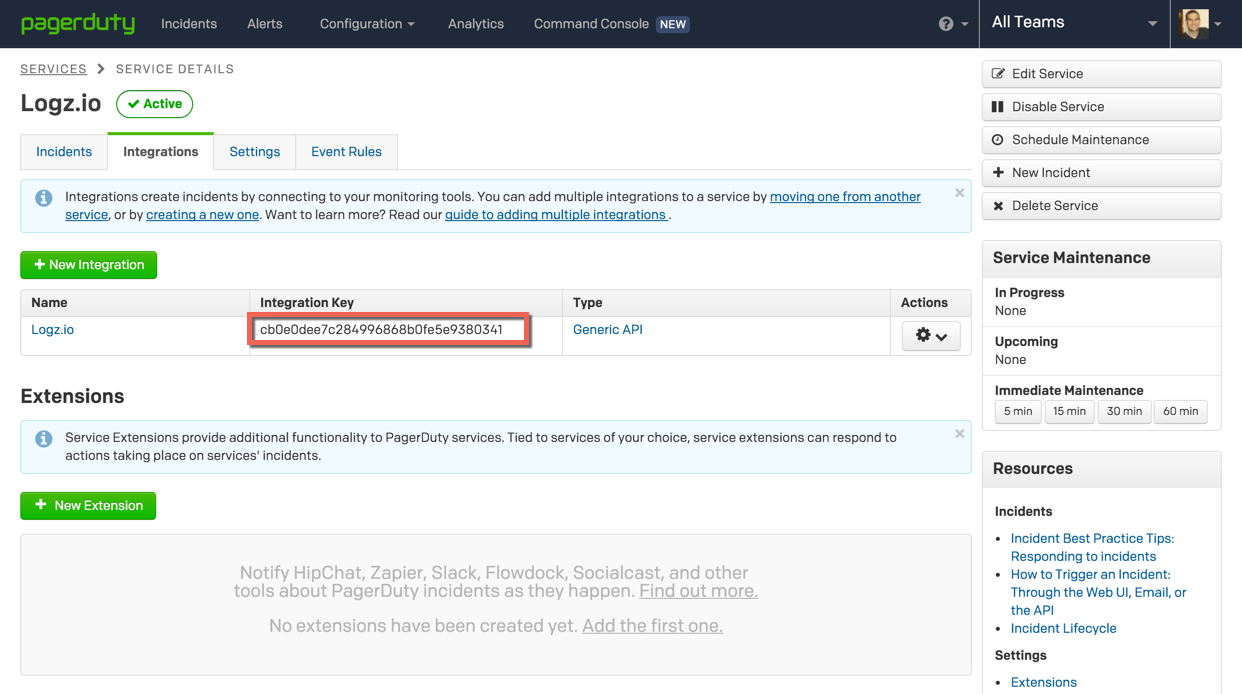
The service is added, and under Integrations, you will be able to see the service key needed to integrate with Logz.io.
Creating a New Endpoint
Logz.io allows hooking into any paging or messaging app that uses webhooks. In this blog post, we described how to hook into Slack to get notified on events. Now, you can easily integrate with PagerDuty as well.
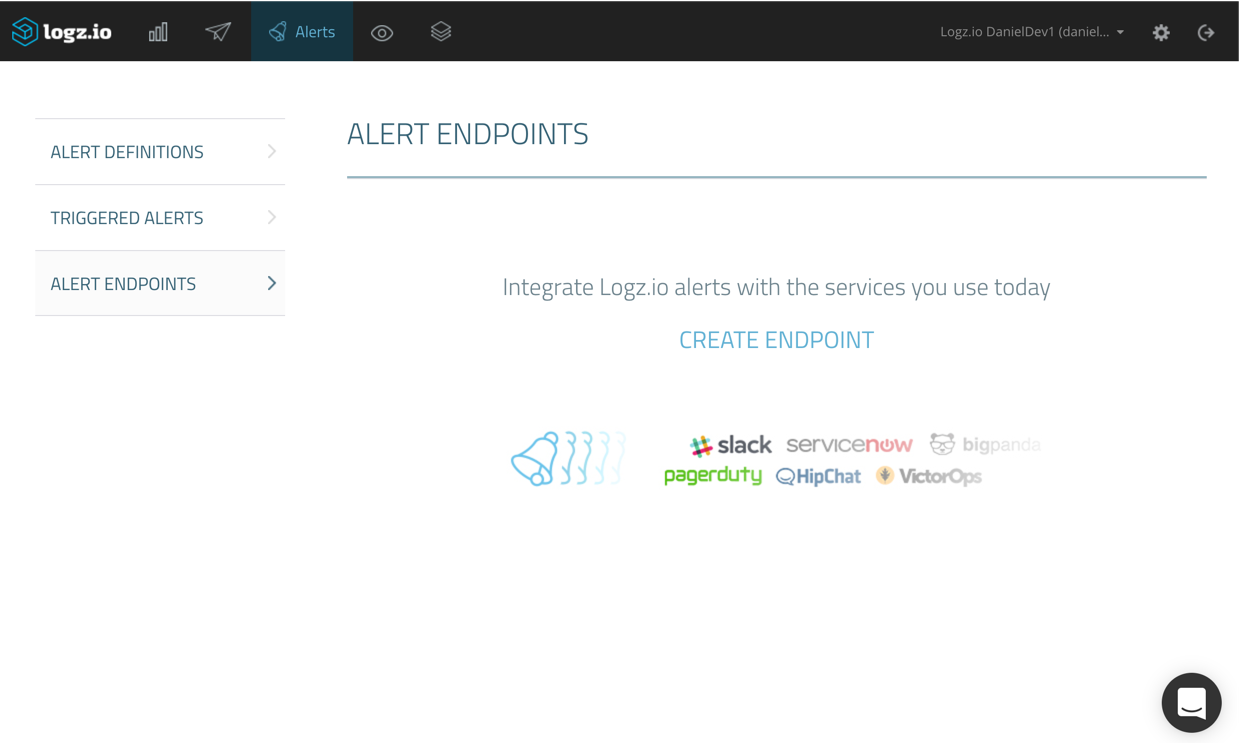
You can create new endpoints, and edit existing endpoints, from defined alerts, but we will start fresh by creating a new endpoint from the Alert Endpoints page under Alerts.
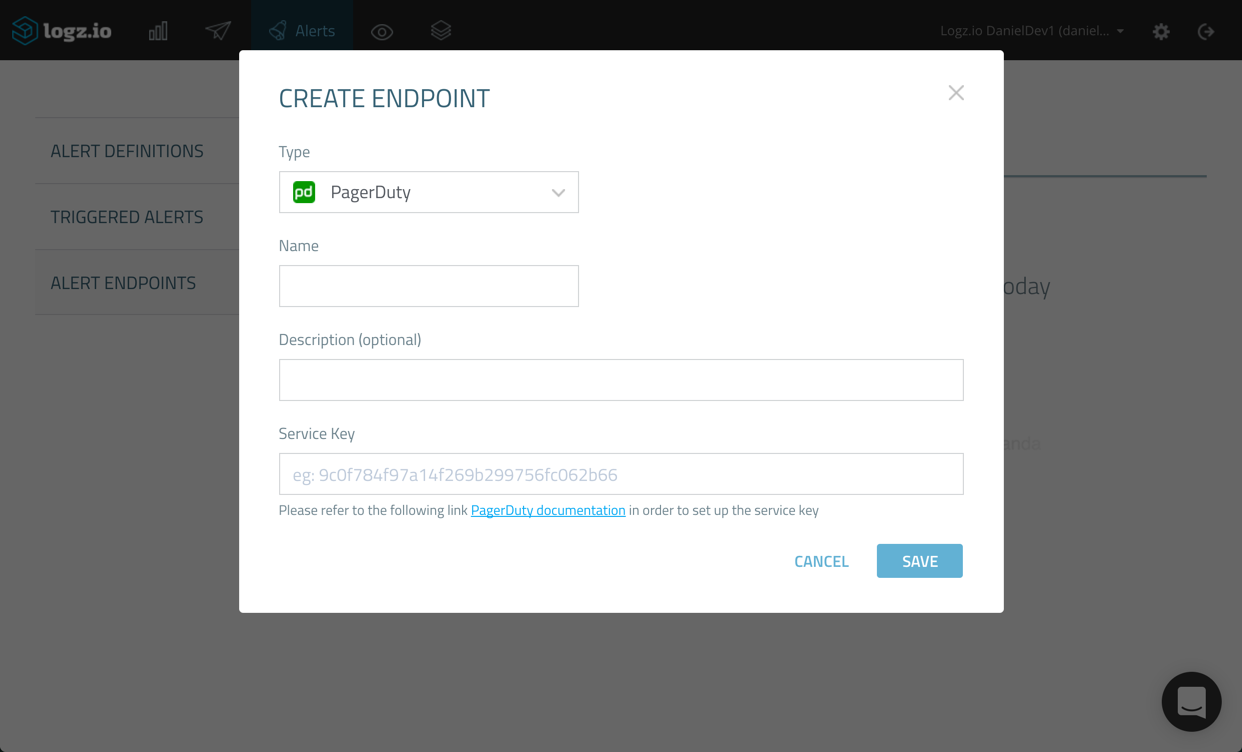
Clicking the Create Endpoint link opens the Create Endpoint dialog.
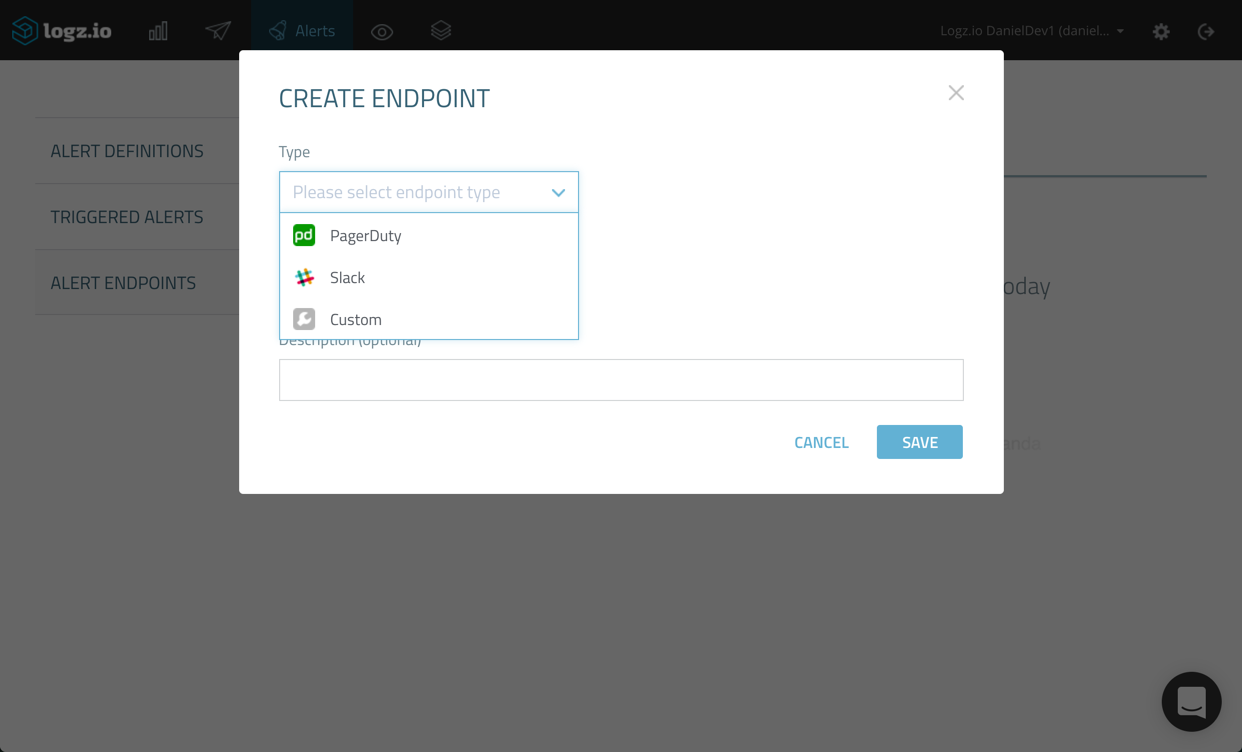
Here, you have the choice to select what kind of endpoint you want to add. As mentioned already, you can create a new custom endpoint in which all you have to do is define the REST API and webhook used, but in our case, we’re going to select the built-in integration with PagerDuty.
Name the new endpoint and give it a description (optional). Then, enter the PagerDuty service key we created in the first step above.
When done, click Save. The new PagerDuty endpoint is added.
Creating a New Alert
It now starts to get interesting. Let’s take a closer look at how to create a new alert and the different alert types we can use in Logz.io.
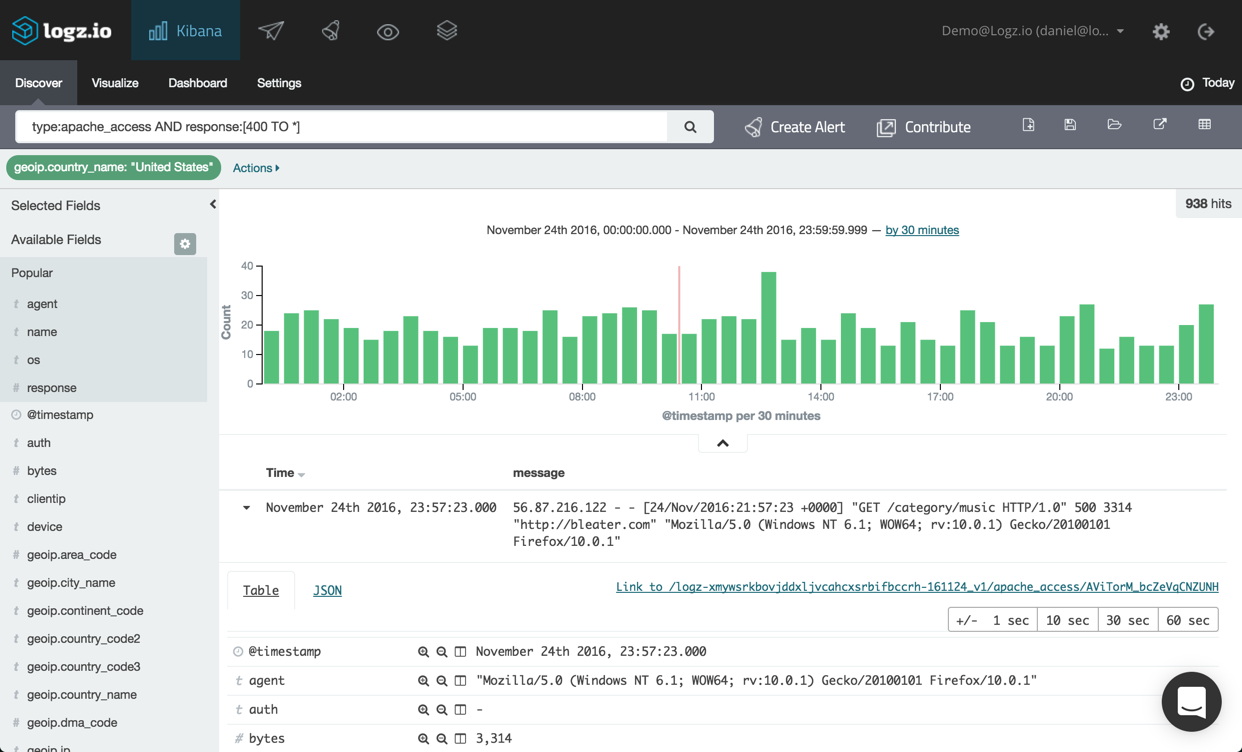
In the example below, I’m analyzing Apache access logs, and have used a filtered query to have Kibana show only Apache log messages containing an error response starting from ‘400’ onwards, and only for requests from the United States.
To create an alert for this specific query, all I have to do is hit the Create Alert button next to the query field.
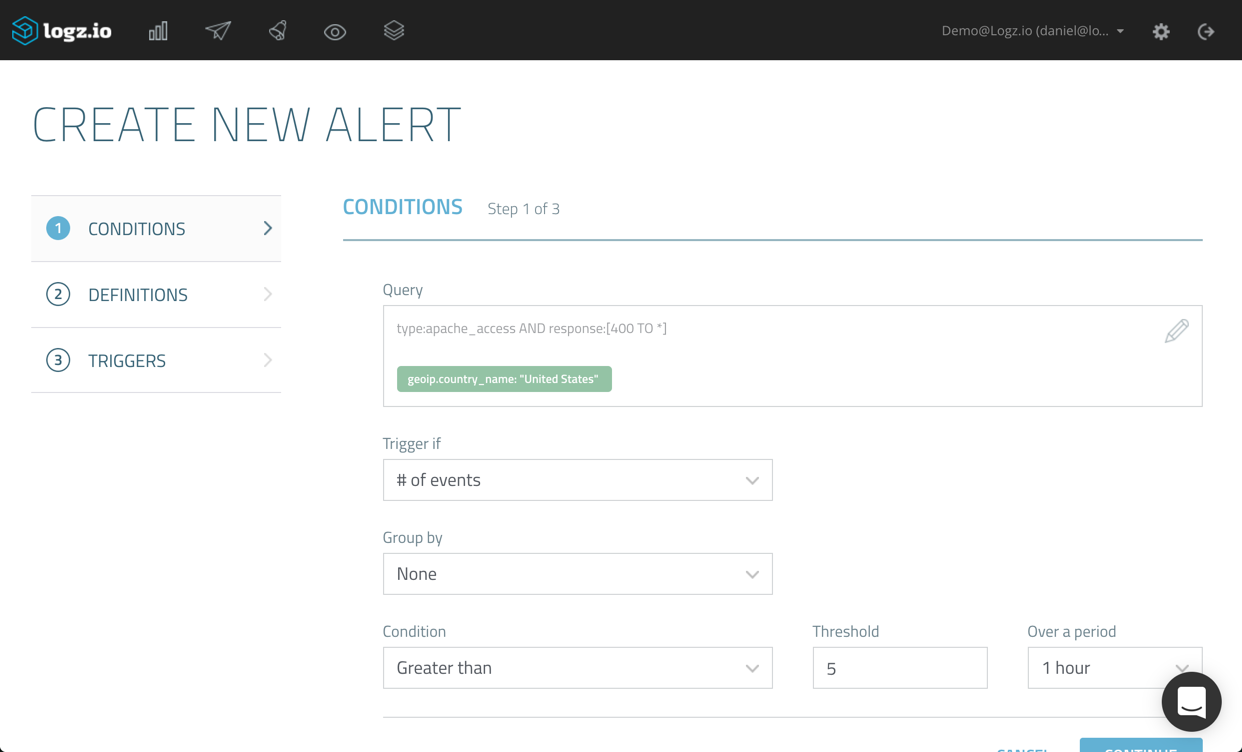
As you can see, the exact query, together with the filter I used, is defined as the query. If we wanted, we could edit this query by editing the syntax within the Query box. If our syntax includes an error, we will be notified so there’s no way of making any mistakes. A best practice we recommend is to double-check the exact query you’re using for the alert — either in the Discover tab or even by trying the query for building a visualization.
Now, you can decide what type of aggregation to use as the alert condition. A simple example is to use a count aggregation — meaning that an alert will be triggered should the query be found a defined number of times in Elasticsearch.
You can then configure the exact condition and threshold to use. In the example above, we’re instructing Logz.io to trigger an alert should the query be found more than 5 times and within a time period of the last hour.
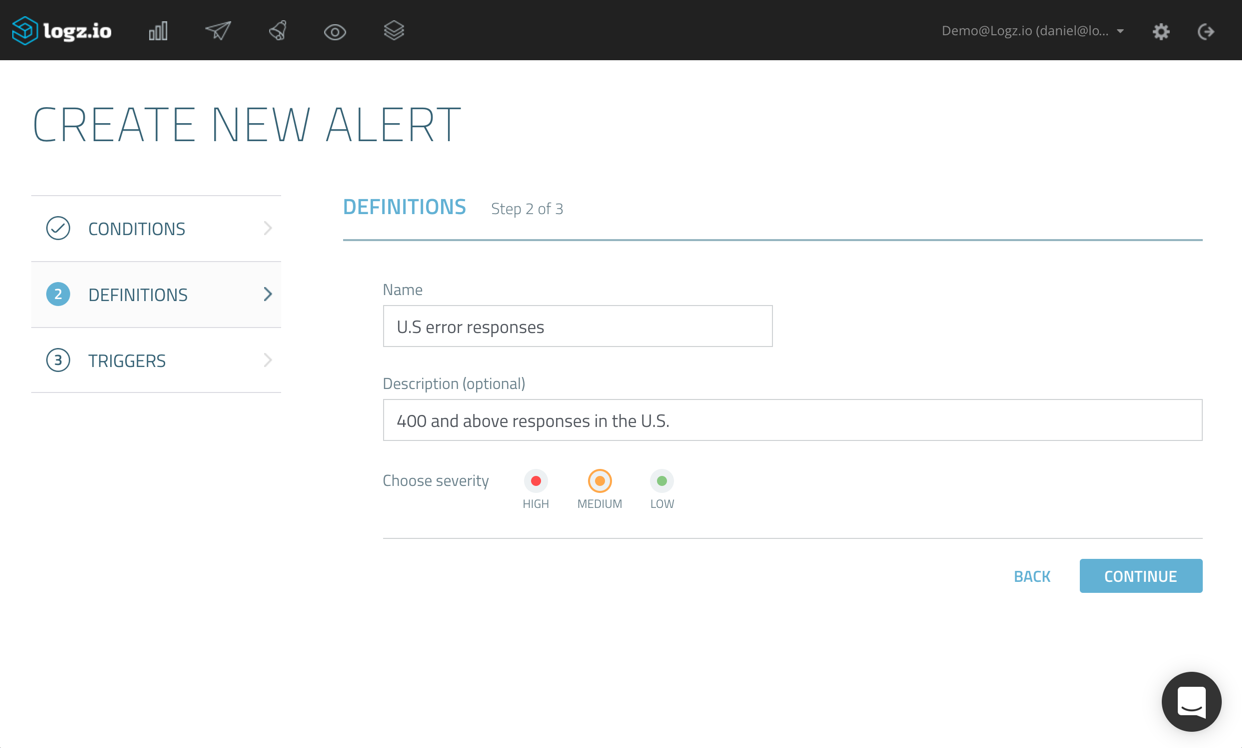
On the next page of the wizard, enter a name and description for the alert, and select a severity.
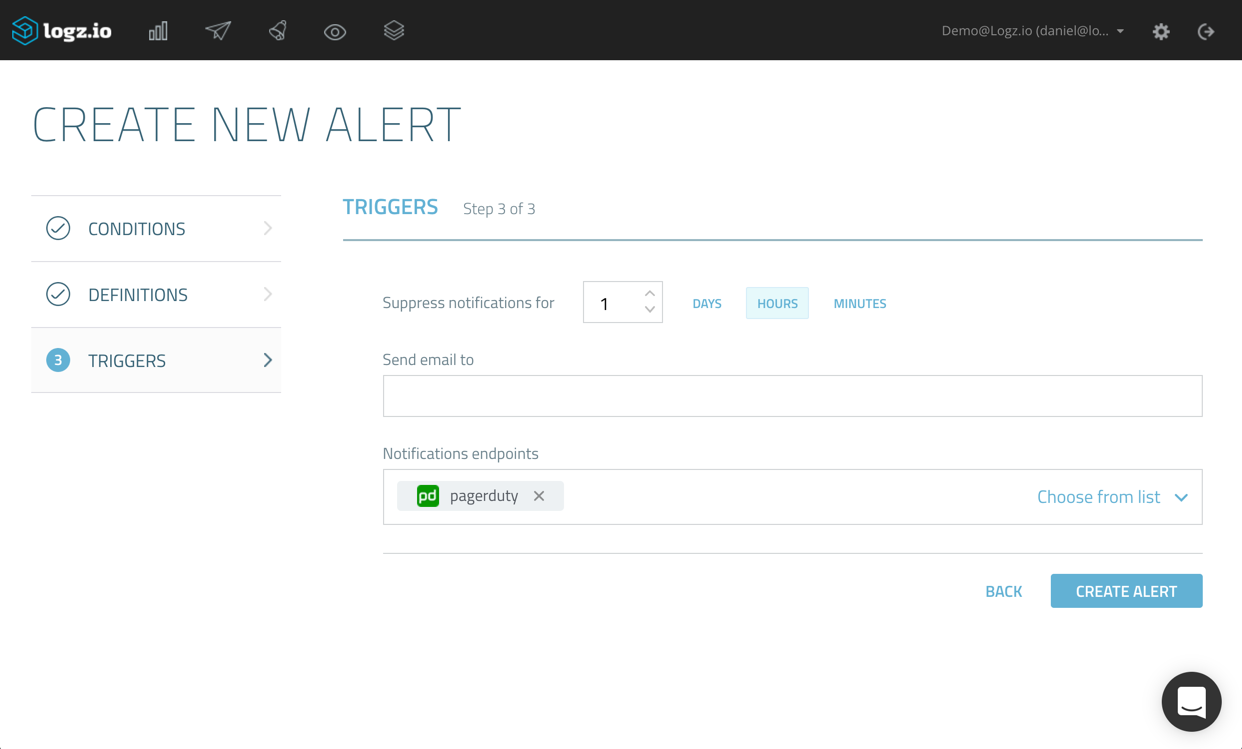
On the final page of the wizard, you can suppress alerts for a specific time period. This acts as a kind of “snoozing” mechanism, to make sure you don’t get bombarded by a large number of alerts once the first alert is triggered.
This is also the place where we decide how we want to be notified. Since we went to all that trouble of configuring a new PagerDuty endpoint, I’m going to select the drop-down menu and select it from the list of available endpoints (as mentioned, you could also create a new endpoint directly from this wizard as well).
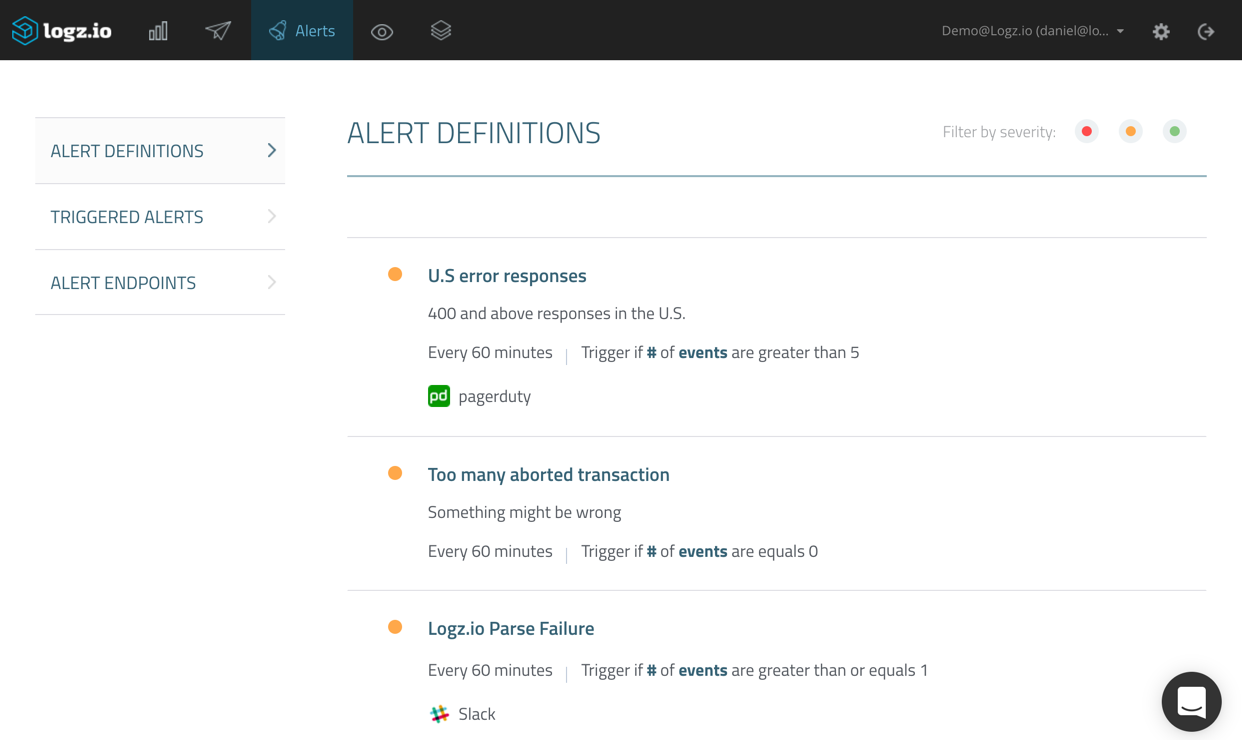
Hitting Create Alert, the new alert is then added to the other alerts I have defined in the system.
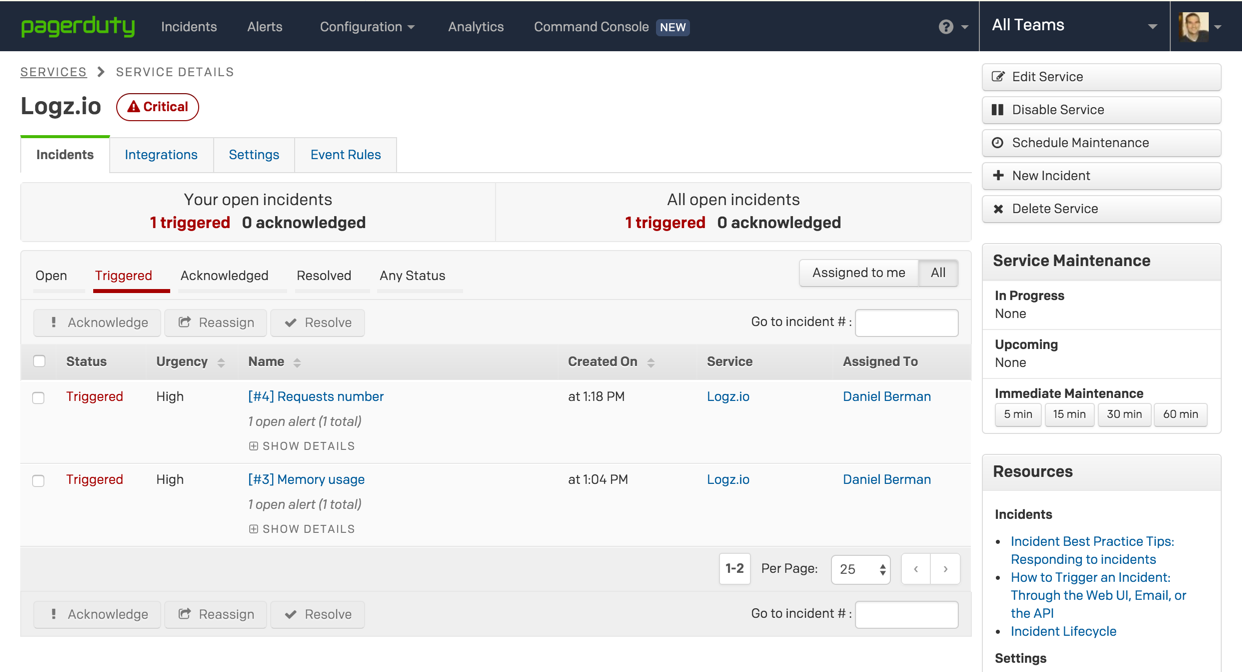
On this page, you can view your alerts, edit them and disable them if you like. In any case. From this point onwards, should the conditions you defined be fulfilled, Logz.io will trigger an alert. In PagerDuty, these are called incidents, and they will appear under the Incidents tab, on the service page.
Using aggregations for alerts
In Elasticsearch, metric aggregations help track and calculate metrics across fields in log messages. For example, say you’d like to monitor memory usage for your servers. Using the max aggregation, you can easily track the maximum relevant value in your logs across all the values extracted from the aggregated documents.
Logz.io now supports creating alerts using aggregations: max, min, avg, and sum. Let’s see how this works.
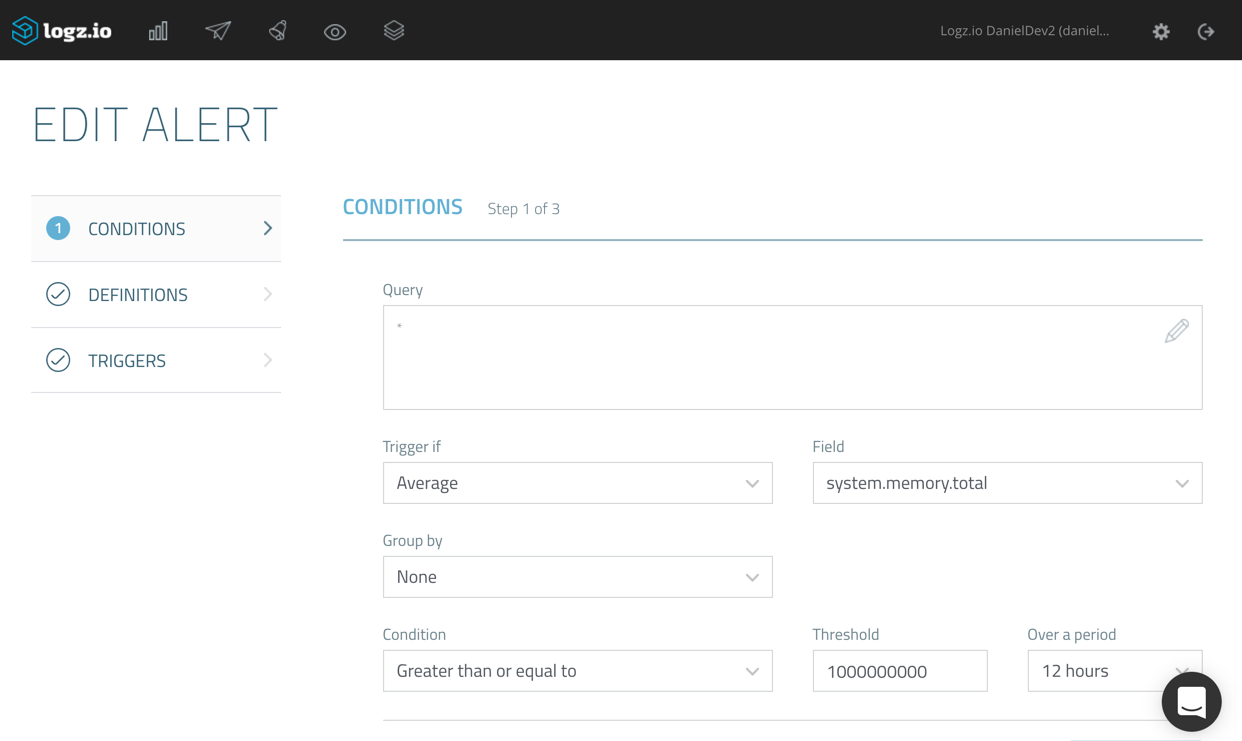
In the example below, I’m monitoring server metrics using Metricbeat. Continuing the theme used above, I’m going to create an alert using an average aggregation on the ‘system.memory.total’ field.
I’m asking the Logz.io alerting engine to trigger an alert should the aggregated average value exceed ‘1000000’ during the last 12 hours (Logz.io checks if conditions are met once every 60 seconds).
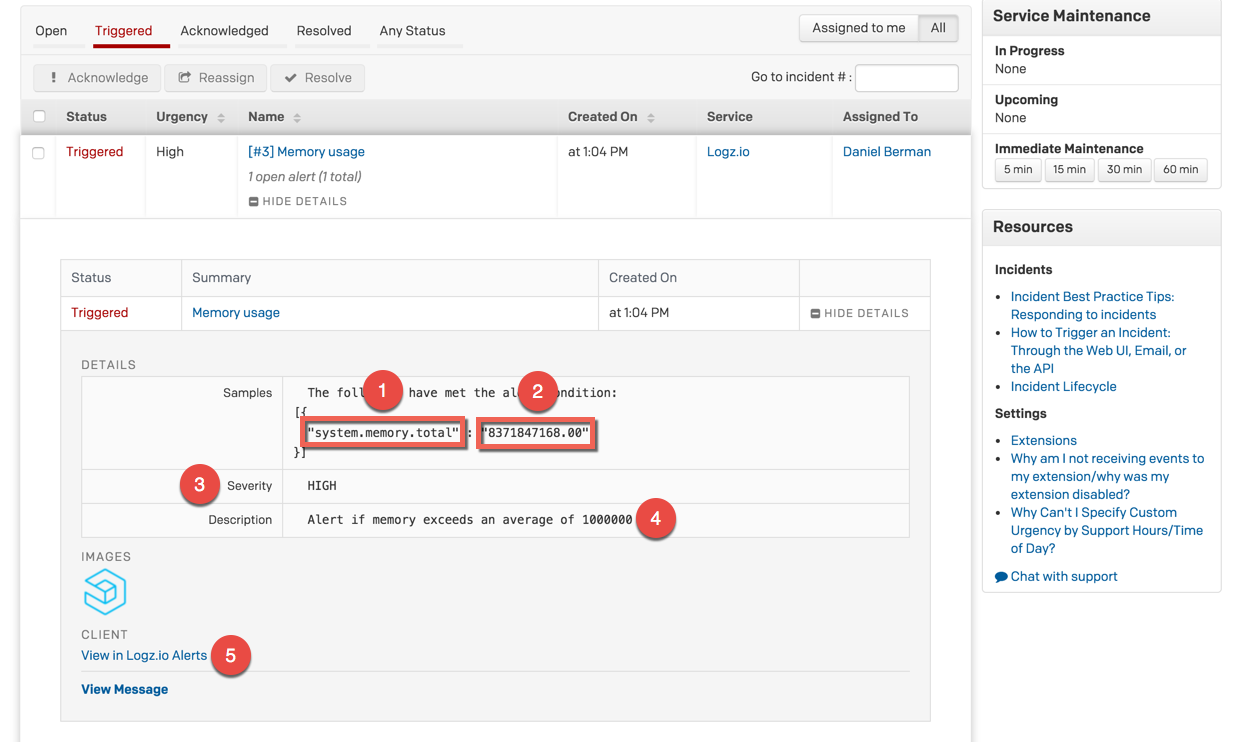
This is what the incident looks like in PagerDuty.
The details of the alert specify the conditions that triggered the alert in JSON format. In this case:
- The field upon which the aggregation was performed
- The result aggregation value
- Severity level
- Alert description
- Link to the alert in the Logz.io UI
Grouping aggregations in alerts
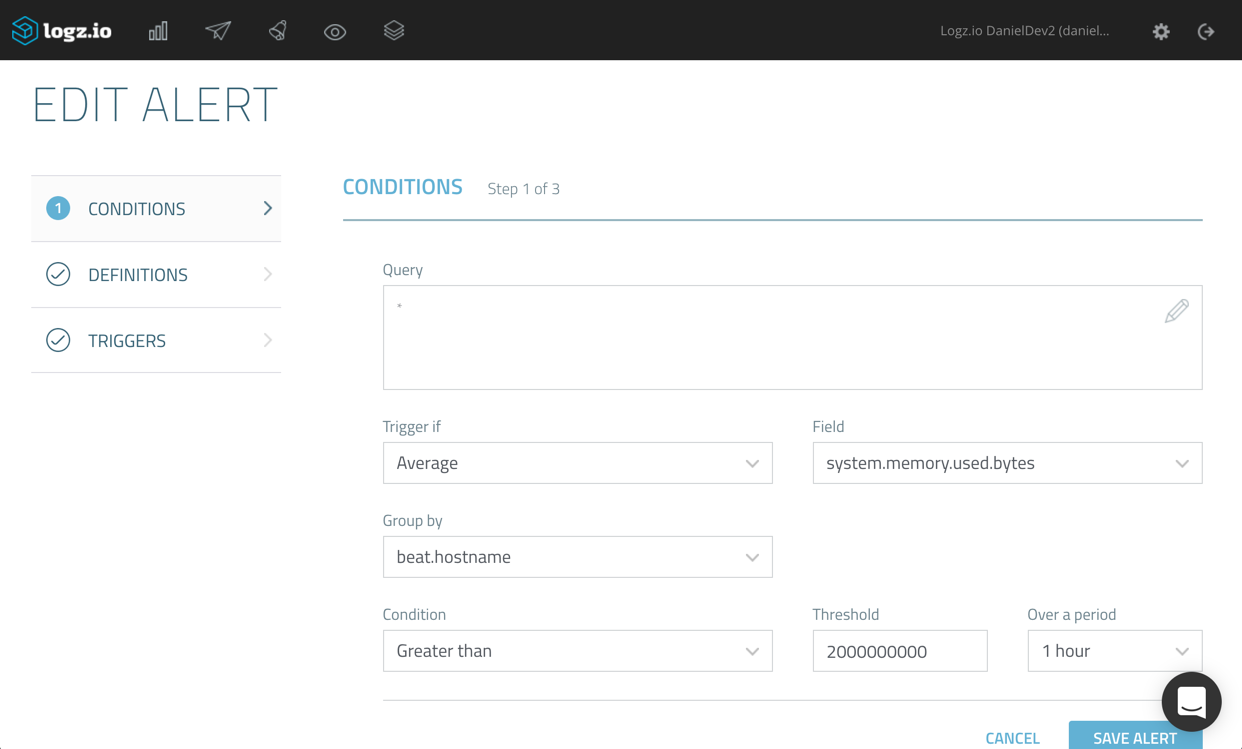
Another interesting option when creating an alert is to group together aggregations according to a specific field. Under certain circumstances, when the conditions for triggering an alert are similar across a specific field, grouping can save you the time configuring multiple alerts.
Say, for example, you’re monitoring the average amount of used memory in your environment.
In the example below, we’re going to define an alert that will only trigger if the aggregated average for the ‘system.memory.used.bytes’ field equals or surpasses ‘2000000000’ for the last hour (free tip: a good way to decide what specific threshold to use is to first build a visualization for monitoring expected behavior).
In addition, we’re asking Logz.io to group together the aggregations per host (using the ‘beat.hostname’ field).
Taking a look this time at the alert details in PagerDuty, we can see that the aggregations are calculated and grouped according to the IP of the server.
[{
  "beat.hostname" : "ip-172-31-25-148",
  "system.memory.used.bytes" : "8030429184.00"
}
{
  "beat.hostname" : "ip-172-31-21-11",
  "system.memory.used.bytes" : "4636509696.00"
}]
So, instead of configuring two different alerts using a different query for each host, we grouped the aggregations together in the same alert. Again, this feature will be especially useful when the conditions for triggering an alert are identical for multiple values of a specific field.
A Summary
Since being introduced last year, and following both our growing understanding of how Alerts are being used and direct feedback received from our users, this feature has evolved to become an extremely powerful alerting mechanism for monitoring modern IT environments and troubleshooting events in real-time.
We have some great stuff in the pipeline, including some new integrations for other alerting and messaging applications. Stay tuned for news!
