Introducing Logz.io Dashboards (Beta): Shaping the future of unified Observability with Open 360
May 28, 2025
We’re thrilled to announce the Beta launch of Logz.io Dashboards – a major step forward in how engineers and DevOps teams visualize and analyze their telemetry data.

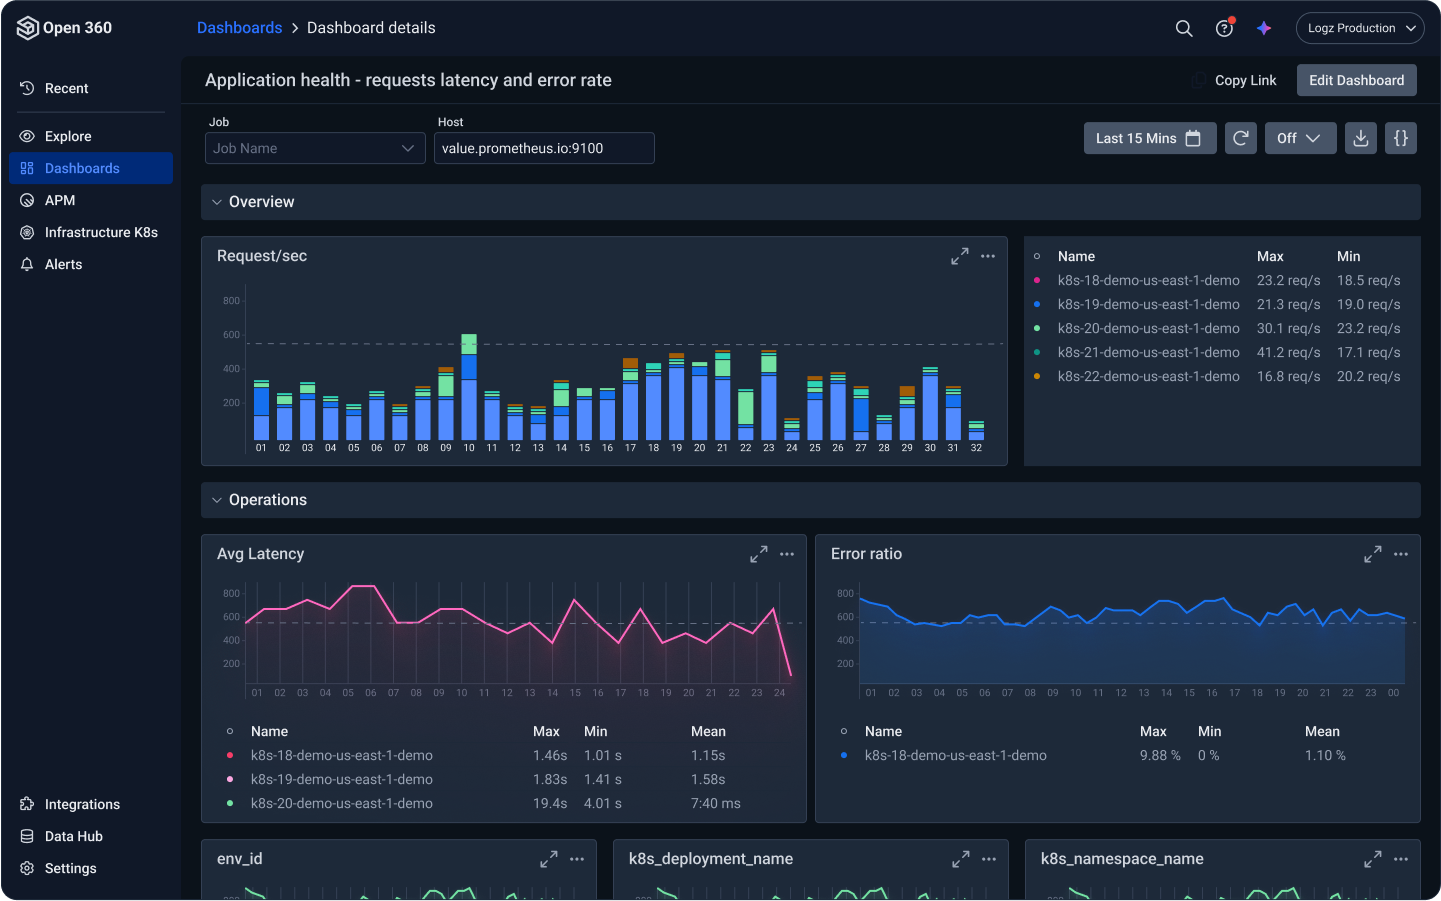
For the first time, Logz.io users can now create dashboards that bring together logs, metrics, and traces in a single unified view — making it easier than ever to monitor performance, detect issues, and troubleshoot incidents without switching tools or losing context.
This launch is more than just a product update. It’s a clear signal of where Logz.io is headed — and how we’re building the future of observability.
Why Dashboards, and Why Now?
Every incident starts with a question:
- Why did the error rate spike?
- Is this CPU usage normal?
- Which service is affected?
The first stop is almost always a dashboard. But when telemetry is split across tools and views, you lose context—slowing down detection, investigation, and resolution.
You told us you wanted faster investigations, smarter visualizations, and a simpler way to connect logs, metrics, and traces.
So, we built Logz.io Dashboards focusing on these key goals:
🔍 Earlier detection of anomalies and outages
🚀 Faster investigation of incidents and performance regressions
🛠️ Lower operational overhead in managing your observability workflows
But we didn’t stop there. When asked, “Why build another dashboarding experience?” – the answer is simple: Logz.io Dashboards are designed for both engineers and AI Agents.
Traditional dashboards only serve human workflows. Ours are built to also support AI, allowing it to interpret telemetry data, trigger alerts, automate root cause investigations, surface recommendations, and even initiate remediation workflows.
This human-AI synergy leads to faster responses, fewer repetitive tasks, and a platform ready for the future of observability, where humans and machines collaborate to keep systems healthy and teams efficient.
As one of our design partners shared:
“Having logs, metrics, and traces together changes everything. Troubleshooting takes minutes instead of hours.”
— Platform Engineering Lead, Global SaaS Company
What you can do with Logz.io Dashboards (Beta)
- Mix and Match Telemetry Types: Create visualizations from your logs, metrics, and trace data — side by side, in one view.
- Flexible Visualizations: Choose from time series, tables, bar charts, and more.
- Seamless Integration with Explore: Explore — Logz.io’s workspace for investigating and filtering logs — is fully integrated with Dashboards. Found an interesting trend? Instantly add any visualization directly into your dashboards without duplicating work.
- Add AI-generated Visualizations in One Click: Logz.io’s AI Agent now goes beyond insights, it builds visualizations as part of its investigative steps. You can instantly add any of the charts/graphs to your dashboards with a single click, making it easier to turn AI-driven analysis into shared, visual context for your team.
- Powerful Correlation: Click a spike in a graph and instantly drill into relevant logs and traces.
- Unified Platform Experience: Dashboards are fully integrated with Logz.io’s observability platform — built on the same scalable, secure architecture you already know and trust.
- Smarter Filters and Variables: Easily slice and dice your data across dimensions, services, and timeframes.
- New Table Column Types: Enrich your table visualizations with additional column types, such as links (for easier navigation across systems) and gauge columns (for quick status indicators) — making it even easier to turn data into action.
- Sharable Visualizations: Share dashboards with your team, with secure access controls built-in.
Logz.io Dashboards deliver the power observability teams need — without the complexity, high costs, or heavy setup often required by other solutions.
What’s coming soon to Logz.io Dashboards
As part of the Beta program, we’re actively evolving Logz.io Dashboards based on customer feedback. Here’s what’s coming next:
- AI-Assisted Dashboard Exploration: Easily ask questions about your dashboards and get guided insights — making it faster to understand trends, spot anomalies, and refine your visualizations.
- Pre-Built Templates: Quickly spin up best-practice dashboards for Kubernetes, AWS, microservices, and more.
- Alerting Integration: See active alerts directly on your dashboards.
- Full Trace View: Visualize complete trace flows directly within your dashboards.
- Enhanced Permissions and RBAC: More granular control over who can view, edit, and manage dashboards — empowering teams to collaborate securely across environments.
Dashboards are just the beginning: A vision where Observability flows
While Dashboards solve a major need, they’re part of a much broader transformation happening across Logz.io.
We’re building toward a vision we call Open 360 — a unified observability experience where data flows freely, insights surface automatically, and teams move through one connected platform and workflow with full context — no switching, no silos, no wasted time.
This vision is based on a few core principles:
- Open over proprietary. We’re committed to open standards like OpenTelemetry and OpenSearch because they give you long-term flexibility and prevent vendor lock-in.
- One platform, many signals. Logs, metrics, traces, alerts and events are deeply interconnected — yet too often split across tools. Open 360 brings them together so you can follow a single thread across all your data, with shared context and unified dashboards.
- From visibility to action. Observability isn’t just about knowing something is wrong. It’s about understanding why — and what to do next. That’s where our AI Agent and intelligent workflows come in.
- Every engineer, empowered. Observability shouldn’t require a dedicated team of experts. With self-service dashboards, intuitive exploration, and AI-driven guidance, every developer can get the insights they need without writing complex queries or jumping through hoops.
More than features — A new experience
This vision is already coming to life across the platform, and Logz.io Dashboards unlocks the workflow integration coming next:
- Logz.io Alerts – Provide a centralized experience for consuming, creating and managing cross-telemetry alerts. Enable the AI Agent for proactive root cause analysis (RCA) and automated incident response.
- APM (App360) – Offer an out-of-the-box yet customizable APM solution that supports diverse infrastructure types. Investigate applications and infrastructure together from a single, connected view.
- New Navigation – Deliver a clean, consistent, and personalized navigation experience. Maintain context across workflows and streamline user journeys from insight to action.
- Multi-Telemetry Explore – Enable users to explore logs, metrics, and traces in a single, correlated interface with a unified query bar. Prioritize insights over raw data to drive faster investigations.
- Homepage – Create an effective entry point that provides quick access to the AI Agent, high-level system insights, and a fast health assessment. Support personalized panels and visualizations to tailor the experience.
- AI Agent – Enhance the user-facing AI Agent to support smarter, cross-platform inquiries. It should understand and interact with all system entities — including dashboards — and be able to generate new ones like alerts and visualizations on demand.
We built Logz.io Dashboards to be the most intuitive, powerful way to visualize, explore, and act on your observability data—whether you’re a fast-moving startup or a scaling enterprise. With Open 360, this vision comes to life, offering a seamless flow of observability where every action, from detection to resolution, happens in one connected, intelligent platform.
Stay tuned — the future of unified observability starts here.
FAQs: Logz.io Dashboards and the road to Open 360
I’m already a customer, how can I try Logz.io Dashboards?
Logz.io Dashboards are available today in Beta. Head to the Dashboards menu to start building your first dashboard – or check out the documentation to learn more.
I’m new to Logz.io, how should I start with Logz.io Dashboards?
If you’re looking for a faster, smarter way to monitor and troubleshoot your environment, now’s the perfect time to start.
👉 See how Logz.io Dashboards can simplify your observability — Request a Personalized Demo or create your first Dashboard
Will Open 360 be priced separately?
No.
Will our new features including the AI Agents, Explore, App 360 and K8s 360 still be available in OSS (Open Source) UI-based experience?
With time we will move all the new capabilities to the Open 360 UI. The schedule is still TBD.
Will Open 360 replace the current OSS (Open Source) UI-based experience?
No. Open 360 will not replace the current experience and will run in tandem.
Will content (i.e., dashboards, alerts, etc.) created in one experience be supported in the other experience?
Partially. We will build a migration utility to allow migration from the OSS (Open Source) UI-based experience to Open 360.


