Best Practices for Kubernetes Monitoring with Prometheus
January 24, 2023

Kubernetes has clearly established itself as one of the most influential technologies in the cloud applications and DevOps space. Its powerful flexibility and scalability have inarguably made it the most popular container orchestration platform in modern software development, helping teams manage hundreds of containers efficiently.
However, Kubernetes and the applications running in its clusters create an advanced and complex technology stack, which means understanding the system’s overall status and the health of individual components is challenging.
Unlike the good old days when there was a single web server and database, today, hundreds – even thousands – of application instances typically run together. In addition, these components are highly dynamic, as they’re created, moved to other nodes, and scaled up and down according to usage. Consequently, this distributed and scalable architecture demands new monitoring methods.
This article will discuss monitoring Kubernetes applications with a Kubernetes-native solution, namely Prometheus. We’ll also cover the best practices for using the Prometheus monitoring system along with its key metrics, advantages, and drawbacks.
And lastly, we’ll see how Logz.io enhances Prometheus to simplify and accelerate cloud monitoring with Prometheus. Learn about the way Logz.io unifies and enhances the leading open source observability technologies here.
Kubernetes Monitoring
Kubernetes implements self-healing for applications running in a cluster. This means that if the containerized application somehow crashes or becomes unresponsive, it will be restarted by Kubernetes. Similarly, suppose the application is configured to have five instances. In this case, Kubernetes will ensure that precisely five instances are always up and running, even if the nodes go down or the network becomes faulty.
You may think there’s no need to monitor a platform where self-healing is a first-class citizen. However, there are two critical reasons to keep a close eye on a Kubernetes cluster:
- Insight into the cluster and resource usage: With effective cluster monitoring, it is possible to track the number of instances currently running and failed, along with tracking how many resources they consume.
- Greater observability: Observability lets you identify trends and answer complex questions in the application stack. For example, a small database configuration error could result in restarting frontend instances – a major issue; to find such correlations, collecting data for observability is critical.
It should be clear now why a failure to closely monitor Kubernetes is similar to navigating a large container ship on the vast ocean without a compass. So, let’s continue by examining the Kubernetes-native approach to monitoring, and also review how Prometheus and Kubernetes typically work together.
Prometheus and Kubernetes
Prometheus is an open-source monitoring system specifically designed for containers and microservices. It collects and aggregates metrics as time-series data, enabling users to execute flexible queries and create real-time alerts. Unlike older monitoring systems, Prometheus focuses on distributed applications and has maintained a cloud-native mindset since its beginning; all of this makes it the most popular tool for monitoring Kubernetes, distributed services, and containerized microservices.
Prometheus works via a pull-based system where it connects to applications and collects metrics from them, as seen below in Figure 1. With each scrape request, it fetches the metrics and stores them with a rich set of metadata. Prometheus can simultaneously monitor thousands of applications and store their data.

Prometheus and Kubernetes work together well because the exporters and service discovery components of Prometheus are tailor-made for Kubernetes applications. The labels, annotations, and named endpoints of these apps are vital inputs to Prometheus to isolate which applications and servers to monitor.
Prometheus offers a strong and easy-to-use query language named PromQL to query metrics for exporting or drawing as graphs. In addition, it is possible to use the same queries for alerts and use within Alert Manager or visualize with rich dashboards in Grafana.
In addition, the exporters are designed as small applications to run next to the main applications to connect and fetch metrics. This approach is also appropriate for container management of Kubernetes, such as sidecar containers for application metrics and DaemonSets for node metrics in Kubernetes.
Key Considerations
With its Kubernetes-native features and a highly active open-source community constantly driving its advancement, Prometheus is in fact the most adopted Kubernetes monitoring system. However, to use it efficiently, there are some proven best practices that engineers should attempt to follow, including:
Find the “Right” Metrics to Monitor
Monitoring implies an understanding of the overall status of the applications and infrastructure. But every team and application has a different set of business requirements and expectations, so it’s critical to list the target metrics before collecting them.
For instance, storage and data throughput metrics are critical for a distributed machine learning application, whereas latency and error rates are critical for a web server. However, storing a high volume of metrics – many of which may not prove to be useful in the long run – is not feasible as it will create storage challenges and most of the data will never be actively monitored.
Use Labels and Metadata
Kubernetes uses labels and annotations as the metadata of all resources in a particular cluster. Actually, labels and selectors are the critical parts of the Kubernetes API for mapping pods to deployments for scalability, or pods to services for availability. Labeling the resources with the application lifecycle (dev, test, prod) or business criticality (high, medium, low) is also helpful while collecting metrics and designing alerts.
Create Application Observability
Monitoring in modern software development is about far more than just collecting and analyzing CPU and memory metrics. You can now gather application-level metrics, such as the number of active users, the number of waiting requests in the queues, the average time to process requests, and network traffic. With the help of metrics from different levels, it’s possible to create application observability.
Predict Future Performance
Prometheus is capable of storing historical data for engineers to analyze and discover trends. These tendencies – for example, an increase in Saturday shopping or peaks in bank transactions on Monday mornings – help in configuring applications and optimizing their overall performance.
Observe the Kubernetes Control Plane
Kubernetes’ control plane is the brain of the cluster, as it manages everything running in it. Most operational activities, including scaling up and down or rescheduling, happen as part of the control plane. Therefore, monitoring the Kubernetes control plane is essential to know what’s actually happening in the cluster.
Manage and Watch Alerts
Alerts are notifications when something is wrong in the cluster and needs attention. They are configured with a set of calculations based on metrics and a given threshold. When a threshold is exceeded, alerts are activated. Therefore, designing and managing alerts in the monitoring system is essential. Prometheus has a native alert manager to handle alerts received from Prometheus metrics. Alertmanager takes care of grouping and routing of alerts to the receivers such as email, OpsGenie or PagerDuty to get a human’s attention as soon as possible.
You should keep all of these best practices in mind while designing a Kubernetes monitoring system with Prometheus, as they specifically benefit from the experiences and lessons learned of numerous organizations who have used these technologies in their environments.
Now, let’s discuss which key metrics are essential for Kubernetes monitoring.
Key Metrics
There are various metrics to keep an eye on in a typical technology stack for Kubernetes applications – from the infrastructure nodes all the way to containerized web servers. Below is a good set of metrics to start with.
Cluster Monitoring Metrics
These metrics are critical for understanding the overall health of clusters and the underlying infrastructure:
- Resource utilization metrics with CPU, memory, disk, and network bandwidth
- Node utilization with the number of pods per node
- Number of nodes with their health and distribution over availability zones, data centers, and regions
- Control plane metrics such as latency and error rates from Kubernetes API server, and controller managers
Pod Monitoring Metrics
These metrics are critical for understanding the performance and status of applications running in the cluster:
- Pod health and higher-level Kubernetes resources like deployments, StatefulSets, and DaemonSets
- Container-level metrics with requested resource levels and actual usage
- Application-specific metrics, such as the number of open connections or successful and failed requests
The Pros and Cons of Using Prometheus with Kubernetes
Prometheus typically suits Kubernetes nicely, with the many advantages listed below. However, the popular pairing could also be a lot more seamless in many scenarios, resulting in some drawbacks as well. Let’s take a closer look at both ends of the spectrum.
Pros
- Kubernetes-native mindset and integration with applications running in the cluster
- Strong query language to work with metrics
- Rich set of exporters and libraries to collect metrics from various types of applications
Cons
- Scalability of Prometheus is limited in terms of storage as it keeps metrics in a time-series database. A fast growing cloud-native application could quickly fill the disks of Prometheus servers and cause bottlenecks in the monitoring stack. You can read more about building a scalable Prometheus architecture in our related blog post: https://logz.io/blog/devops/prometheus-architecture-at-scale/
- Role-based access control is a critical missing element of Prometheus as everyone in a particular organization can access any metric from its API and dashboard. For large scale observability deployments with multiple tenants, in particular, the lack of role-based access control (RBAC) creates numerous compliance issues.
- Prometheus is a battle-tested metrics collector but it has no direct integration to log and trace data. Without holistic integration, it is nearly impossible to debug and make RCA in large distributed systems. It’s not practical for full scope observability in this standalone manner.
In summary, Prometheus is a great Kubernetes-native monitoring system, but it is not of itself an enterprise-ready monitoring platform. It requires the addition of some critical features – for instance, role-based access, user control, and audit trails – to become an enterprise-grade solution. As noted, it also does not have any feature or stated plan within the community for unifying logs and traces with metrics to achieve global observability.
Logz.io and Prometheus Integration
Logz.io is a cloud-native observability platform for logs, metrics, and traces that offers infrastructure monitoring powered by Prometheus, as well as features including user management, RBAC, logs, and trace correlation.
If you already have Prometheus in place, it’s extremely simple to start implementing Logz.io with a slight change in configuration. Prometheus metrics are streamed to Logz.io and stored for 18 months with automatic rollover. With Logz.io’s scalable Open 360™ platform, you can also analyze stored data and find trends and bottlenecks easily.
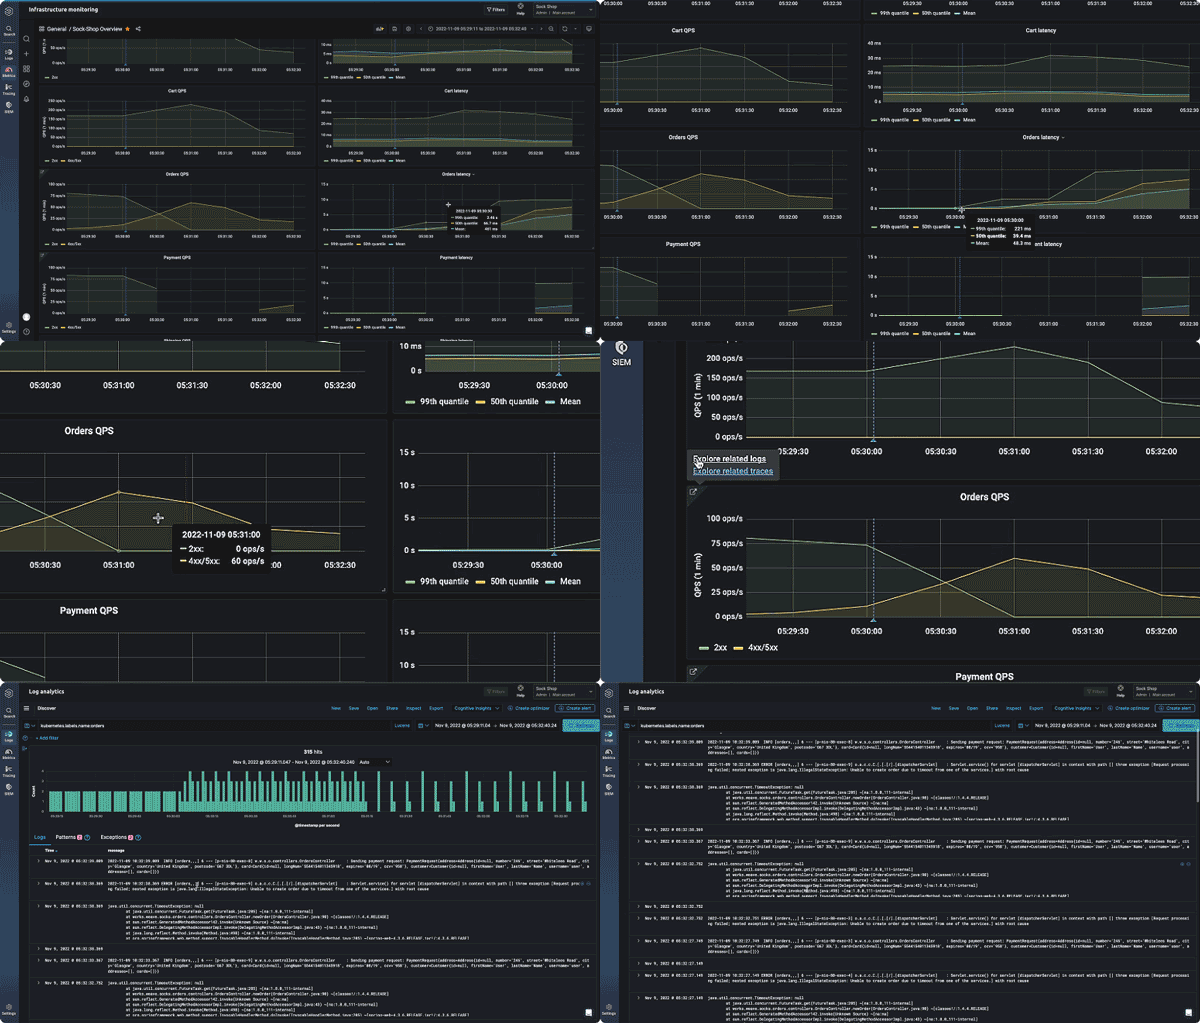
Logz.io is importantly a platform for achieving full observability, as it brings metrics, logs, and traces together for immediate correlation analysis. For instance, if there is a memory spike in your metrics, you can jump into logs and see which microservice is causing it:

Similarly, you can explore traces to discover which microservice operation is taking so much time:

When all the various streams of monitoring data that we’ve discussed here are collected and stored in a managed and scalable platform, automated correlation also helps you achieve greater observability. Logz.io also offers a rich set of alert and notification integrations, including Slack, PagerDuty, Gmail, Opsgenie, and Jira.
Get started today with a free 14-day trial of Logz.io, and monitor your Kubernetes applications with a modern cloud-native solution!


